A quadruply imaged quasar with an optical Einstein ring candidate: 1RXS J113155.4123155 ††thanks: Based on data collected at the European Southern Observatory, La Silla, Chile
We report the discovery of a new quadruply imaged quasar surrounded by an optical Einstein ring candidate. Spectra of the different components of 1RXS J113155.4123155 reveal a source at 0.658. Up to now, this object is the closest known gravitationally lensed quasar. The lensing galaxy is clearly detected. Its redshift is measured to be 0.295. Additionally, the total V magnitude of the system has varied by 0.3 mag between two epochs separated by 33 weeks. The measured relative astrometry of the lensed images is best fitted with an SIS model plus shear. This modeling suggests very high magnification of the source (up to 50 for the total magnification) and predicts flux ratios between the lensed images significantly different from what is actually observed. This suggests that the lensed images may be affected by a combination of micro or milli-lensing and dust extinction effects.
Key Words.:
gravitational lens – quasar – cosmology1 Introduction
The peculiar and complex morphology of the source 1RXS J113155.4123155 (hereafter J1131GL) has been serendipitously unveiled during polarimetric imaging of a sample of radio quasars carried out in May 2002 at ESO, La Silla. These observations are reported in Section 2 together with additional optical imaging obtained in December 2002. Astrometry and photometry of the gravitational lens system are also described. In Section 3, we present spectroscopic observations of the source, the lens and a nearby companion (hereafter J1131b). Section 4 is devoted to a simple lens model and Section 5 summarizes why this new gravitational lens is a particularly interesting one. We have adopted throughout the paper 65 km s-1 Mpc-1, 0.3 and 0.7.
2 Direct imaging, astrometry and photometry
Direct imaging of J1131GL has been obtained at two different epochs with respectively EFOSC-2 at the 3.6 m telescope and EMMI-Red at the 3.5 m New Technology Telescope (NTT) at the La Silla observatory. On May 2, 2002, we resolved the four components of J1131GL on a set of 24 polarimetric images (corresponding to 4 different orientations of the Half Wave Plate and 2150 s integration time per orientation) taken through a combined V-band + Wollaston prism. The average seeing measured on the frames is 1.1″ and the pixel size is 0.158″. Additional V and R images of J1131GL have also been obtained under poor seeing conditions (1.6″) on December 18, 2002. The coadded exposure time amounts to 480 s in V and 960 s in R. The pixel size is 0.166″.
| ID | V (02/05/2002) | V (18/12/2002) | R (18/12/2002) | ||||||
|---|---|---|---|---|---|---|---|---|---|
| GEN | MCS | GEN | MCS | MCS | model | ||||
| A | |||||||||
| B | |||||||||
| C | |||||||||
| D | |||||||||
| G | - | - | - | - | - | ||||
2.1 Image analysis
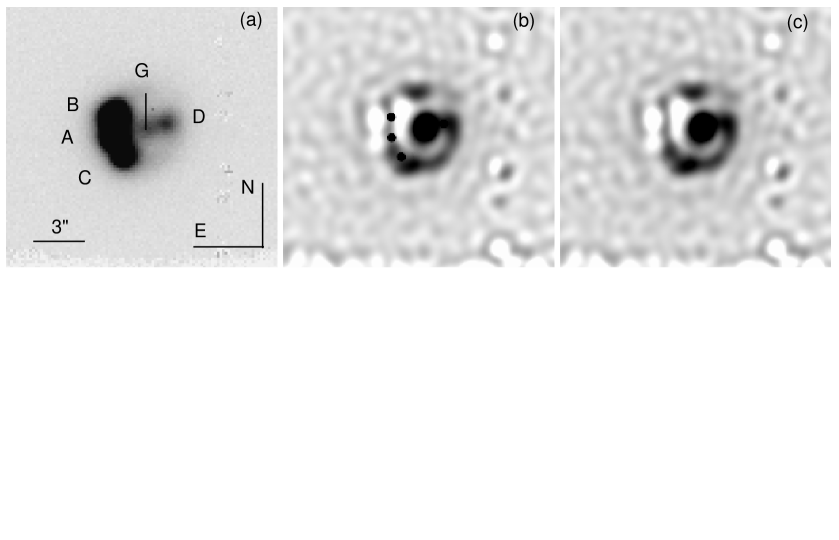
By means of the GENERAL image decomposition program developed by Remy et al. (remy (1997)), we have fitted the EFOSC images of J1131GL (see Fig. 1a) using 4 free adjustable PSF components, altogether with a galactic light profile for the lens. Due to significant distortions of the PSF across the field, we have finally obtained the best results using a purely analytical 2D Moffat PSF.
Fitting a (non seeing-convolved) de Vaucouleurs or exponential disk profile allows to roughly remove the low frequency signal of the lensing galaxy and to unveil a ring-like structure at a level higher than 3 above the noise. This feature is spectacularly confirmed by the deconvolution of the images using the MCS code (Magain et al. magain (1998)): a non uniform ring passing through the 4 point-like components is seen on the deconvolved images (Figs. 1b,c). Additionally, we measured that the integrated signal from the gravitational lens system (A-D and G) was not significantly polarized (i.e. total polarization 0.20.08%). GENERAL and MCS have also been applied to the EMMI frames but despite of a more stable PSF across the field, the poorer seeing prevented us to reach better results than with EFOSC-2.
2.2 Relative astrometry and photometry
Astrometry of the lensed components (B-D) and of the lensing galaxy (G) relatively to A has been derived using the GENERAL and MCS codes. With the MCS algorithm, the position of the lens G has been measured by deconvolving a point-like source at the lens position. The results listed in Table 1 were derived for the best seeing EFOSC frame. They are in statistical agreement with the positions retrieved for the second epoch. The image deconvolved by the MCS code is a sum of analytical point sources and of a diffuse numerical deconvolved background. Due to this, the ring and the lensing galaxy are better taken into account with the MCS code rather than with GENERAL. Consequently, the resulting photometry of the point-like components obtained with MCS is more reliable. The results obtained for the two epochs are reported in Table 1. The 1 errors listed in Table 1 are formal errors on the fit for the results derived with GENERAL. In the case of the MCS code, they reflect the dispersion of the results when changing the initial conditions and deconvolution parameters (i.e. smoothing, position, flux and background step in the fit). Systematic errors on the photometry and on the astrometry are probably not negligible for D and G due to their small separation and their equally low S/N.
2.3 Absolute photometry and variability
The two polarimetric standards HD 155197 and HD 298383 have been observed with the same setting (i.e. V band + Wollaston) during the photometric night on May 2, 2002. These stars allowed us to calculate a zeropoint of 25.850.03 mag. Consequently, the integrated V magnitude of the system is estimated to be 16.63 and 17.970.09 (deducted with MCS). The brightest parts of the ring have a surface brightness 23.9 mag arcsec-2. The estimated mean surface brightness of the galaxy inside a 4″ radius is 22.7 mag arcsec-2 and its integrated magnitude inside the same radius is V=18.4. Since the conditions were not photometric during the December observations, we performed differential photometry of the integrated system J1131GL with respect to various objects in the field. Due to the polarimetric nature of the EFOSC frames (i.e. the field is splitted in non contiguous bands), only 4 objects could be used for this purpose; and it was necessary to also use the 10 s acquisition frame. We found that the integrated flux of the system (A-D and G) was brighter by 0.290.04 mag in December 2002. Since the relative photometry between the 4 components is quite similar at both epochs (see Table 1), intrinsic variability is very likely responsible for this difference.
3 Low resolution spectroscopy with EMMI
Two sets of low resolution spectra (2″ slit) have been obtained using the new CCD on the EMMI-Red arm at the NTT: (1) at the end of May 2002, we obtained a 900 s unresolved spectrum (PA 15∘, from North to East) of the three bright components A, B, C with the CCD in the 11 bin mode and (2) on January 25, 2003, we obtained 2900 s spectra with the CCD in the 22 bin mode (corresponding to 3.58 pixel-1) and the slit passing through A, D, G and J1131b, located at 25″ East of J1131GL. Standard bias subtraction, flatfielding and spectrum extraction procedures were used. Wavelength calibrations of the spectra were done with an He-Ar lamp. Due to the absence of a spectrophotometric standard in January 2003, we used the spectrophotometric standards LTT 1788 and LTT 2415 observed with a 5″ slit in December 2002 to correct these data.

The integrated spectrum of A, B, C obtained in May 2002 (Fig. 2a) shows a continuum and emission lines typical of a redshifted quasar. We could separate these three components using the deconvolution algorithm based on a Maximum Entropy Method developed by Khmil and Surdej (khmil (2002)). The separated spectra of A, B, C obtained by this algorithm were found to be very similar with slight possible changes in the continuum slope but they also remained highly correlated due to the poor seeing of 1.7″. The second set of spectra obtained in January 2003 under an average seeing of 0.66″ have completed our knowledge of this system. Due to the spatial sampling of 0.332″pixel-1, the spectra of A, G and D slightly overlapped. Nevertheless a careful choice of the apertures enabled us to extract the spectrum of A on both frames and the spectra of G and D on the second one. An average spectrum of A is shown in Fig. 2b. We identify on this spectrum typical emission lines of a quasar at a redshift z=0.6580.001. This redshift was determined by fitting a Gaussian on the MgII 2798 Å and [OIII] 4959, 5007 Å emission lines. Unfortunately, the 2″ slit slightly scatters the light from B and C (located less than 1.2″ away from A) and consequently the spectrum of A is contaminated on each exposure by these two components.
Because of the overlapping and of the similar brightness of G and D their spectra are mutually contaminated. We thus subtracted one spectrum from the other after adequate scaling in order to visually minimize the contamination (i.e. to remove quasar emission lines from G and the 4000 Å break from A). This handicraft process suggests a relative reciprocal contamination smaller than 10%. The resulting spectra are shown in Figs. 2b-c. Component D shows similar emission lines as A, but has a flatter slope, not generated by decontamination. The spectrum of G is typical of an elliptical galaxy (Kennicutt kenni (1992)) showing absorption lines redshifted at 0.2950.002 (e.g. CaII K&H 3933, 3968 Å, G band 4304 Å, etc).
The spectrum of J1131b shows Balmer absorption lines and a continuum typical of an A type star contaminated by a background galaxy lying at 2″ from this object. This star was previously identified by Bauer et al. (bauer (2000)) as the most likely source of the X-ray (ROSAT) and radio (NVSS) emission present in this field. They also reported a redshift z=0.654 for this object. We firmly reject their identification, mistakenly matched with the quasar we have observed here.
4 A simple lens model
The relative positions of the quasar images and of the lensing galaxy with respect to image A (see Table 1) have been fitted using two simple lens models: the Singular Isothermal Ellipsoid (SIE, Kormann et al. kormann (1994), Kassiola & Kovner kassiola (1993)) and the Singular Isothermal Sphere plus an external shear (SIS). The best fit is obtained with the SIS model and yields the following results: the angular Einstein radius 1.8190.006″, the shear 0.1230.003 and the shear position angle 14.840.11∘ (from North to East). The uncertainties on the parameters come from the fit of the model on 1000 Monte-Carlo synthetic observations compatible with the observed errors. The direction orthogonal to the shear axis does not point towards any bright object close to the lens. The reduced (for 3 degrees of freedom) is significantly smaller for the SIS ( 19) than for the SIE lens model ( 203) because the latter cannot reproduce correctly the observed lens position. If one does not fit the lens galaxy position, the reduced is comparable for the SIE and the SIS but the SIE model predicts a lens position 0.4″ away from the observed one. Finally, using the formulae of Witt et al. (witt (2000)) for singular isothermal lens models with shear, we predict the time delays between B and the other multiple images: 0.01 d, 0.87 d and 96 d. The leading image is B and the time delay sequence is thus BCAD.
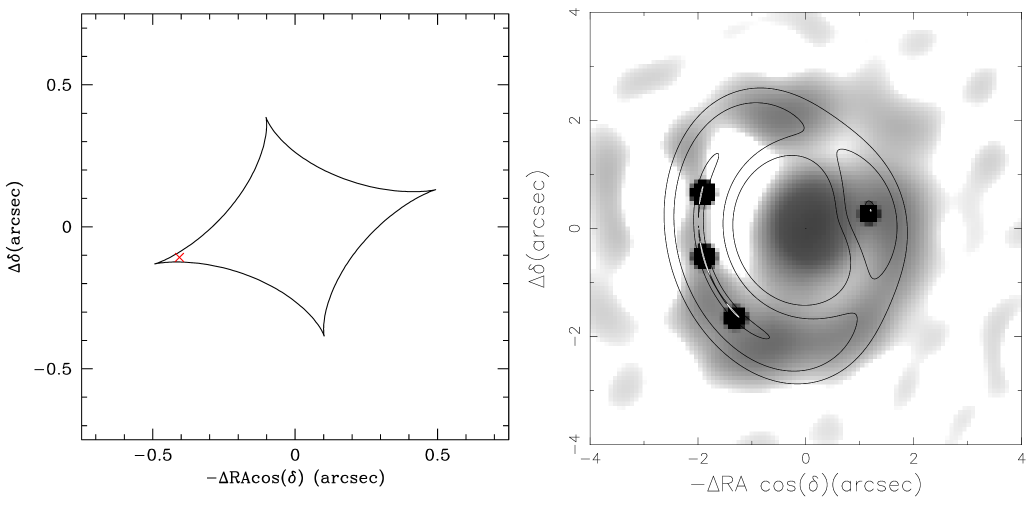
As can be seen from Fig. 3, this system is a long axis quad with a source located very close to a cusp (at about 0.1″). This allows very high magnification of the host galaxy at a few hundreds of pc from the center. The latter is the likely origin of the optical ring-like structure joining the lensed point-like images. The two minima images of the arrival time surface, B and C (with positive parity), should have about half the flux of the central one (the saddle point A), as demonstrated by Mao (mao (1992)) and by Schneider and Weiss (schneider (1992)). The observed B/A magnification ratio (see Table 1) does not follow this generic prediction: B is even the brightest image. Since the C/A ratio is “normal”, and since the time delays are very short between A, B, C, we suspect B to be affected by micro/milli-lensing (D could also be). Even if the V-band and R-band flux ratios are quite similar (see Table 1), we cannot exclude that dust extinction also plays a role in the observed flux ratios. The unlensed absolute magnitude of the source is 22.7 if we conservatively take 10 and 0.2. Thus, the source is, strictly speaking, an AGN/Seyfert 1.
5 Discussion and conclusions
Direct imaging and long slit spectroscopy of 1RXS J113155.4123155 presented in this letter have enabled us to show that this object is a quadruply imaged quasar (; 1.2″) at redshift 0.6580.001 lensed by an elliptical galaxy at 0.2950.002. The MCS method has made possible to enhance the signature of an Einstein ring candidate barely seen on the direct images. The simple modeling by an SIS shows that the source is located very close to a cusp allowing the host galaxy to cross the caustic and to generate the ring seen on the deconvolved images. As it is observed in many quads, there is a discrepancy between the observed image flux ratios (especially between the saddle point A and the minimum B images) and the ones predicted by modeling. This may reflect the necessity to use a lens model involving a small percentage of substructures (Schechter and Wambsganss schechter (2002), references therein). More data on J1131GL are necessary before drawing any definite interpretation of the observed discrepancy. Nevertheless, the explanation of the flux ratios in this system should probably involve micro/milli-lensing and/or dust extinction. Only individual spectra obtained simultaneously from UV to NIR (and taken at time intervals equal to the time-delays) for each component will enable one to disentangle between these effects. Finally, we have shown that the integrated flux has varied by 0.3 mag between May and December 2002.
The source J1131b located at 25″ East of J1131GL was wrongly identified by Bauer et al. (bauer (2000)) as the most likely optical counterpart of the X-ray (Voges et al. voges (1999)) and radio (Condon et al. condon (1998)) emission present in this region. Our identification of this object as a hot star suggests that J1131GL (already cataloged with the RXS notation) is the true source of the X-ray and radio emission. Note that the discovery of a gravitationally lensed system in a multi-wavelength survey is not surprising due to the large expected multi-band magnification bias (Borgeest et al. borgeest (1991), Wyithe et al. wyithe (2003)).
This first set of data suggests the necessity of good spatial resolution and high signal to noise ratio multi-wavelength imaging (from radio to X-ray) in order to use the rare characteristics of this system as many observational constraints for an accurate modeling. In this framework, the shape of the Einstein ring is an invaluable asset to determine independently the shape of the lens potential and of the unlensed source (Kochanek et al. kochanek (2001)). Moreover, a precise lens inversion of the lens equation (e.g. Warren and Dye warren (2003)) should enable one to draw a unique multi-wavelength picture of the source and to retrieve information on the source at angular scales inaccessible with present day and even future instrumentation.
This bright system brings together rare properties (i.e. quad, bright optical Einstein ring, small redshift, high amplification), nearly unique among the known gravitational lens systems. These features make 1RXS J113155.4123155 a very promising astrophysical laboratory for future investigations, including the possibility for an independent determination of the Hubble parameter based on time delay measurements.
Acknowledgements.
Our research was supported in part by PRODEX (Gravitational lens studies with HST), by contract IUAP P5/36 “Pôle d’Attraction Interuniversitaire” (OSTC, Belgium) and by the “Fonds National de la Recherche Scientifique” (Belgium). F.C. is supported by the European commission through Marie Curie Fellowship MCFI-2001-0242. The collaborative grant EROS/CONICYT C00405 between Chile and France is also acknowledged. The referee, D.Rusin, is warmly acknowledged for his constructive remarks on the first draft of this letter. We finally want to thank Y. Nazé for her help with the use of the WIP software.References
- (1) Bauer F.E., Condon J.J., T.X. Thuan, Broderick J.J., 2000, ApJS 129, 547
- (2) Borgeest, U., von Linde, J., Refsdal S. 1991, A&A, 251, L35
- (3) Condon, J. J., Cotton W.D., Greisen E.W. et al. 1998, AJ, 115, 1693
- (4) Kassiola, A., Kovner, I. 1993, ApJ, 417, 450
- (5) Kennicut, Jr R.C. 1992, ApJS, 79, 255
- (6) Khmil, S.V., Surdej, J. 2002, A&A, 387, 347
- (7) Kochanek, C.S., Keeton C.R., Mc Leod B.A., 2001 ApJ, 547, 50
- (8) Kormann, R., Schneider, P., Bartelmann, M. 1994, A&A, 284, 285
- (9) Magain, P., Courbin, F., Sohy, S. 1998, ApJ, 494, 472 (MCS)
- (10) Mao, S. 1992, ApJ, 389, 63
- (11) Remy, M., Surdej J., Bagget S., Wiggs, M. 1997 HST Calibration Workshop with a New Generation of Instruments, S. Casarteno et al. eds., 374 (GENERAL)
- (12) Schechter, P., Wambsganss, J. 2002, ApJ, 580, 685
- (13) Shectman, S.A, Landy S.D., Oemler A. et al. 1996, ApJ, 470, 172
- (14) Schneider, P., Weiss, A. 1992, A&A, 260, 1
- (15) Voges, W., Aschenbach B., Boller, Th. et al. 1999, A&A., 349, 389
- (16) Warren, S., Dye S. 2003, to appear in ApJ, astro-ph/0302587
- (17) Witt, H., Mao, S., Keeton, C.R. 2000, ApJ, 544, 98
- (18) Wyithe, J.S.B, Winn, J.N., Rusin, D. 2003, ApJ, 583, 58