The Origin of Cosmic Dust.
Loretta Dunne∗, Stephen Eales∗, Rob Ivison†, Haley Morgan∗,
Mike Edmunds∗
∗Department of Physics & Astronomy, Cardiff University, 5 The Parade, Cardiff CF24 3YB, UK
†Astronomy Technology Centre, Royal Observatory,
Blackford Hill, Edinburgh EH9 3HJ, UK
Large amounts of dust () have recently been discovered in high redshifts quasars1,2 and galaxies3-5, corresponding to a time when the Universe was less than one-tenth of its present age. The stellar winds produced by stars in the late stages of their evolution (on the asymptotic giant branch of the Hertzsprung-Russell diagram) are though to be the main source of dust in galaxies, but they cannot produce that dust on a short-enough timescale6 ( Gyr) to explain the results in the high-redshift galaxies. Supernova explosions of massive stars (type II) are also a potential source, with models predicting 0.2–4 of dust7-10. As massive stars evolve rapidly, on timescales of a few Myr, these supernovae could be responsible for the high-redshift dust. Observations11-13 of supernova remnants in the Milky Way, however, have hitherto revealed only of dust each, which is insufficient to explain the high-redshift data. Here we report the detection of of cold dust in the youngest known Galactic remnant, Cassiopeia A. This observation implies that supernovae are at least as important as stellar winds in producing dust in our Galaxy and would have been the dominant source of dust at high redshifts.
Over the past three decades, many searches for dust in supernova remnants (SNR) have been made in the mid and far-infrared (6–100m). Remnants must be studied when they are young, before they have swept up large masses of interstellar material which makes it difficult to distinguish dust formed in the ejecta from that present in the ISM prior to the explosion. The handful of Galactic remnants which are both young and close enough (Cas A, Kepler and Tycho) have been studied with the Infrared Astronomical Satellite (IRAS) and the Infrared Space Observatory (ISO), but although dust at 100–200 K has been detected, the dust mass deduced is only , many orders of magnitude lower than the solar mass quantities predicted.11-13 The formation of dust in the recent supernova 1987A has been implied indirectly from the fading of the silicate line and increase in 10m emission,14 although the quantity is heavily dependant on the assumptions made about the clumpiness of the dust***If the dust is uniform, the observations imply a very low efficiency of condensation of heavy elements into dust grains (%), while if dust is very clumped this could rise to almost 100% in some species. The IRAS/ISO observations were not sensitive to cold dust at K, if the models are correct about the amount of dust produced in supernovae (SNe) then the bulk of the dust must be cold. Such dust will emit most of its radiation at longer wavelengths and so the best place to search for cold dust emission is at sub-millimetre (submm) wavelengths (0.3–1 mm). Here, we present our analysis of submm data for Cassiopeia A, the youngest known Galactic remnant. Cas A is the brightest radio source in the sky, and still produces significant synchrotron emission at submm wavelengths. Cas A is believed to be the remnant of the explosion of a massive (20-30 ) progenitor star, which occurred around 320–340 yrs ago at a distance of 3.4 kpc.15,16
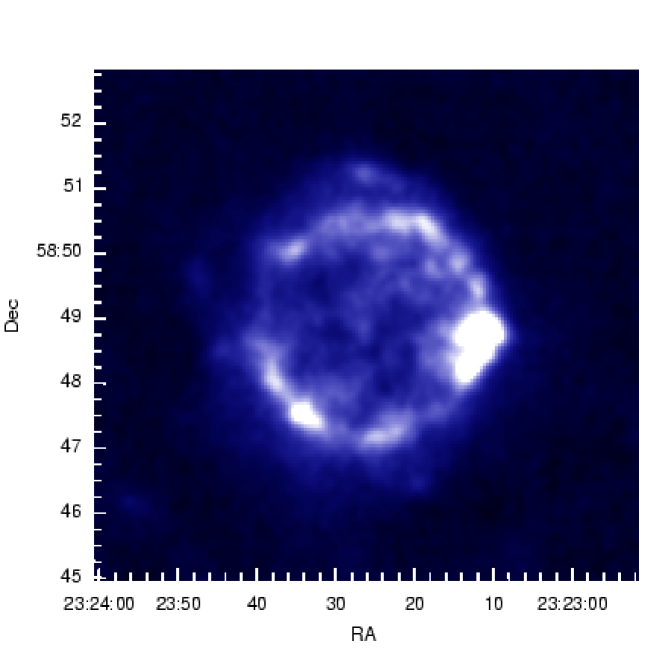
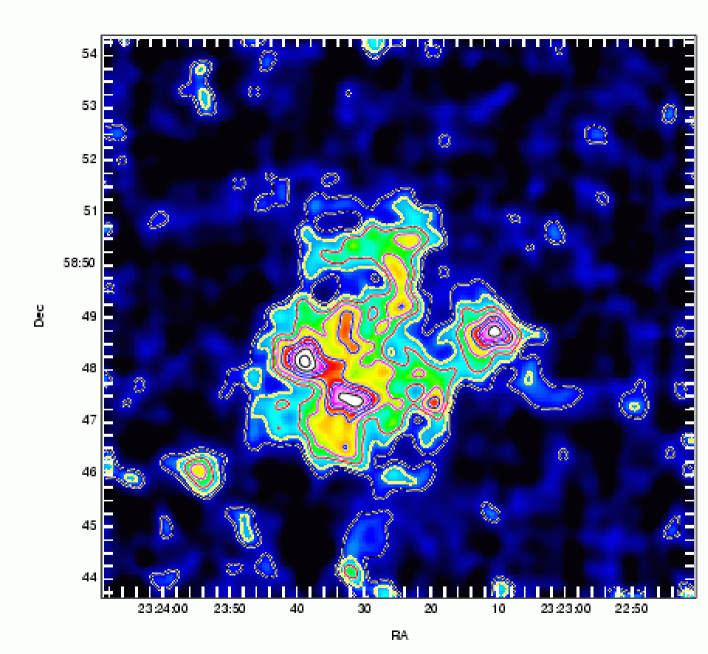
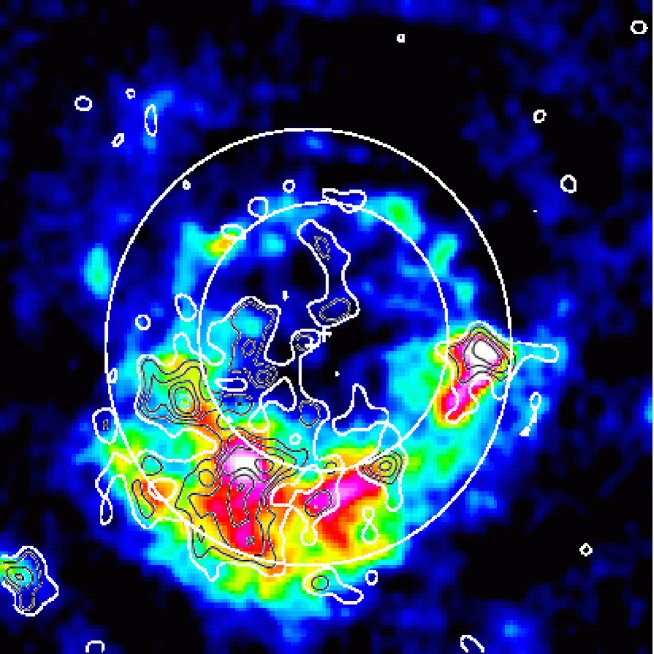
Cas A was observed with the SCUBA17 array on the JCMT in June 1998. The 850m image is presented in Fig. 1 and shows a ring-like morphology, similar to the X-ray and radio images18,19. Over two-thirds of the 850m emission in the main ring is synchrotron produced by relativistic electrons spiralling in the intense magnetic field. Fig. 2 presents the spectral energy distribution (SED) of Cas A from the radio to the mid-IR, showing the clear excess due to dust at wavelengths of m. The synchrotron radiation displays a constant power-law behaviour over more than two decades in frequency with where , meaning that its contribution to the submm flux can be easily estimated and subtracted. The 450m image is shown in Fig. 3, the synchrotron contribution is now only one third and emission from cold dust dominates which is why the 450 and 850m images appear different. We can remove the synchrotron contribution from the submm maps by scaling an 83 GHz image,19 which is the closest in frequency and resolution to our images. Fig. 4 shows the result with contours denoting the 450m synchrotron subtracted flux. The general similarity between the two wavelengths, once the synchrotron has been removed, is strong evidence that this is indeed emission from cold dust.
The rings on Fig. 4 indicate the position of the forward and reverse shocks as determined from Chandra X-ray data.18 Most of the dust appears to be contained between the two, where the gas density as traced by the X-rays is greatest. We fitted a two-temperature grey body SED to the synchrotron corrected IR/submm fluxes (Fig. 2) determining temperatures of 112 K and 18 K for the two components. The SED parameters and their uncertainties are given in Table 1. The temperature of the hot dust is easily explained if it is co-extensive with the X-ray emitting gas ( K) and is heated by collisions with fast moving electrons and ions13. The cold dust could be explained in a number of ways and a more detailed investigation will be presented elsewhere (Dunne et al. in prep). If the grains are very small () they may cool to 15–20 K in the time between collisions with the gas particles. However, the dust SED might then be expected to show dust at all temperatures between 100-20 K, which is not apparent. Alternatively, the cold dust may be located in a very hot but diffuse phase of the gas, surrounding the bright, dense X-ray filaments. If the gas had a density of then the grains could be this cold. The dust could also be contained in dense clumps which are in not in pressure equilibrium with the more diffuse X-ray gas, a model which has been suggested for SN 1987A14. Finally, the cold dust could be in thermal equilibrium with the same X-ray gas which is responsible for heating the hot dust, if the cold grains are both very large (1-10m) and emit more efficiently than grains in the diffuse ISM. Evidence for unusual grain properties in Cas A is presented below.
The mass of dust can be estimated from the submm emission using , where D is the distance to the remnant (3.4 kpc), is the Planck function at temperature T and is the dust mass absorption coefficient. The submm emission is clearly dominated by the cold dust, therefore the cold temperature is the only one we need be concerned with. The value of is the main uncertainty as its value is not well determined and may vary with physical environment. Dust masses derived from the SED and different values of are in Table 1. Using ‘standard’ values appropriate to the diffuse ISM20 () gives dust masses which are uncomfortably high (). Higher values, as measured in environments where dust may be newly formed, amorphous or coagulated (see Table 1) produce more sensible estimates (2 – 6 ), thus the dust in Cas A appears to have different properties to that in the diffuse ISM. It is possible that grain processing in the diffuse ISM by UV photons and passage through dark clouds may alter the surface chemistry or shape of grains, causing a change in their emissivity. At an age of 320 yrs, the dust in Cas A is relatively pristine and has not yet been subjected to the above events, this may contribute to its greater emissivity.
Was the dust produced in the supernova explosion, or could it be pre-existing dust which was swept up by the blast wave? If the remnant has swept up ISM material with a uniform density19 of 0.4–4 H atoms per then only of dust should be present†††for an ISM gas-to-dust ratio of 160. Higher ISM densities are possible, but in order for the mass of dust inferred in Cas A to have been swept up densities of the order 200–400 are required. This would mean Cas A has swept up of material which is inconsistent with its dynamical state18,21, believed to be just entering the Sedov stage (i.e. it has swept up about as much mass as it ejected ()). Another hypothesis for the bright ring seen in the X-ray and radio is that it is the interaction of the supernova with a stellar wind shell swept up by the Wolf-Rayet precursor16,22. In this case, one could estimate that somewhere between 4–16 of material could have been lost in the red-supergiant phase and swept up into the ring. For this to be the source of the dust we observe requires an implausibly large quantity of freshly synthesised elements efficiently condensing into dust in the stellar wind material6 (which, unlike the supernova ejecta, is mainly H and He). We conclude that the most likely explanation for the large mass of dust in Cas A is that it was formed as a result of the supernova explosion.
Using our result, we estimate the current Galactic dust production rate from Type-II SNe as . Stellar wind6 sources produce , meaning that SNe are the dominant source of interstellar dust during most of galactic evolution. We have shown here that individual SNe are capable of producing of order of a solar mass of dust in the short times available in the early universe and therefore the dust observed at high redshift is likely to have originated in supernovae.
Bibliography
-
[1]
Bertoldi, F. et al. Dust emission from the most
distant quasars. Astron. Astrophys. Lett. in the press; also
available as preprint astro-ph/0305116 at http://www.arXiv.org (2003).
-
[2]
Archibald, E. N. et al. A submillimetre survey of the
star formation history of radio galaxies. Mon. Not. R. Astron. Soc. 323, 417-444 (2001).
-
[3]
Hughes, D. H. et al. High-redshift star formation in
the Hubble Deep Field revealed by a submillimetre-wavelength
survey. Nature. 394, 241-247 (1998).
-
[4]
Smail, I., Ivison, R. J. & Blain, A. W. A Deep
Sub-millimeter Survey of Lensing Clusters: A New Window on Galaxy
Formation and Evolution. Astrophys. J. 490, L5-L8
(1997).
-
[5]
Dunne, L., Eales, S. A. & Edmunds, M. G. A census of
metals at high and low redshifts and the connection between
submillimetre sources and spheroid formation. Mon. Not. R. Astron. Soc. 341 589-598 (2003).
-
[6]
Morgan, H. L. & Edmunds M. G. Dust Formation in Early
Galaxies. Mon. Not. R. Astron. Soc. in the press; also available
as preprint astro-ph/0302566 at http://www.arXiv.org (2003).
-
[7]
Todini, P. & Ferrara, A. Dust Formation in primordial Type
II supernovae. Mon. Not. R. Astron. Soc. 325, 726-736
(2001).
-
[8]
Clayton, D. D., Liu, W. & Dalgarno, A. Condensation of
Carbon in Radioactive Supernova Gas. Science
283, 1290-1292 (1999).
-
[9]
Kozasa, T., Hasegawa, H. & Nomoto, K. Formation of dust
grains in the ejecta of SN 1987A. II Astron. Astrophys. 249, 474-482 (1991).
-
[10]
Woosley, S. E. & Weaver, T. A. The Evolution and Explosion
of Massive Stars. II. Explosive Hydrodynamics and
Nucleosynthesis. Astophys. J. Sup. Ser. 101, 101-181 (1995).
-
[11]
Lagage, P. O. et al. Dust Formation in the Cassiopeia
A supernova. Astron. Astrophys. 315, L273-L276 (1996).
-
[12]
Douvion, T, Lagage, P. O., Cesaesky, C. J., Dwek, E. Dust
in the Tycho, Kepler and Crab supernova remnants. Astron. Astrophys. 373, 281-291 (2001).
-
[13]
Dwek, E., Dinerstein, H. L., Gillet, F. C., Hauser, M. G.,
Rice, W. L. Physical processes and infrared emission from the
Cassiopeia A supernova remnant. Astrophys. J. 315, 571-579
(1987).
-
[14]
Lucy, L. B., Danziger, I. J., Gouiffes, C., Bouchet,
P. Dust Condensation in the ejecta of SN 1987A, II. in Supernovae. The Tenth Santa Cruz Workshop in Astronomy and
Astrophysics (ed. Woosley, S. E.) p.82 (New York, Springer-Verlag,
1991).
-
[15]
Reed, J. E., Hester, J. J., Fabian, A. C., Winkler,
P. F. The three-dimensional structure of the Cassiopeia A supernova
remnant. I. The spherical shell. Astrophys. J. 440, 706-721
(1995).
-
[16]
García-Segura, G., Langer, N. & MacLow, M.-M. The
hydrodynamic evolution of circumstellar gas around massive stars. Astron. Astrophys. 316, 133-146 (1996).
-
[17]
Holland, W. S.et al. SCUBA: a common-user
submillimetre camera operating on the James Clerk Maxwell
Telescope. Mon. Not. R. Astron. Soc. 303, 659-672 (1999).
-
[18]
Gotthelf, E. V. et al. CHANDRA detection of the
forward and reverse shocks in Cassiopeia A. Astrophys. J. 552, L39-L43 (2001).
-
[19]
Wright, M., Dickel, J., Koralesky, B., Rudnick, L. The
supernova remnant Cassiopeia A at millimetre wavelengths. Astrophys. J. 518, 284-297 (1999).
-
[20]
Li, A. & Draine, B. T. Infrared Emission from Interstellar
Dust. II. The Diffuse Interstellar Medium. Astrophys. J. 554 778-802 (2001).
-
[21]
Agüeros, M. A., Green, D. A. The bulk expansion of the
supernova remnant Cassiopeia A at 151 MHz. Mon. Not. R. Astron. Soc. 305 957-965 (1999).
-
[22]
Borkowski, K. J., Szmkowiak, A. E., Blondin, J. M.,
Sarazin, C. L. A circumstellar shell model for the Cassiopeia A
supernova remnant. Astrophys. J. 466 866-870 (1996).
-
[23]
Reichart, D. E. & Stephens, A. W. The Fading of Supernova
Remnant Cassiopeia A from 38 MHZ to 16.5 GHZ from 1949 to 1999 with
New Observations at 1405 MHZ. Atrophys. J. 537, 904-908
(2000).
-
[24]
Baars, J. W. M., Genzel, R., Pauliny-Toth, I. I. K.,
Witzel, A. The absolute spectrum of CAS A - an accurate flux density
scale and a set of secondary calibrators. Astron. & Astrophys.
61, 99-106 (1977).
-
[25]
O’Sullivan, C. & Green, D. A. Constraints on the secular
decrease in the flux density of CAS A at 13.5, 15.5 and 16.5 GHz. Mon. Not. R. Astron. Soc. 303, 575-578 (1999).
-
[26]
Mason, B. S. et al. An Absolute Flux Density
Measurement of the Supernova Remnant Cassiopeia A at 32 GHZ. Astron. J. 118, 2908-2918 (1999).
-
[27]
Liszt, H. & Lucas, R. 86 and 140 GHz radiocontinuum maps of
the Cassiopeia A SNR. Astron. Astrophys. 347, 258-265
(1999).
-
[28]
Mezger, P. G., Tuffs, R. J., Chini, R., Kreysa, E.,
Gemuend, H.-P. Maps of Cassiopeia A and the Crab Nebula at lambda 1.2
MM. Astron. Astrophys. 167, 145-150 (1986).
-
[29]
Saken, J. M., Fesen, R. A. & Shull, J. M. An IRAS survey
of Galactic supernova remnants. Astrophys. J. Supp. Ser. 81, 715-745 (1992).
-
[30]
Tuffs, R. J. et al. The heating and origin of grains
in Cassiopeia A and SN 1987A. in The Universe as Seen by ISO
(eds. Cox, P. & Kessler, M. F.) p. 241-254 (ESA-SP 427, ESA
Publications Division, ESTEC, Noordwijk, 1999).
Aknowledgments
We wish to thank Melvyn Wright for kindly providing us with the 83 GHz image, and Walter Gear and Dave Green for useful discussions. LD is supported by a PPARC postdoctoral fellowship and HM by a Cardiff University studentship. We are grateful to Gary Davis for use of Director’s time on the JCMT to obtain the new photometry data.
The authors declare that they have no competing financial interests.
Correspondence and requests for materials should be addressed to
Loretta Dunne
(L.Dunne@astro.cf.ac.uk).
| SED parameters | Dust masses () | ||||
|---|---|---|---|---|---|
| (K) | (K) | ||||