A Hubble Space Telescope Survey of Extended [OIII]5007Å Emission in a Far-Infrared Selected Sample of Seyfert Galaxies: Results11affiliation: Based on observations made with the NASA/ESA Hubble Space Telescope, which is operated by the Association of Universities for Research in Astronomy, Inc., under NASA contract NAS5-26555.
Abstract
We present the results of a Hubble Space Telescope (HST) survey of extended [OIII] emission in a sample of 60 nearby Seyfert galaxies (22 Seyfert 1’s and 38 Seyfert 2’s), selected by mostly isotropic properties. The comparison between the semi major axis size of their [OIII] emitting regions (RMaj) shows that Seyfert 1’s and Seyfert 2’s have similar distributions, which seems to contradict Unified Model predictions. We discuss possible ways to explain this result, which could be due either to observational limitations or the models used for the comparison with our data. We show that Seyfert 1 Narrow Line Regions (NLR’s) are more circular and concentrated than Seyfert 2’s, which can be attributed to foreshortening in the former. We find a good correlation between the NLR size and luminosity, following the relation RL([OIII])0.33±0.04, which is flatter than a previous one found for QSO’s and Seyfert 2’s. We discuss possible reasons for the different results, and their implications to photoionization models. We confirm previous results which show that the [OIII] and radio emission are well aligned, and also find no correlation between the orientation of the extended [OIII] emission and the host galaxy major axis. This agrees with results showing that the torus axis and radio jet are not aligned with the host galaxy rotation axis, indicating that the orientation of the gas in the torus, and not the spin of the black hole, determine the orientation of the accretion disk, and consequently the orientation of the radio jet.
1 Introduction
Ground-based narrow-band imaging of Seyfert galaxies (Pogge 1988a,b,1989; Haniff, Wilson & Ward 1988) revealed extended emission in several of these objects. The fact that several Seyfert 2 galaxies presented conically shaped Narrow Line Regions (NLR’s) - e.g. NGC 1068 and NGC 4388 - indicate that the source of radiation ionizing the gas is collimated, a result which gave strong support to the Unified Model. This model proposes that Seyfert 1 and Seyfert 2 galaxies are the same kind of object, a central black hole surrounded by a torus of molecular gas and dust (Antonucci 1993, Urry & Padovani 1995). The identification of the AGN type depends on whether the nucleus is observed through the torus pole, in which case the Broad Line Region (BLR) is detected and the galaxy is classified as a Seyfert 1, or through the torus equator, in which case the BLR is hidden from direct view, only the NLR is detected, and the galaxy is classified as a Seyfert 2.
Many tests over the past 20 years have led to wide acceptance of the Unified Model as explaining some of the differences between AGN types. The most direct evidence in favor of the model is the detection of polarized broad emission lines in the spectrum of Seyfert 2 galaxies (Antonucci & Miller 1985, Miller & Goodrich 1990; Kay 1994; Tran 1995), which indicates that the BLR is hidden from direct view and we see it scattered in our direction. Another important line of evidence is the detection of high column densities of gas absorbing the nuclear X-ray spectrum of Seyfert 2’s (Turner et al. 1997).
Two more lines of evidence in favor of the model are the deficit of ionizing photons in the spectrum of Seyfert 2’s (Wilson, Ward & Haniff 1988; Storchi-Bergmann, Mulchaey & Wilson 1992; Schmitt, Storchi-Bergmann & Baldwin 1994) and the collimation of the ionizing radiation by the torus walls, discussed above. Following the papers of Pogge (1988a,b) and Haniff et al. (1988), several other Seyfert galaxies were found to have conically shaped NLR’s (Tadhunter & Tsvetanov 1989; Storchi-Bergmann, Wilson & Baldwin 1992; Schmitt et al. 1994; among others).
The most complete study of the morphology and sizes of the NLR’s of Seyfert galaxies was done by Mulchaey, Wilson & Tsvetanov (1996a,b). These authors compared ground based [OIII] and H[NII] images of a sample of early type Seyferts, with models for the distribution of NLR gas and inclination of the torus relative to the line of sight, in an attempt to determine the intrinsic gas distribution in these sources. They found no significant difference in the sizes and morphologies of the NLR’s of Seyfert 1’s and Seyfert 2’s. They also found a large number of Seyfert 2’s with halo-like NLR’s, which could not be explained by their models. However, they point out that several of the halo-like Seyfert 2 galaxies presented V-shaped structures in ionization maps (obtained dividing the [OIII] by the H images). They claim that the halo morphology was most likely due to the low spatial resolution (2″) of their images, which probably was not good enough to resolve the most compact sources. Some Seyfert 2’s are known to have BLR’s hidden by dust in the host galaxy disk (Keel 1980; Lawrence & Elvis 1982; Maiolino & Rieke 1995) which may also result in halo-like NLR’s.
The high resolution achievable with HST is an important tool in the study of the NLR of Seyfert galaxies. Several papers have used HST to image a large number of sources with narrow band filters centered at [OIII]5007Å and H (Wilson et al. 1993; Mulchaey et al. 1994; Bower et al. 1994; Capetti et al. 1996; Schmitt & Kinney 1996; Ferruit et al. 2000; Falcke, Wilson & Wilson 1998; Simpson et al. 1997; Macchetto et al. 1994; Boksenberg et al. 1995; Cooke et al. 2000). These papers found a large number of Seyfert 2 galaxies with extended [OIII] emission, and also showed that the interaction between the radio jet and the ambient gas can be an important factor in shaping the NLR, either by ionizing it through shocks, or by compressing the gas and increasing its emissivity.
Although HST has been used to image dozens of Seyfert 2 galaxies, until recently, only ten or so Seyfert 1’s had images available in the archive, most of which were obtained before the correction of spherical aberration. Using a compilation of all the narrow band images of Seyfert galaxies available by 1995, Schmitt & Kinney (1996) compared the properties of the NLR of Seyfert 1’s and Seyfert 2’s. Their analysis came to an intriguing conclusion, that Seyfert 1 galaxies have much smaller NLR’s than Seyfert 2’s, even when orientation effects were taken into account. However, the significance of their result can be questioned, since their sample was extracted from the HST archive and involved data from different projects. Wilson (1997) and Nagar & Wilson (1999) pointed out that, due the spherical aberration problems during the first years of HST, several of these projects selected their sources based on previous knowledge of extended emission, which certainly biased the results. The fact that all the Seyfert 1’s used by Schmitt & Kinney (1996) had only spherically aberrated observations also influenced their results. These images had to be deconvolved in order to correct for this effect, and faint extended emission around a strong point source could have been easily washed out, making it difficult to detect diffuse extended emission around the nuclei of Seyfert 1 galaxies.
In order to address these problems and perform an unbiased comparison between the properties of the NLR’s of Seyfert 1 and Seyfert 2 galaxies, we were awarded an HST snapshot project during cycle 9, to observe the extended [OIII]5007Å emission of the Seyfert galaxies in the 60m sample (de Grijp et al. 1987; 1992; Kinney et al. 2000). This survey obtained images for 42 Seyfert galaxies, which, combined with archival data for another 18 galaxies observed in a similar way, created a homogeneous database of [OIII] images for a sample of 60 Seyfert galaxies. These galaxies were selected on mostly isotropic properties, 60m luminosity and 25/60m color, which ensures that we are studying Seyfert 1’s and Seyfert 2’s with similar luminosities, as well as other basic properties. Nevertheless, we point out that our sample is not complete, since it does not include Seyfert galaxies with cool infrared emission, and suggest reading Schmitt et al. (2001) for a discussion of possible anisotropy problems in the way the sample was selected. This sample does however mitigate many of the problems faced by previous studies, like selection effects, the small number of Seyfert 1’s with [OIII] images, and the lack of homogeneous observations.
A detailed description of the observations, reductions and measurements being used in this paper is given by Schmitt et al. (2003). In that paper we also compared some properties of the galaxies with observed [OIII] images with those of the entire 60m sample, and show that the observed galaxies are an unbiased subsample, representative of the entire sample, that can be used to draw robust statistics of the properties of the NLR’s of Seyferts. This paper analyzes the results of this survey. In Section 2 we give a brief description of the data and measurements being used. Section 3 presents the comparison between the morphology and sizes of the NLR’s of Seyfert 1’s and Seyfert 2’s, and a comparison with the predictions from Mulchaey et al. (1996b) models. In Section 4 we study the correlation between the size and luminosity of the NLR, while in Section 5 we discuss the correlation between the radio and narrow-line emission. A summary of the results is presented in Section 6.
2 Data and Measurements
The data used in this Paper were obtained with HST. Our sample is composed of 60 Seyfert galaxies (22 Seyfert 1’s and 38 Seyfert 2’s) selected based on their far infrared properties (Kinney et al. 2000). The observations for 58 of the 60 galaxies were obtained with the WFPC2 camera, one Seyfert 2 galaxy was observed with the FOC camera and another one with the WF/PC1 camera. The on-band [OIII] observations for 56 galaxies were done with the Linear Ramp Filter, while the remaining ones were done with regular narrow-band filters. Typical exposure times of these images were between 10 min and 20 min, split into 2 or more exposures to allow easier elimination of cosmic rays. Short continuum observations were also obtained, to allow the subtraction of the host galaxy contribution to the on-band image. These images were obtained with filter F547M, and, in some cases, with the Linear Ramp Filter, having typical integration times between 1 min and 2 min. In most cases the continuum images were not split into multiple exposures, and required some extra work to eliminate cosmic rays.
The reductions were done by the HST pipeline, with the exception of the flat field correction of the images obtained with the Linear Ramp filter. Since there are no flat fields for this filter, we used the one for F502N, which has a similar wavelength and bandwidth. The images were registered, combined, cleaned of cosmic rays and background subtracted. The calibration of the continuum images was done using the information on their headers, while for those obtained with the Linear Ramp Filter we used the WFPC2 Exposure Time Calculator for extended sources, which gives an accuracy of 5%. Finally, continuum-free [OIII] images were created by subtracting continuum images, scaled by the bandwidth of the on-band images, from the on-band images.
The continuum-free [OIII] images were clipped at the value of 3, and the [OIII] fluxes were measured by integrating the flux inside a rectangular region which included all the visible emission (F([OIII])int). A comparison between these values and values obtained from the literature (Schmitt et al. 2003) shows a fairly good agreement, with a scatter of 0.25 dex. We measured the nuclear [OIII] fluxes of these galaxies (F([OIII])nuc), obtained integrating the flux inside a circular aperture with radius of 100 pc, centered at the nucleus. These images were also used to measure the dimensions of the NLR’s, like the effective radius, semi major and semi minor axis of the [OIII] emission (Re, RMaj and RMin), the position angle of the [OIII] major axis and the offset between the nucleus and the centroid of the [OIII] emitting region. We assume H km s-1 Mpc-1 throughout this paper. The results of the statistical tests performed in this paper are summarized in Table 1, where we give the property being compared, the distributions being compared, the KS test probability, and the Figures where the data are presented.
3 Sizes and Morphologies of the NLR’s
The morphologies and sizes of the NLR’s of Seyferts are important diagnostics for the distribution of the gas in the nuclear region of these galaxies. Narrow-band images have also been used, as pointed out above, to show that the nuclear radiation, which ionizes this gas, is collimated or beamed. The idealized picture of the Unified Model suggests that the NLR of Seyfert 1’s, where the torus is seen pole-on, should have a halo like morphology, while Seyfert 2’s, where the torus is seen through the equator, should have conically shaped NLR’s. However, even from low-resolution ground-based observations it was clear that this simple model needed some improvements. One example which clearly shows this is the detection of a conically shaped NLR in the Seyfert 1 galaxy NGC4151 (Perez et al. 1989; Pogge 1989).
A more detailed comparison between the morphology of the [OIII] images of Seyferts with geometrical models for the shape of the NLR was presented by Mulchaey et al. (1996b). These authors modeled the geometry of the NLR assuming a torus with semi opening angle of 35∘, and a central engine ionizing gas distributed in two different geometries, a sphere and a disk. They showed that the simplest expectation, described above, is true only when the NLR has a spherical distribution of gas with properties suitable for producing the narrow emission lines when illuminated. In the case when the gas lies in a disk, possibly the host galaxy disk, both Seyfert types can have conically shaped NLR’s. One of the principal predictions from their models is that the NLR’s of Seyfert 1’s, seen in projection, should on average be smaller than Seyfert 2’s.
3.1 NLR sizes
In Figure 1 we present the cumulative distribution of the logarithm of RMaj. A visual inspection of this Figure indicates that there is no difference in the distribution of values for Seyfert 1’s and Seyfert 2’s. The KS test gives a 90% chance that two samples drawn from the same parent population would differ this much, thus the two distributions are very similar (in fact fortuitously so). Comparing these results with the models from Mulchaey et al. (1996b), we find that the observed distribution seems to agree better with that where the NLR gas is in the host galaxy disk. The fact that several Seyfert 1 galaxies present very extended NLR’s (e.g. MRK 79, MCG+08-11-11) gives support to this interpretation. However, we point out that several Seyfert galaxies, including some in our sample, are known to have outflows, indicating that the gas does not necessarily have to be confined to a disk. Some of these galaxies are NGC 4388 (Corbin et al. 1988; Veilleux et al. 1999), NGC 3516 (Mulchaey et,al. 1992), NGC 3281 (Storchi-Bergmann et al. 1992), NGC 1068 (Crenshaw & Kraemer 2000; Cecil et al. 2002), NGC 4151 (Hutchings et al. 1998; Crenshaw et al. 2000). Furthermore, Antonucci (2002) showed that the [OIII] emission in Seyfert 1 galaxies is blueshifted with respect to the host galaxy stars, while Seyfert 2’s have a symmetric distribution around the systemic velocity, suggesting that outflows may be common.
One problem that is clearly apparent in the comparison of the observed results with the models is the similarity between the distribution of NLR sizes of Seyfert 1’s and Seyfert 2’s. However, this result might be explained by several possible reasons, which we outline here. Since corrections for these effects could be arbitrary and not very easy to performed, we decided to just list them and do not try to do anything with the data.
It is possible that several galaxies, as many as 5 Seyfert 1’s and 1 Seyfert 2 (e.g. MRK 705, NGC 5548, NGC 7213) have unresolved [OIII] emission, even at the resolution of HST. The WFPC2 manual shows that at a wavelength around 5000Å the flux of a point spread function is reduced to 1% of the peak flux at a radius of 0.5″. The inspection of the several [OIII] images of the galaxies described above (Schmitt et al. 2003), shows only a compact nuclear sources. The [OIII] flux of these galaxies falls to approximately 1% of the peak flux at distances of 0.5″ away from the nucleus, which is consistent with the proposed interpretation.
Among the resolved images, as many as 6 Seyfert 2’s and 2 Seyfert 1’s (e.g. NGC 3281, NGC 4388), may have their NLR sizes reduced by shading from the torus or host galaxy disk. That is, in some galaxies we observe only the side of the NLR which is facing us, while the other side is blocked by the host galaxy disk. This can reduce the observed NLR size to approximately half of the intrinsic one.
We tried to estimate how important the effect of hiding part of the conical NLR by the galaxy disk might be in the determination of their sizes, and in particular, if this effect is more important in Seyfert 2’s compared to Seyfert 1’s. In Figure 2 we present the Offsets between the peak of the continuum and the centroid of the [OIII]-emitting region. If the NLR is centered around the nucleus of the galaxy we should obtain Offset, while in the case where one side of the NLR is hidden by the galaxy disk we should obtain larger Offsets, with the maximum value being 1. An inspection of Figure 2 shows that most of the galaxies in our sample have NLR’s which are more or less centered around the nucleus, with Offset values smaller than 0.2. Seyfert 1 galaxies seem to be concentrated towards values smaller than 0.4, while Seyfert 2’s present a tail going up to 1. However, the KS test does not show a statistically significant difference between the distribution of values for Seyfert 1’s and Seyfert 2’s, with a 33% probability that two samples drawn from the same parent population would differ this much. This result indicates that this effect can influence the determination of the sizes of NLR’s, but is not the only factor, or even the most important one, causing both Seyfert types to have similar distributions of RMaj.
Orientation effects may also play an important role in the observed size of the NLR of Seyfert 1’s, by enhancing their surface brightnesses. Since their conical NLR’s are foreshortened by the fact that they are observed end-on, this means that their NLR emission is integrated along a larger path length, resulting in enhanced [OIII] surface brightnesses at all scales. The NLR’s of Seyfert 2 galaxies are observed edge-on, corresponding to smaller path lengths and lower surface brightnesses in regions which are far away from the nucleus. As a result of this effect, it is easier to detect extended emission in Seyfert 1’s, relative to Seyfert 2’s, especially in a surface brightness limited survey like ours.
Other important factors that should be taken into account when comparing the observed distribution to Mulchaey et al. (1996b) models, is the fact that these models do not take into account different source luminosities, or different torus opening angles. We will show in the next section that the size of the NLR increases with the luminosity of the AGN, so this size can vary significantly in a sample with a large range of luminosities like ours. The fact that the torus half opening angle can be different from that used in their models (35∘), can also change the predicted distribution of NLR sizes for Seyfert 1’s and Seyfert 2’s. In reality one should not expect the torus opening angle to be constant in a sample with such a wide range of luminosities, and could in fact depend on the luminosity of the source (Lawrence 1991). Just for illustrative purposes, consider the torus half opening angle of 48∘ that Schmitt et al. (2001) found comparing the relative number of Seyfert 1’s and Seyfert 2’s in the parent population of galaxies used in this paper. Such a torus will generate an ionization cone where the size of the base is 1.5 times the size of the side of the cone. When compared to the base of the cone generated by a torus opening angle used in Mulchaey’s models, we find that the base of the cone of these models is 25% smaller than that of a cone with half opening angle of 48∘. Since the base of the cone indicates how large a conical NLR would be if the torus is observed pole-on, like in Seyfert 1’s, this indicates that these galaxies could have NLR’s with sizes similar to those of Seyfert 2’s. Furthermore, if there is a range of torus opening angles, in a sample like the one used here, which was randomly drawn from a complete sample, the average opening angle of Seyfert 1’s will be larger than that of Seyfert 2’s. This is due to the fact that galaxies with larger torus opening angles are, on average, more likely to be seen as Seyfert 1’s. If all the factors described here were taken into account in the models, they would result in different distribution of NLR sizes for Seyfert 1’s and Seyfert 2’s, which could look much more like ours.
3.2 NLR Morphologies
Besides the sizes of the NLR regions, we also compared other morphological measures. A simple picture of the Unified Model, predicts that since the conical NLR of Seyfert 1’s is seen close to end-on, they should look rounder than the NLR of Seyfert 2’s, which are seen closer to edge-on. Second, due to this projection effect, we also expect the NLR’s to be more concentrated towards the nucleus in Seyfert 1’s than in Seyfert 2’s, since we are integrating a larger column density of gas along the line of sight in those galaxies (if the NLR is more or less uniformly filled rather than hollow).
We first compare the ratio between the apparent semi major and semi minor axes of the [OIII] emission. Figure 3 shows the RMaj/RMin distribution, which is peaked at values smaller than 1.5, and decreases to higher values. Most of the Seyfert 1’s in the sample are concentrated in this bin, while Seyfert 2’s have a broader distribution, extending to much higher values. We find that 68% of the Seyfert 1 galaxies have RMaj/R, indicating that their NLR’s have more of a halo like morphology. On the other hand, 68% of the Seyfert 2 galaxies have RMaj/R, which indicates that their NLR’s are more elongated.
Comparing the distribution of RMaj/RMin values of Seyfert 1’s and Seyfert 2’s using the KS test, we find that there is only a 2.3% probability that two samples drawn from the same parent population would differ this much. Even if we eliminate the two Seyfert 2 galaxies with the largest ratios, we still find a significant difference between the two samples, with the KS test giving only a 3.4% probability. These results are consistent with the scenario where the conical NLR if Seyfert 1 galaxies are seen closer to end-on, while Seyfert 2’s are seen closer to edge-on.
The compactness of the NLR emission can be tested in several ways, four of which are presented here. We first compare the ratio of the nuclear [OIII] flux, which corresponds to the flux inside an aperture with a radius of 100 parsecs, centered at the nucleus, to the integrated [OIII] flux. The left panel of Figure 4 shows that the F([OIII])nuc/F([OIII])int distribution, where we can see that Seyfert 1’s are skewed towards higher values and Seyfert 2’s are skewed towards lower ones, indicating that the emission is more concentrated towards the nucleus in the former. Comparing the two distributions using the KS test we find that there is only a 0.47% chance that two samples drawn from the same parent population would differ this much.
A similar test for the concentration of the [OIII] emission around the nucleus consists in comparing the nuclear [OIII] luminosities, which we present in the right panel of Figure 4. As for the F([OIII])nuc/F([OIII])int ratio, we find that the two Seyfert types have significantly different distributions, with the Seyfert 1’s having higher L([OIII])nuc’s. Since both types have similar L([OIII])int distributions (Schmitt et al. 2003), we conclude that the emission is more concentrated towards the nucleus in Seyfert 1’s. Comparing the L([OIII])nuc distributions using the KS test, we find that there is only a 0.14% chance that two samples drawn from the same parent population would differ this much.
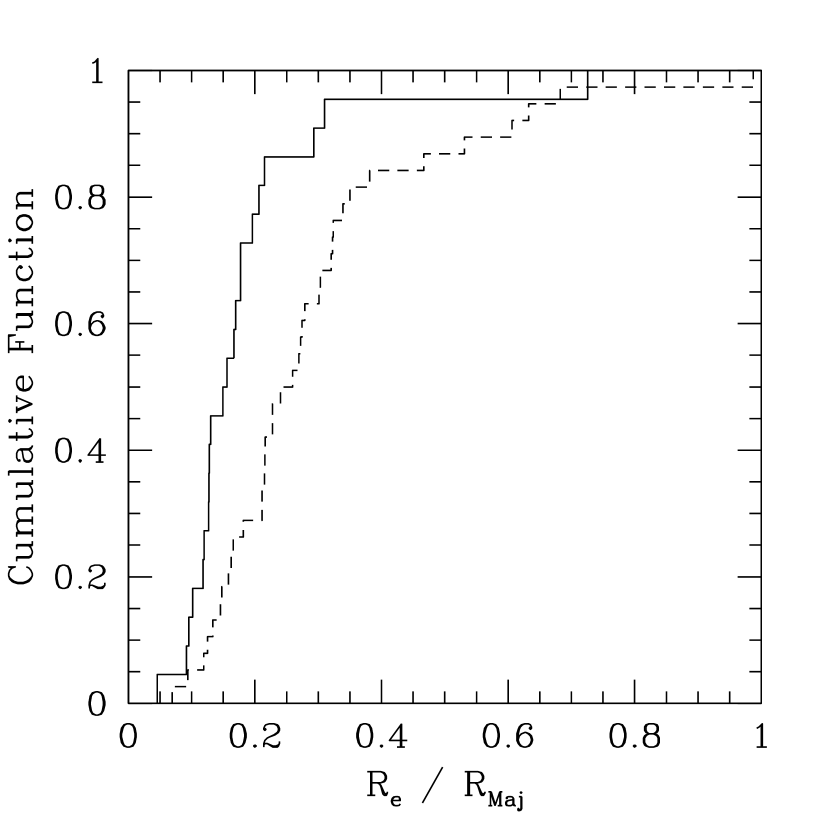
Two alternative ways to confirm that the NLR emission is more concentrated towards the nucleus in Seyfert 1’s than in Seyfert 2’s, is to compare the distribution of their effective radii, and the ratios between the effective radius to the semi major axis of the NLR. In the left panel of Figure 5 we present the distribution of the logarithm of the effective radii of the NLR’s of Seyfert 1’s and Seyfert 2’s. As expected, from the results obtained in Figure 4, Seyfert 1’s have on average smaller Re’s than Seyfert 2’s, with the KS test finding only a 0.5% probability that two samples drawn from the same parent population would differ this much. The Re/RMaj distribution (Figure 5 right panel) confirms these results, with Seyfert 1’s presenting smaller values than Seyfert 2’s. The KS test shows that two samples drawn from the same parent population would differ as much as these two only 0.08% of the time.
4 NLR Size-Luminosity Relation
An important question in the study of AGN’s is how the size of the NLR scales with the luminosity of the central source. If such a correlation exists over a large range of luminosities (as in our sample), we can use this to improve our knowledge about the ionization structure of the NLR, as well as derive an extra input in photoionization models.
So far, most of the work on this subject has been concentrated on the size-luminosity relation of the Broad Line Regions (BLR’s), which has an important application in the determination of black hole masses. Reverberation mapping studies have been used to determine the slope of this relation in Seyfert 1’s and QSO’s, where the typical values found are RL (e.g. Peterson et al. 2002) and RL (Kaspi et al. 2000), respectively. However, little work has been done in the case of NLR sizes. Mulchaey et al. (1996b) found, based on their ground based observations, that RMaj and [OIII] luminosity are correlated, but considered that this result could very well have been due to a selection effect. Pogge et al. (2000) found that the NLR’s of LINER’s are significantly smaller than those of Seyferts, consistent with the fact that they are lower luminosity AGN’s. More recently, Bennert et al. (2002), repeated the analysis of Mulchaey et al. (1996b) for a sample of 7 QSO’s and 7 Seyfert 2 galaxies. They found a good correlation between these two quantities, with a slope of approximately 0.5. They discuss the implication of this result and the fact that this slope is similar to that found for BLR’s, but caution that their result is based on a small number of galaxies and requires further investigation, using a larger sample.
4.1 Seyfert Galaxies
The sample and measurements being used in this paper are ideal to determine if there is a correlation of NLR size and luminosity in Seyferts. If one assumes that the [OIII] luminosity can be used as a surrogate for the nuclear continuum luminosity, as indicated by the correlations between emission line and continuum strength found by several authors (Yee 1980; Shuder 1981; Cid Fernandes et al. 2001; Ho & Peng 2001), one gets that our sample spans about 3 decades in nuclear luminosity (39.2 log L([OIII])42.2). Another advantage of our sample is the fact that the galaxies are nearby, so we are able to resolve the NLR emission.
One could argue that it would be more appropriate to do such measurements using H or other recombination line images, since [OIII] is a collisionally excited line. However, Falcke et al. (1998) and Ferruit et al. (2000) showed that the H and [OIII] images of Seyfert galaxies have similar structures and extents, indicating that using [OIII] is not a problem. Furthermore, H has the major drawback of being highly sensitive to star formation. Using this line would increase the chance of contaminating the measurements with HII regions.
We present in Figure 6 a series of log R log L([OIII]) plots. The left panel presents all the Seyferts in the sample, where we can clearly see a correlation between these two measurements. The Spearman rank test gives a probability smaller than 0.01% that a correlation is not present. This plot also presents a linear fit to the data, which gives the following relation:
with a correlation coefficient of 0.627.
A conservative estimate of the uncertainty in the measurement of RMaj suggests that these values can be off by 2 pixels (0.2″) in the worst cases. On average, this corresponds to an error smaller than 10%, so we decided to fit the data using uniform weighting of the points.
Figure 6 also presents the same plot, separating the galaxies into Seyfert 2’s and Seyfert 1’s only (middle and right panel, respectively). We can see that the correlation is still present, although with some small differences. The best fitting line for Seyfert 2’s is:
with a correlation coefficient of 0.677, and the Spearman rank test showing a probability smaller than 0.01% that a correlation is not present. For Seyfert 1’s, we find that the best fitting line is:
with a correlation coefficient of 0.666, and a Spearman rank test probability of 0.13% that a correlation is not present.
A comparison between the best fitting line for the entire sample and that obtained using only Seyfert 2’s, shows a very small difference in all the parameters, as well as in the correlation coefficient. On the other hand, when we compare the results obtained for Seyfert 1’s with those obtained for Seyfert 2’s or the entire sample, we find that Seyfert 1’s have a steeper slope, with a larger uncertainty. Considering this uncertainty, we find that this slope is not significantly different from the other two.
The scatter in the correlation for Seyfert 1’s is larger than that for Seyfert 2’s, which can be due to projection effects. Since the NLR of those galaxies is observed closer to end-on, this can result, in some cases, in smaller dimensions than the intrinsic ones, increasing the scatter in the plot. This problem is reduced in Seyfert 2’s, because their NLR’s are seen closer to edge-on, resulting in dimensions closer to the intrinsic ones.
We considered whether the observed correlations could be due to the fact that all our observation had similar detection limits, which corresponded to a more or less constant [OIII] surface brightness. In a situation like this, the luminosity of the NLR increases as a function of its area, and one would expect a relation of the form R L([OIII])0.5. This relation is much steeper than the observed one, and inconsistent with the measurements, indicating that the observational result is not dominated by this effect.
A problem similar to this, which could influence our observation, would be the difficulty to detect the fainter, most extended emission in the more distant galaxies, due to the uniform detection limit of our observations. The most distant galaxies usually are the more luminous ones in a flux limited sample, and, since the fainter gas may not necessarily make a significant contribution to the integrated [OIII] luminosity, this would flatten the observed correlation. We tested if our results were due to this effect by dividing the sample in half, based on their distances, and fitting lines to this data. For those galaxies with radial velocities smaller than 5300 km s-1 we get that RMaj goes with the 0.300.06 power of L([OIII]), and for the most distant half of the sample we get a relation with the 0.320.05 power. We do not differentiate between Seyfert 1’s and Seyfert 2’s in this analysis because there are not enough galaxies to allow us to do so. Again, we find no significant difference in the slopes of the two subsamples of Seyferts, indicating that the observed result should not be due to this distance-size effect.
As a last test, instead of using the integrated values, we use the effective radii and luminosities. In Figure 7 we present the log Rlog L([OIII])e plot, where we can see that a correlation still is present, but with a much larger scatter and flatter slope than that obtained using the integrated values. The best fitting line is:
with a correlation coefficient of 0.338 and a Spearman rank probability of 0.94% that a correlation is not present.
The results presented above show that there is a correlation of the form R L([OIII])0.33±0.04 between the size and luminosity of the NLR of Seyfert galaxies. A simple interpretation of this result suggests that these NLR’s can be represented by one of the simplest ionization structures, a cloud of gas ionized by a central source (Strömgren sphere). Albeit the geometry of an AGN is consistent with this picture, observing such a correlation is a little surprising. In principle, the relation R L0.33 is valid only in the case of constant density, but more elaborate and complete models may also be able to reproduce this relation. Our observations, as well as spectroscopic ones, show that the gas is not homogeneously distributed inside the NLR, and there is also some evidence indicating that the gas density may increase towards the nucleus. Interactions between radio jets and the NLR gas can also significantly alter its shape, and possibly generate shocks, which will represent a second source of ionization to the gas. A combination of all these factors could in practice result in slopes steeper than the observed one.
Our result also differs from claims that the ionization parameter does not vary by a significant amount inside the NLR, which should result in a size-luminosity relation like the one found by Bennert et al. (2002) (R L0.5). These claims are based on the fact that emission line ratios are uniform among different objects (see Dopita et al. 2002 for a discussion on this subject). However, spatially resolved observations of several Seyfert galaxies (e.g. Storchi-Bergmann et al. 1992; Fraquelli, Storchi-Bergmann & Binette 2000) show that the excitation of the NLR gas decreases with distance from the nucleus. Furthermore, Ferguson et al. (1997), using photoionization models which use locally optimally emitting clouds, showed that given the right ensemble of clouds, the ionization parameter can vary by a factor of more than 10 while emission line ratios like [OIII]/H and [OIII]/H[NII], which are used as excitation indicators, remain constant. All these results indicate that the ionization parameter of the gas in the NLR falls with distance from the nucleus, consistent with our results.
4.2 Comparison of Seyferts and QSO’s
Compared with the results obtained by Bennert et al. (2002) using Seyfert 2’s and QSO’s, our data indicate a significantly flatter slope for the size-luminosity relation. Since their results were based on a much smaller number of sources, we combined their QSO measurements, converted from H km s-1 Mpc-1 to 75 km s-1 Mpc-1, with those for our Seyfert galaxies. These results are presented in Figure 8, where we can see that, compared to Seyferts, the QSO points deviate from the general trend defined by those galaxies, having RMaj values larger than expected. The best fitting line to the combined data points gives:
with a correlation coefficient of 0.819, and the Spearman rank test showing a probability smaller than 0.01% that a correlation is not present.
This slope value is significantly steeper than that found using only Seyfert galaxies. Currently we are not sure of the reason for such a difference. One possible explanation would be that the NLR’s of Seyferts and QSO’s are intrinsically different. However, given the fact that Seyferts seem to be lower luminosity cousins of QSO’s, this explanation seems to be very unlikely. The only remaining possibility for the difference is that it is due to some effect in the measurements of either Seyferts or QSO’s.
One possibility would be the reduction technique used for some of the QSO’s presented by Bennert et al. (2002), which could have increased their NLR sizes. For 4 of their QSO’s, instead of subtracting a continuum image from their on-band images, they subtracted only the PSF of a star. This procedure may leave a residual host galaxy continuum contribution to the final image, causing an overestimation of the NLR sizes and luminosities. Nevertheless, these authors claim that their results were not influenced by this effect, as the comparison of the images obtained in this way with those obtained subtracting a scaled broad band image do not show a significant difference.
A way to significantly increase the sizes of QSO NLR’s would be to include star-forming regions in the measurement. Canalizo & Stockton (2000a,b; 2001) showed several QSO’s with circumnuclear star forming regions, suggesting that this may be a common phenomenon. Since Seyfert galaxies also are known to have circumnuclear starbursts (Heckman et al. 1997; Cid Fernandes, Storchi-Bergmann & Schmitt 1998; Schmitt, Storchi-Bergmann & Cid Fernandes 1999; González Delgado, Heckman & Leitherer 2001; Cid Fernandes et al. 2001), this effect should also be important in the determination of their NLR sizes. However, since the QSO sample is approximately 10 times more distant than the Seyfert sample, this effect is much more pronounced for those galaxies, because of the angular scale of their images (usually larger than 1 kpc per arcsec). Since both Seyferts and QSOs were observed with the Linear Ramp Filter, which has a field of view of 13″, most of these regions would not be seen in the images of Seyferts. It is also possible that, since several QSO’s are related to interacting systems, presenting tidal tails and bridges (Stockton & MacKenty 1987; Bahcall, Kirhakos & Schneider 1995; Bahcall et al. 1997; Dunlop et al. 2003), that these interactions can provide debries at large distances from the nucleus, which can be ionized by the central engine, increasing the size of the NLR.
5 Comparison of Position Angles
5.1 [OIII] versus Radio Jets
Ground-based observations of Seyfert galaxies with large extended NLR’s have shown that there is a good correlation between the orientation of the [OIII] emission and that of the radio jet (Wilson & Tsvetanov 1994; Nagar et al. 1999). These results were later confirmed by HST ones (Capetti et al. 1996; Falcke et al. 1998). Combining this information with the fact that Seyfert galaxies with luminous radio sources have systematically broader [OIII] emission lines (Whittle 1992), indicates that the NLR gas can be significantly disturbed by the interaction with the jet. This interaction can either ionize the gas through shocks, or simply compress it, resulting in regions of enhanced emission.
In Figure 9 we present the cumulative distribution of the difference between the position angle of the [OIII] major axis (P.A.[OIII]) and the P.A. of the radio jet (P.A.RAD). The information about the radio jet axis was obtained from Kinney et al. (2000). We find that this distribution is peaked around 0∘, with a small tail towards higher values. The KS test shows that there is only a 0.01% probability of the observed distribution being drawn from a uniform distribution in the range 0∘ to 90∘. We did not try to compare the distribution of Seyfert 1’s and Seyfert 2’s, because there are only 7 Seyfert 1 galaxies with both radio and [OIII] extended emission in our sample. Nevertheless, an inspection of the left panel of Figure 9 provides no conclusive evidence that both types have different distributions.
The fact that not all galaxies have perfectly aligned [OIII] and radio emission, can in part be explained by the uncertainties in the measurement of the P.A.’s. This effect is very important for those galaxies with P.A.P.A., all of which have faint and only slightly resolved radio emission, or, in the case of UGC 2514, have [OIII] emission extending over more than one direction. Another possibility for those galaxies with a small misalignment is a projection effect, like the one observed in NGC 4151 (Pedlar et al. 1993). This effect is caused by the fact that the torus axis is misaligned relative to the host galaxy axis. In this way the AGN ionizes the gas in the disk of the galaxy, while the radio jet, which is aligned to the torus axis, is at an intermediate angle between the disk and the host galaxy axis. When seen in projection, this causes a misalignment between the radio and [OIII] emission, which in the case of NGC 4151 is of the order of 30∘.
5.2 [OIII] versus Host Galaxy Major Axis
As pointed out by Clarke, Kinney & Pringle (1998), symmetry assumptions suggest that the accretion disk of Seyfert galaxies should be aligned with their host galaxy disk. Consequently, one would expect all radio jets to be perpendicular to their host galaxy major axes. However, these predictions are clearly contradicted by the observations (Ulvestad & Wilson 1984; Schmitt et al. 1997; Nagar & Wilson 1999; Pringle et al. 1999; Kinney et al. 2000) which show that the observed distribution of jets is consistent with a homogeneous distribution in three dimensions. Taking into consideration the relatively good alignment between the radio and [OIII] emission, we use the measurements of P.A.[OIII] to verify if the NLR of these galaxies have any prefered alignment relative to the host galaxy disk.
In Figure 10 we present the distribution of the difference between P.A.[OIII] and P.A. of the host galaxy major axis (P.A.MA). We point out that in the cases where the [OIII] emission had a conically shaped NLR, but the axis of the cone was shorter than the major extent of the NLR, we used the P.A. of the cone axis. We find that the distribution of values for all galaxies is consistent with a uniform distribution. The KS test gives a 56% probability that a sample drawn from a uniform distribution in the range 0∘ to 90∘ would differ as much as the observed one does. A comparison between the distribution of Seyfert 1’s and Seyfert 2’s shows that the former are more concentrated towards smaller values ([OIII] emission along the major axis) while the latter seems to have a higher percentage of sources with [OIII] emission aligned close to perpendicular to the host galaxy major axis. However, this difference does not have a high statistical significance. The KS test gives a 6.2% probability that two samples drawn from the same parent population would differ as much as the two Seyfert types.
The fact that the direction of the [OIII] emission of Seyfert galaxies is randomly oriented relative to the host galaxy major axis, confirms the results obtained from the comparison between the orientation of the radio and host galaxy major axes (Kinney et al. 2000). These results have important implications for the mechanisms responsible for the misalignment of the accretion disks relative to the host galaxy disks. Since the radio and [OIII] axes are reasonably well aligned, this implies that the torus and accretion disk axes are well aligned. This is evidence against the spin of the black hole being the mechanism responsible for changing the orientation of the accretion disk, through the Bardeen-Petterson effect. This effect may work at the accretion disk level, but is not important at the distance of the torus. Instead, this result supports the idea that the accretion disk is fed by gas from the torus, which determines its orientation, and the orientation of the torus is determined by the origin of its gas, which can be either internal or external from the galaxy.
6 Summary and Conclusions
This paper discussed the results of an HST narrow band imaging survey of [OIII]5007Å emission in a sample of 22 Seyfert 1 and 38 Seyfert 2 galaxies. The data, reductions and measurements used here were presented in Schmitt et al. (2003), where we also show that the sample of galaxies for which we have [OIII] images is a representative subsample of the 60m sample of Seyferts described by Kinney et al. (2000) and Schmitt et al. (2001). This indicates that this sample can be used to draw robust statistical results about the Unified Model.
Our results can be divided into three groups: those which investigate the properties of the NLR of Seyfert 1’s and Seyfert 2’s and compare them to the predictions from the Unified Model; those which investigate the relation between the size and luminosity of the NLR; and those which study the orientation of the NLR relative to radio jets and host galaxy major axes.
In the study of NLR properties, we found the following results from the comparison between the measurements of Seyfert 1’s and Seyfert 2’s with the predictions from the Unified Model. First, both Seyfert types have similar distributions of NLR sizes. Compared to NLR models presented by Mulchaey et al. (1996b), this suggests that the NLR gas is consistent with a disk like distribution. However, several galaxies in the sample are known to have outflows, which indicates that the disk morphology does not apply to all galaxies. One problem that appears from this comparison is the lack of a significant difference in the RMaj distribution of the two Seyfert types. According to Mulchaey et al. (1996b), one would expect Seyfert 1’s to have, on average, smaller NLR sizes than Seyfert 2’s, but under a more detailed scrutiny, we find effects which might significantly alter both the measurements and models.
Some of the effects we think may significantly alter the measured NLR sizes are the possible overestimation of the NLR size in several Seyfert 1 galaxies, which may not be significantly resolved even at the HST resolution, and the possible underestimation of the NLR size in several Seyfert 2 galaxies, which may have up to half of their NLR’s hidden by the torus and the host galaxy disk. Enhanced surface brightness in Seyfert 1’s, due to foreshortening of the conical NLR can also play an important role in the detection of extended emission in these galaxies. We do not find a significant difference in the offset between the nucleus and the centroid of the NLR in Seyfert 1’s or Seyfert 2’s, suggesting that, although this problem is present in some sources, it is not the most important factor driving their similar distribution of NLR sizes.
We also consider the possibility that Mulchaey et al. (1996b) models could be significantly changed if one modifies their input parameters, possibly resulting in similar NLR size distributions for Seyfert 1’s and Seyfert 2’s. Their models assumed that all galaxies have similar NLR’s, and the only parameters that vary are the distribution of gas and the inclination of the putative torus relative to the line of sight. Since the NLR size, and probably even the torus opening angle, depend on the luminosity of the AGN, if these effects are taken into account in the models, one could obtain theoretical distributions of RMaj’s different from the ones obtained by these authors, which could in principle be more similar to the observed one.
Following on this subject, we performed a set of tests aimed at comparing the morphology of the two Seyfert types and the degree of concentration of the NLR emission around the nucleus. These tests showed that there is a higher percentage of Seyfert 1’s with halo like NLR’s (RMaj/R1.5), while those of Seyfert 2’s are more elongated. Another interesting result is the fact that Seyfert 1 NLR’s are more concentrated towards the nucleus, indicated by the fact that they, on average, have higher F([OIII])nuc/F([OIII])int ratios and L([OIII])nuc than Seyfert 2’s. Seyfert 1 galaxies also have smaller Re and Re/RMaj values than Seyfert 2’s, consistent with their emission being more concentrated towards the nucleus. These results are in good agreement with the Unified Model prediction that the conical NLR of Seyfert 1’s is observed closer to end-on, while that of Seyfert 2’s is closer to edge-on.
The fact that the NLR emission is more concentrated towards the nucleus in Seyfert 1’s, explains why Schmitt & Kinney (1996) observed that their Seyfert 1’s had much smaller NLR’s than the Seyfert 2’s. All the Seyfert 1 galaxies in their sample were observed by HST with spherical aberration. Since the NLR emission of these galaxies is concentrated around the nucleus, the spherical aberration washed out most of the extended emission, which could not be recovered even after the deconvolution of the images.
The second group of results shows that there is a relation between the size and the luminosity of the NLR’s of Seyferts, with the form R L([OIII])0.33±0.04. We tested whether there was any distance or observational bias which could influence this result, but could not find anything. This result indicates that the NLR follows the simple predictions of a distribution of gas being ionized by a central source. We point out that this correlation can be generated by more complex models, and discuss some ways in which it could be changed. For instance, if the density of the NLR gas decreases with radius, this would result in a relation steeper than the observed one. This result also agrees with those obtained from photoionization models, which indicate that single zone models are not an appropriate representation for NLR’s (Dopita et al. 2002; Binette, Wilson & Storchi-Bergmann 1996). The slope obtained by us is different from the one obtained by Bennert et al. (2002) for a sample of 7 QSO’s and 7 Seyfert 2’s. These authors found a relation with a slope 0.5. We explore possible reasons why the two relations differ, like the undersubtraction of the host galaxy continuum, or the inclusion of circumnuclear star forming regions in their measurements.
The last set of results obtained in this paper were based on the comparison of the P.A. of the extended [OIII] emission to the P.A. of radio jets and host galaxy major axes. We found a very good alignment between the radio and [OIII] emission, confirming results from previous papers (Taylor et al. 1989; Wilson & Tsvetanov 1994; Capetti et al. 1996, among others). The good correlation between these two properties was known for a long time, indicating that the jet can significantly disturb the NLR gas, compress it, making it radiate strongly, or even ionize it through shocks (Taylor, Dyson & Axon 1992; Dopita & Sutherland 1995,1996). However, we point out that not all galaxies with extended [OIII] emission present extended radio emission (e.g. NGC 5347, MCG +03-45-003), indicating that shocks probably are not an extremely important mechanism of ionization in these galaxies. Finally, the radio jet could just be a passive indicator of the axis of a shadowing structure determining the [OIII] orientation.
The comparison between the direction of the [OIII] emission to that of the host galaxy major axis shows a random distribution. This confirms the result that we obtained comparing the radio and host galaxy major axes (Kinney et al. 2000), and, combined with the good alignment of the radio and [OIII] emission, indicate that the torus and accretion disk axes are relatively well aligned. These results imply that the misalignment of the accretion disk relative to the host galaxy disk cannot be due to the Bardeen-Petterson effect in a rapidly rotating black hole, but rather that the orientation of the gas in the torus determines the orientation of the accretion disk.
The conclusions that we can take from our analysis are the following. We find that our results are broadly consistent with predictions from the Unified Model. Albeit both Seyfert types have similar NLR size distributions, we take this result not as evidence that the Unified Model is wrong, but rather that observed structures can be more complex than expected, and the models with which we compared our results used simple assumptions. More advanced models, ones which consider that the galaxies have a range of luminosities and torus opening angles, are clearly needed. The NLR size-luminosity relation shows that, to first order, a central source ionizing the gas is a good representation to the observations, although more complex models may produce similar results. This agrees with previous results which show that single zone photoionization models are not appropriate to study NLR’s. The [OIII] and radio emission are well correlated, which indicates that the torus and accretion disk axes are closely aligned. This implies that the orientation of the accretion disk is determined by the torus and not by the spin of the black hole.
References
- (1) Antonucci, R. R. J. 1993, ARA&A, 31, 473
- (2) Antonucci, R. 2002, in Astrophysical spectropolarimetry, p. 151 (Cambridge University Press, Cambridge, UK)
- (3) Antonucci, R. R. J. & Miller, J. S. 1985, ApJ, 297, 621
- (4) Bahcall, J. N., Kirhakos, S. & Schneider, D. P. 1995, ApJ, 454, L175
- (5) Bahcall, J. N., Kirhakos, S., Saxe, D. H. & Schneider, D. P. 1997, ApJ, 479, 642
- (6) Bennert, N., Falcke, H., Schulz, H., Wilson, A. S. & Wills, B. J. 2002, ApJ, 674, L105
- (7) Binette, L., Wilson, A. S. & Storchi-Bergmann, T. 1996, A&A, 312, 365
- (8) Boksenberg, A. et al. 1995, ApJ, 440, 151
- (9) Bower, G. A., Wilson, A. S., Mulchaey, J. S., Miley, G. K., Heckman, T. M. & Krolik, J. H. 1994, AJ, 107, 1686
- (10) Canalizo, G. & Stockton, A. 2000a, ApJ, 528, 201
- (11) Canalizo, G. & Stockton, A. 2000b, AJ, 120, 1750
- (12) Canalizo, G. & Stockton, A. 2001, ApJ, 555, 719
- (13) Capetti, A., Axon, D. J., Macchetto, F., Sparks, W. B., & Boksenberg, A. 1996, ApJ, 466, 169
- (14) Cecil, G., Dopita, M. A., Groves, B., Wilson, A. S. & Binette, L. 2002, ApJ, 568, 627
- (15) Cid Fernandes, R., Heckman, T., Schmitt, H., Gonzalez Delgado, R. M. & Storchi-Bergmann, T. 2001, ApJ, 558, 81
- (16) Cid Fernandes, R., Storchi-Bergmann, T. & Schmitt, H. R. 1998, MNRAS, 297, 579
- (17) Clarke, C. J., Kinney, A. L. & Pringle, J. E. 1998, ApJ, 495, 189
- (18) Cooke, A. J., Baldwin, J. A., Ferland, G. J., Netzer, H. & Wilson, A. S. 2000, ApJS, 129, 517
- (19) Corbin, M. R., Baldwin, J. A. & Wilson, A. S. 1988, ApJ, 334, 584
- (20) Crenshaw, D. M. et al. 2000, AJ, 120, 1731
- (21) Crenshaw, D. M. & Kraemer, S. B. 2000, ApJ, 532, L101
- (22) de Grijp, M. H. K., Keel, W. C., Miley, G. K., Goudfrooij, P., & Lub, J. 1992, A&AS, 96, 389
- (23) de Grijp, M. H. K., Miley, G. K., & Lub, J. 1987, A&AS, 70, 95
- (24) Dopita. M. A., Groves, B. A., Sutherland, R. S. , Binette, L. & Cecil, G. 2002, ApJ, 572, 753
- (25) Dopita. M. A. & Sutherland, R. S. 1995, ApJ, 455, 468
- (26) Dopita. M. A. & Sutherland, R. S. 1996, ApJS, 102, 161
- (27) Dunlop, J. S., McLure, R. J., Kukula, M. J., Baum, S. A., O’Dea, C. P. & Hughes, D. H. 2003, MNRAS, 340, 1095
- (28) Falcke, H., Wilson, A. S. & Simpson, C. 1998, ApJ, 502, 199
- (29) Ferguson, S. W., Korista, K., Baldwin, J. A. & Ferland, G. J. 1997, ApJ, 487, 122
- (30) Ferruit, P., Wilson, A. S., & Mulchaey, J. 2000, ApJS, 128, 139
- (31) Fraquelli, H. A., Storchi-Bergmann, T. & Binette, L. 2000, ApJ, 532, 867
- (32) González Delgado, R. M., Heckman, T. M. & Leitherer, C. 2001, ApJ, 546, 845
- (33) Haniff, C. A., Wilson, A. S., & Ward, M. J. 1988, ApJ, 334, 104
- (34) Heckman, T. M., Gonzalez-Delgado, R., Leitherer, C., Meurer, G. R., Krolik, J, Wilson, A. S., Koratkar, A., Kinney, A. 1997, ApJ, 482, 114
- (35) Ho, L. C. & Peng, C. Y. 2001, ApJ, 555, 650
- (36) Hutchings, J. B. et al. 1998, ApJ, 492, 115
- (37) Kaspi, S., Smith, P. S., Netzer, H., Maoz, D., Jannuzi, B. T., & Giveon, U. 2000, ApJ, 533, 631
- (38) Kay, L. E. 1994, ApJ, 430, 196
- (39) Keel, W. C. 1980, AJ, 85, 198
- (40) Kinney, A. L., Schmitt, H. R., Clarke, C. J., Pringle, J. E., Ulvestad, J. S. & Antonucci, R. R. J. 2000, ApJ, 537, 152
- (41) Lawrence, A. 1991, MNRAS, 252, 586
- (42) Lawrence, A. & Elvis, M. 1982, ApJ, 256, 410
- (43) Macchetto, F., Capetti, A., Sparks, W. B., Axon, D. J. & Boksenberg, A. 1994, ApJ, 435, L15
- (44) Maiolino, R. & Rieke, G. H. 1995, ApJ, 454, 95
- (45) Miller, J. S. & Goodrich, R. W. 1990, ApJ, 355, 456
- (46) Mulchaey, J. S., Tsvetanov, Z., Wilson, A. S. & Perez-Fournon, I. 1992, ApJ, 394, 91
- (47) Mulchaey, J. S., Wilson, A. S., Bower, G. A., Heckman, T. M., Krolik, J. H. & Miley, G. K. 1994, ApJ, 433, 625
- (48) Mulchaey, J. S., Wilson, A. S., & Tsvetanov, Z. I. 1996a, ApJS, 102, 309
- (49) Mulchaey, J. S., Wilson, A. S., & Tsvetanov, Z. I. 1996b, ApJ, 467, 197
- (50) Nagar, N. M. & Wilson, A. S. 1999, ApJ, 516, 97
- (51) Nagar, N. M., Wilson, A. S., Mulchaey, J. S. & Gallimore, J. F. 1999, ApJS, 120, 209
- (52) Pedlar, A., Kukula, M. J., Longley, D. P. T., Muxlow, T. W. B., Axon, D. J., Baum, S., O’Dea, C. & Unger, S. W. 1993, MNRAS, 263, 471
- (53) Perez, E., González Delgado, R., Tadhunter, C. & Tsvetanov, Z. 1989, MNRAS, 241, 31p
- (54) Peterson, B. M. et al. 2002, ApJ, 581, 197
- (55) Pogge, R. W. 1988a, ApJ, 328, 519
- (56) Pogge, R. W. 1988b, ApJ, 332, 702
- (57) Pogge, R. W. 1989, ApJ, 345, 730
- (58) Pogge, R. W., Maoz, D., Ho, L. C. & Eracleous, M. 2000, ApJ, 532, 323
- (59) Pringle, J. E., Antonucci, R. R. J., Clarke, C. J., Kinney, A. L., Schmitt, H. R. & Ulvestad, J. S. 1999, ApJ, 526, L9
- (60) Schmitt, H. R., Antonucci, R. R. J., Ulvestad, J. S., Kinney, A. L.,Clarke, C. J. & Pringle, J. E. 2001a, ApJ, 555, 663
- (61) Schmitt, H. R., Donley, J., Antonucci, R. R. J., Hutchings, J., Kinney, A. L. & Pringle, J. E. 2003, ApJS, submitted
- (62) Schmitt, H. R. & Kinney, A. L. 1996, ApJ, 463, 498
- (63) Schmitt, H. R., Kinney, A. L., Storchi-Bergmann, T. & Antonucci, R. R. J. 1997, ApJ, 477, 623
- (64) Schmitt, H. R., Storchi-Bergmann, T. & Baldwin, J. A. 1994, ApJ, 423, 237
- (65) Schmitt, H. R., Storchi-Bergmann, T. & Cid Fernandes 1999, MNRAS, 303, 173
- (66) Shuder, J. M. 1981, ApJ, 244, 12
- (67) Simpson, C., Wilson, A. S., Bower, G., Heckman, T. M., Krolik, J. H. & Miley, G. K. 1997, ApJ, 474, 121
- (68) Stockton, A. & MacKenty, J. W. 1987, ApJ, 316, 584
- (69) Storchi-Bergmann, T., Mulchaey, J. S. & Wilson, A. S. 1992, ApJ, 395, L73
- (70) Storchi-Bergmann, T., Wilson, A. S. & Baldwin, J. A. 1992, ApJ, 396, 45
- (71) Tadhunter, C. & Tsvetanov, Z. 1989, Nature, 341, 422
- (72) Taylor, D., Dyson, J. E. & Axon, D. J. 1992, MNRAS, 255, 351
- (73) Taylor, D., Dyson, J. E., Axon, D. J. & Pedlar, A. 1989, MNRAS, 240, 487
- (74) Tran, H. D. 1995, ApJ, 440, 578
- (75) Turner, T. J., George, I. M., Nandra, K. & Mushotzky, R. F. 1997, ApJS, 113, 23
- (76) Ulvestad, J. S. & Wilson, A. S. 1984, ApJ, 285, 439
- (77) Urry, C. M., & Padovani, P. 1995, PASP, 107, 803
- (78) Veilleux, S., Bland-Hawthorn, J., Cecil, G., Tully, R. B. & Miller, S. T. 1999, ApJ, 520, 111
- (79) Whittle, M. 1992, ApJ, 387, 121
- (80) Wilson, A. S. 1997, in ASP Conf. Ser. 113, Emission Lines in Active Galaxies: New Methods and Techniques, ed. B. M. Peterson, F.-Z. Cheng, & A. S. Wilson (San Francisco: ASP), 264
- (81) Wilson, A. S., Braatz, J. A., Heckman, T. M., Krolik, J. H. & Miley, G. K. 1993, ApJ, 419, L61
- (82) Wilson, A. S., Ward, M. J., & Haniff, C. A. 1988, ApJ, 334, 121
- (83) Wilson, A. S. & Tsvetanov, Z. 1994, AJ, 107, 1227
- (84) Yee, H. K. C. 1980, ApJ, 241, 894


| Property | Distribution A | Distribution B | KS Test | Figure |
|---|---|---|---|---|
| (%) | ||||
| (1) | (2) | (3) | (4) | (5) |
| RMaj | 1 | 2 | 90 | 1 |
| Offsets | 1 | 2 | 33 | 2 |
| RMaj/RMin | 1 | 2 | 2.3 | 3 |
| RMaj/RMin | 1 | 2 | 3.4b | 3 |
| F([OIII])nuc/F([OIII])int | 1 | 2 | 0.47 | 4, left |
| L([OIII])nuc | 1 | 2 | 0.14 | 4, right |
| Re | 1 | 2 | 0.5 | 5, left |
| Re/RMaj | 1 | 2 | 0.08 | 5, right |
| P.A.[OIII]-P.A.RAD | 1+2 | Uniform | 0.01 | 9 |
| P.A.[OIII]-P.A.MA | 1+2 | Uniform | 56 | 10 |
| P.A.[OIII]-P.A.MA | 1 | 2 | 6.2 | 10 |