MASSIVE STAR FORMATION IN A GRAVITATIONALLY-LENSED H II GALAXY AT z = 3.35711affiliation: Based partly on observations with the NASA/ESA Hubble Space Telescope, obtained at the Space Telescope Science Institute, which is operated by the Association of Universities for Research in Astronomy, Inc. under NASA contract No. NAS5-26555. 2 2affiliationmark: 3 3affiliationmark:
Abstract
The Lynx arc, with a redshift of 3.357, was discovered during spectroscopic follow-up of the cluster (catalog )from the ROSAT Deep Cluster Survey. The arc is characterized by a very red color and strong, narrow emission lines. Analysis of HST WFPC 2 imaging and Keck optical and infrared spectroscopy shows that the arc is an H II galaxy magnified by a factor of by a complex cluster environment. The high intrinsic luminosity, the emission line spectrum, the absorption components seen in Ly and C IV, and the restframe ultraviolet continuum are all consistent with a simple H II region model containing hot O stars. The best fit parameters for this model imply a very hot ionizing continuum ( K), high ionization parameter (), and low nebular metallicity (). The narrowness of the emission lines requires a low mass-to-light ratio for the ionizing stars, suggestive of an extremely low metallicity stellar cluster. The apparent overabundance of silicon in the nebula could indicate enrichment by past pair instability supernovæ, requiring stars more massive than .
1 INTRODUCTION
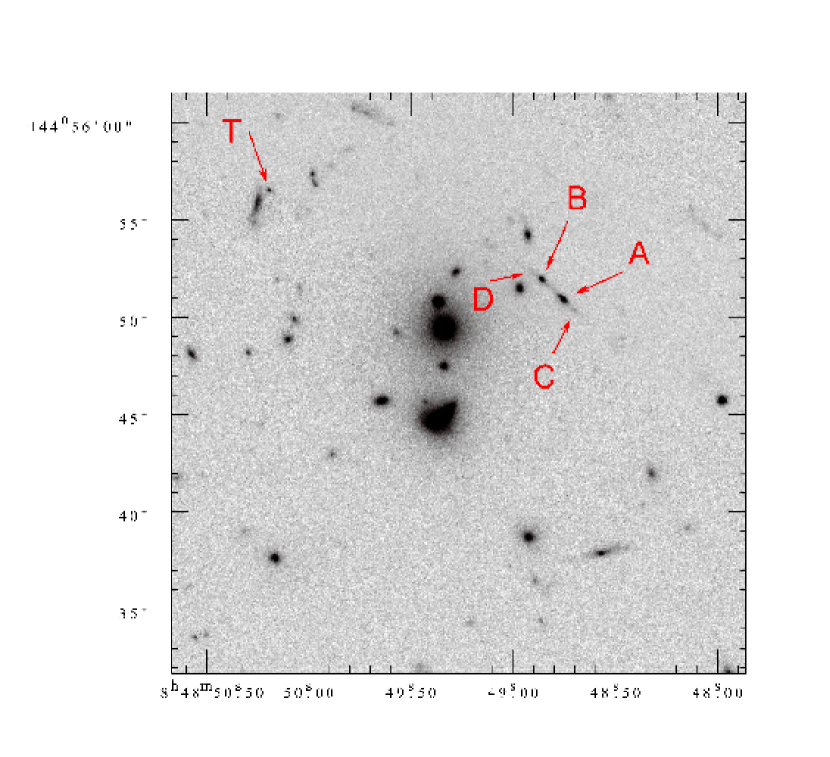
During a multiwavelength study of the cluster (catalog )() and its slightly lower redshift (0.543) companion, which we shall call CL J0848.84455, from the ROSAT Deep Cluster Survey, Holden et al. (2001) discovered a gravitational arc at 08h48m48s.76; 4455′49′′.6 (J2000). This shows an unusual narrow emission line spectrum identified with ultraviolet H, He, C, N and O lines at a redshift of . Using arguments based on photoionization modelling, these authors suggested that the emission arises from low metallicity gas ionized, at a high ionization parameter ( = photon/matter density), by a source with a blackbody temperature of between 80,000 and 100,000K. The color temperature of the ionizing source could be constrained with some confidence due to the dominant strength of the N IV] intercombination doublet over the N III] and N V lines in the observed wavelength range.
The two components of the arc and the extended, faint morphology suggest that the source lies along a fold caustic and so could be highly magnified. In this paper, we exploit the opportunity offered by this amplification to observe, in unprecedented detail, what appears to be a young, low metallicity star-forming region at an early epoch. In addition to the restframe UV spectra previously reported (Holden et al., 2001) we present new low and intermediate () resolution optical spectra and H- and K-band spectra taken with the Keck telescopes. Together, these spectra allow the measurement of almost all the emission lines expected to be reasonably strong from Ly to [O III]4959, 5007. The line strengths and profiles are used to study the physical, chemical and kinematic properties of the gas and the ionizing stars and make comparisons with lower redshift H II regions and starforming galaxies. HST and groundbased imaging data are used both for photometric calibration purposes and as a basis for the gravitational lensing model that allows us to estimate the magnification. This source, while at a somewhat lower redshift, may be similar in many respects to the very faint, high redshift Ly sources being found in the vicinity of clusters (Ellis, Santos, Kneib, & Kuijken, 2001; Hu et al., 2002) and in the field (Rhoads et al., 2003; Kodaira et al., 2003).
2 OBSERVATIONS
2.1 Imaging
Two sets of mosaics covering the cluster were obtained with the HST WFPC 2 (PI Rosati; proposal ID 7374) in filter F702W. The region containing the arc is within both sets of images and comprises a total exposure of 20 1200s (Holden et al., 2001). An additional 4800s of exposure in filter F814W (PI Elston; proposal ID 8269) were also examined.
All the images were retrieved from the ST-ECF archive and standard ‘on-the-fly’ pipeline processing performed using the latest calibration pipeline and reference files. The resultant calibrated single images were still dithered relative to each other, geometrically distorted and contained numerous cosmic rays. These frames were subsequently combined using the ‘metadrizzle’ script (Fruchter 2002, priv. comm.) which implements the scheme described in Fruchter & Hook (2002) to both detect and flag the cosmic rays and other defects and perform an optimum combination of the shifted frames using the ‘drizzle’ method. The other sets of images, taken at different times and hence having different pointings and orientations, were aligned using their image header world-coordinate information. Small final offsets to bring them into precise registration were determined from a study of objects in the overlap regions.
Given the short color baseline, the data from these two filters give little color information. The F702W data are shown in figure 1. Together, these filters are dominated by nebular continuum emission (see below) but also include several strong emission lines, notably N IV] 1483, 1486; C IV 1548, 1550; O III] 1661, 1666 and C III] 1907, 1909.
2.2 Spectroscopy
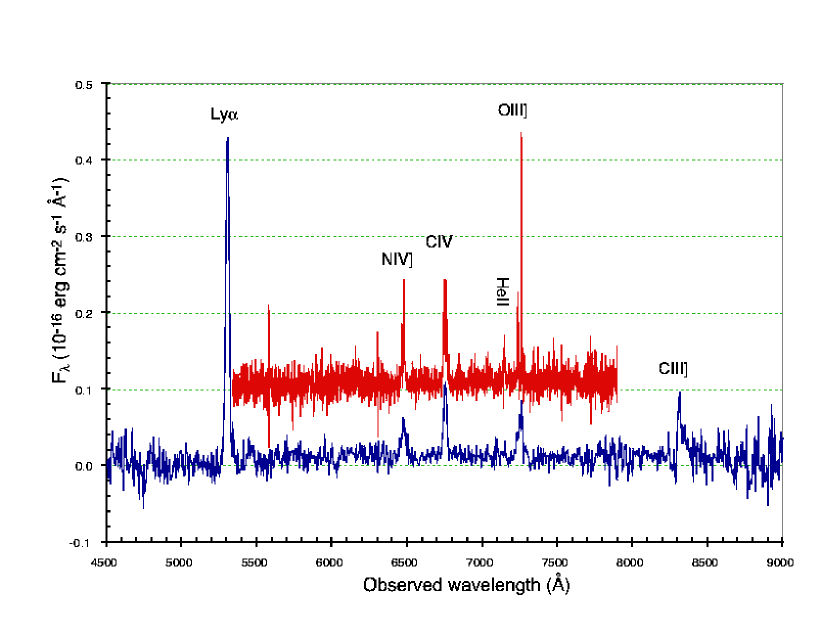
The log of spectroscopic observations is given in table 1. The first spectrum, obtained with the Keck I telescope using the Low Resolution Imaging Spectrograph, LRIS, (Oke et al., 1995) is described in Holden et al. (2001). This (LRISmed) used the 600 line mm-1 grating blazed at 7500Å and was taken from a multi-object mask with the slit lying along the arc, thus including both the A and B components. The second, lower resolution LRIS spectrum (LRISlow) was taken as part of the SPICES survey (Stern et al., 2002; Eisenhardt et al., 2003) and used the 150 line mm-1 grating blazed at 7500Å. The slit, again from a multi-object mask, was placed to include the brightest arc component (A). The spectra were reduced and the data extracted using standard scripts, optimised for LRIS, as described in (Holden et al., 2001). One-dimensional extractions are shown in figure 2.
| UT date | Instrument | -range | Dispersion | Slit/PA | Exposure |
|---|---|---|---|---|---|
| Å | km s-1/pixel | arcsec/deg | s | ||
| 2000 Feb 3 | LRIS | 45009000 | 55 | 5400 | |
| 2000 Dec 23 | LRIS | 53407900 | 220 | / 202.5 | 1800 |
| 2000 Mar 3 | ESI | 390011,000 | 11.4 | 3600 | |
| 2001 Nov 20 | NIRSPEC | H & K | 50 | 450450 |
Note. — The spectral resolution is typically the dispersion.
In order to measure the emission line profiles and doublet ratios, a higher resolution spectrum, with a resolving power of , was obtained with the Echellette Spectrograph and Imager (ESI; Epps & Miller (1998) on the Keck II telescope on the night of UT 2000 March 3. The slit was centred on the fainter of the two arc components (B in figure 1). These data were reduced and wavelength calibrated using the MAuna Kea Echelle Extraction (MAKEE) package developed by T. Barlow. The main steps that this package performs are (i) debias, (ii) fit order traces using the standard star image, (iii) flat-field, (iv) mask cosmic rays and bad pixels, (v) extract spectrum for each order and subtract night-sky spectrum, (vi) wavelength calibrate for vacuum wavelengths. Flux calibration was performed using observations of the standard star G191B2B, correcting for atmospheric extinction using the Mauna Kea extinction curve. ESI spectra of Ly and C IV are presented in section 3.2.
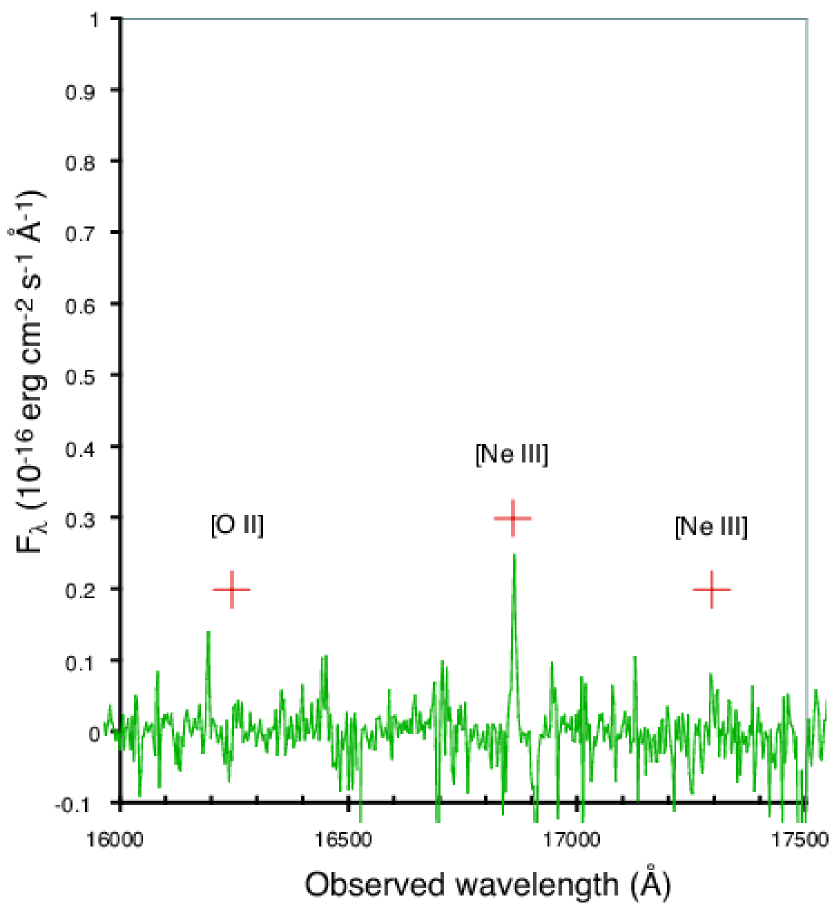
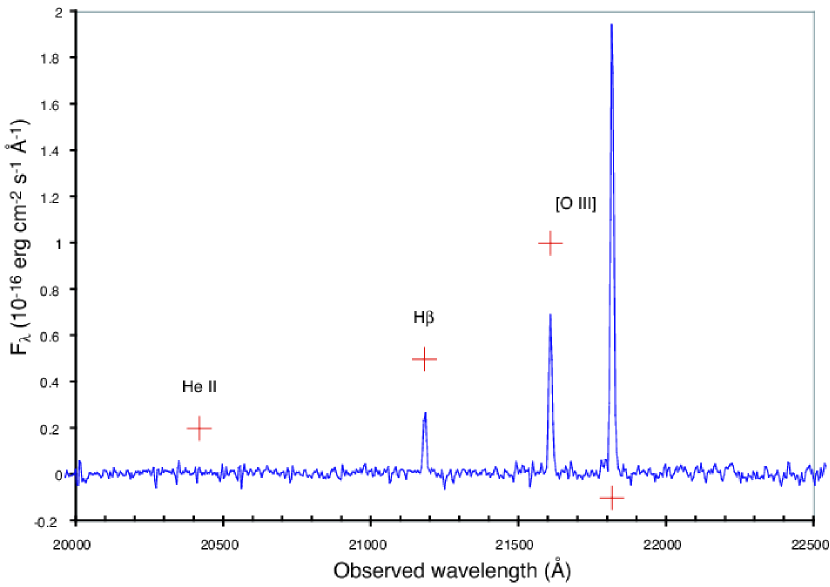
For measurements of the optical restframe spectrum, H and K band spectra were taken with the NIRSPEC instrument (McLean et al., 1998, 2000) during UK service time with the Keck II telescope on the night of UT 2001 November 20. The slit was arcsec in PA , aligned to include both the A & B components. The spectrograph was used in its grating mode, giving a resolving power . The exposures in both the H (Nirspec-5; 1.413–1.808m) and K (Nirspec-7; 1.839–2.630m) bands were 450s. The data were reduced and wavelength calibrated using IRAF and STARLINK programs, in the standard manner. The main steps in the reduction were (i) debias, (ii) remove cosmic rays and bad pixels, (iii) flat-field correction, (iv) geometric correction, (v) wavelength calibration, (vi) sky-subtraction. Flux calibration was performed using observations of the standard star HIP 45994 compared to the expected spectrum of an F5V star (K) with K. An aperture correction factor, determined by modelling light-loss due to a slit centred on a Gaussian seeing disc, was applied to the spectra. The H and K band regions containing the detected emission lines of [Ne III], H and [O III]4959, 5007 are shown in figures 3 and 4.
2.3 Photometry
Although the spectra were all taken in photometric conditions, the use of different slit widths and orientations means that photometric scaling factors must be applied in order to derive a consistent calibration. This was accomplished using the following procedure in order to derive an estimate of flux from the sum of the two components A+B whose flux ratio, from the WFPC 2 data, is measured to be A/B. It is assumed (Holden et al., 2001) that the spectra of A and B are congruent.
-
•
The LRISlow spectrum of component A was scaled to represent A+B and then corrected for slit losses by a factor of 1.8.
-
•
The LRISmed and the ESI spectra were then scaled such that the sum of the strong emission lines of N IV], C IV and O III] matched the same sum in LRISlow.
-
•
The emission line fluxes from the three spectra were averaged, using equal weights, to produce the mean optical fluxes in table 5.
-
•
The NIR spectra were only corrected for the estimated slit loss.
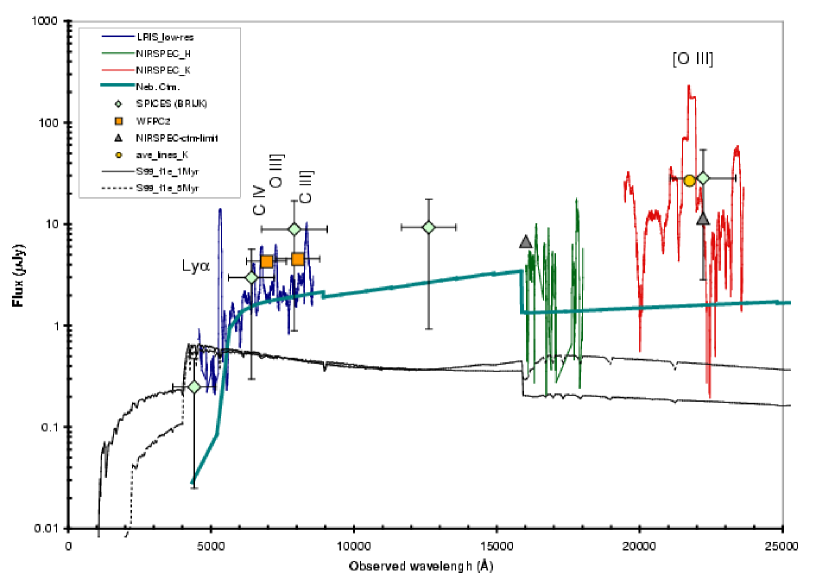
The overall photometric data are summarised in figure 5, where we plot both the imaging and the spectroscopy. Preliminary imaging photometry from the SPICES survey (Stern et al., 2002; Eisenhardt et al., 2003) is included but this could be contaminated by the two nearby galaxies seen in figure 1. The HST imaging photometry derived, using SExtractor magbest (Bertin & Arnouts, 1996), is given in table 2.
| Filter | A | B |
|---|---|---|
| F702W | 23.32 | 23.88 |
| F814W | 22.89: | 23.63 |
3 RESULTS
The arc in the southern cluster CL J0848.84455 is found at about from the brightest galaxy. The dominant cluster to the north, , (catalog ) has a much larger velocity dispersion — km s-1 versus km s-1— (Holden et al., 2001) and shows several arclets but no clear multiple image. Given the low velocity dispersion of the southern cluster, it is reasonable to assume that the northern one contributes significantly to the lensing of the object.
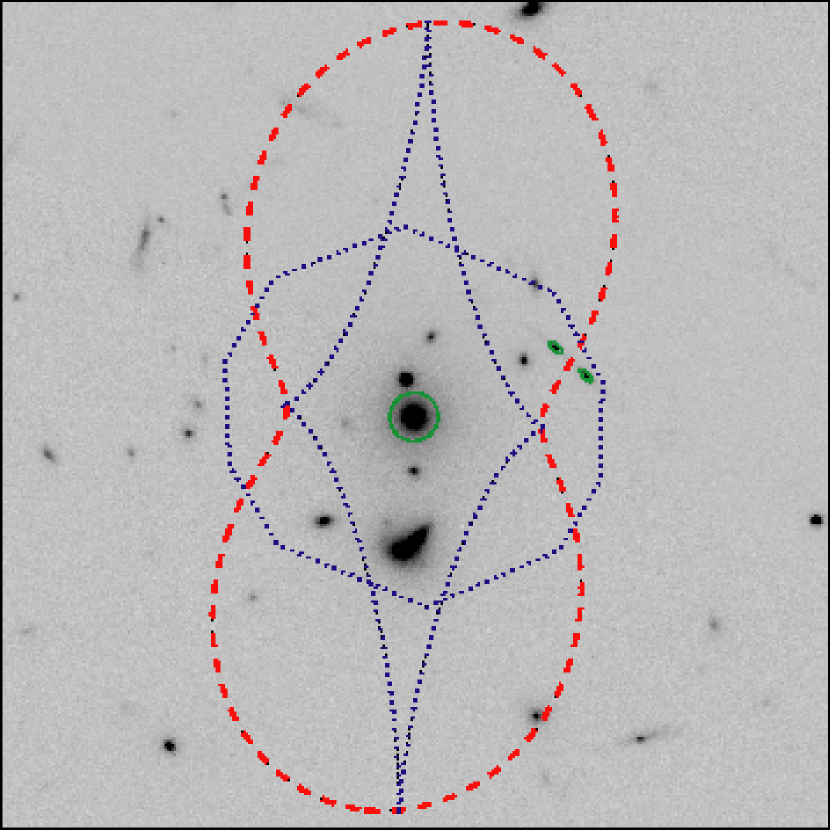
The lensed system is composed of two clumps (A and B in figure 1) joined by a very faint, thin arc which can be followed for more than on either side. This forms an angle of about to the tangent to the main cluster galaxy. Moreover, two extremely faint sub-clumps (C and D), possibly associated with the lensed galaxy, are observed on the arc, symmetrically disposed with respect to images A and B. The overall system shows a clear mirror symmetry, suggesting that the source lies close to a fold caustic. The two images A and B do not have an obvious counter-image, which argues that they are highly magnified. Indeed, the third unobserved image, in our situation, should be of ‘Type I’ (Schneider, Ehlers & Falco, 1992), and thus have a magnification (slightly) larger than unity.
In the restframe, our spectra extend from 1000Å to 5400Å with gaps from 2100–3500Å and from 4100–4500Å. There is a weak but clearly detected continuum in the ultraviolet, rising from Jy around Ly to Jy near C III]. This continuum is not, however, detected in the optical band from our NIR spectra: 3 continuum limits from NIRSPEC are 5Jy in H and 12Jy in the K band.
The emission spectrum is unusual in terms of the relative line intensities. In particular, the intercombination lines of N IV], C III] and O III] are very strong while forbidden [O II] is undetected and much weaker than [Ne III]. The absence of N V and the weakness of N III] suggests that the source of ionization is blackbody-like rather than a power-law extending to high energies. He II 1640 is detected but we do not see He II 4686 in our NIR data. The possibility that such an emission spectrum could arise by photoionization from a ‘filtered’ AGN continuum in the outer parts of an obscured quasar host galaxy is discussed by Binette et al. (2003). They consider mimicing a hot black-body by partially absorbing a power-law spectrum with high ionization parameter gas close to an AGN. Such an explanation is not pursued further in this paper.
A spectrum of this nature, and we have been able to find nothing that closely resembles it in the available UV spectral archives or the literature, suggests that we are dealing with a compact (high ionization parameter ) low density gaseous nebula, ionized by a hot (K) thermal source. The lines are narrow (FWHM100 km s-1) although Ly is broader and self-absorbed. C IV has a complex profile that also suggests absorption of the emission doublet. Our optical spectra show that the N IV], C IV and He II lines have broader, low intensity wings while the O III] exhibits a narrow base. The H and [O III] are unresolved in our spectra but they show no signs of a broad base.
3.1 Continuum
The restframe UV continuum rises longward of Ly and there is no evidence for an underlying blue stellar population unless it suffers significant reddening. Since the emission line equivalent widths are so large, we have calculated the expected nebular continuum, predominantly the hydrogen 2-photon emission in this spectral range, from the observed strength of H. The coefficients are from Aller (1984), assuming K, a temperature justified by the photoionization modelling presented in section 4.2. The calculated continuum is plotted in figure 5 and it is a reasonable fit to both the shape and level of the observed SED in the restframe UV, suggesting that the nebula is essentially reddening-free.
To gain some quantitative insight into the limits that can be placed on the nature of any underlying stellar population, we have plotted two fiducial synthetic SED on figure 5. These are from ‘STARBURST 99’ (Leitherer et al., 1999) and represent instantaneous burst models of with a Salpeter IMF with , an upper and lower mass cut-off of and respectively and a metallicity of . They include both the stellar and nebular continuua and their ages are one and five million years. The model luminosities have been scaled to observed fluxes from the redshift of the arc, using the cosmological model defined in section 4.3, and we have multiplied by a lens magnification factor of ten.
3.2 Line spectrum
Emission lines have been measured from the different spectra and averaged, using the procedure described above, to represent the sum of fluxes from components A and B. The results are presented in table 5 together with the velocity dispersions of the narrowest components fitted to the ESI data for the stronger lines.
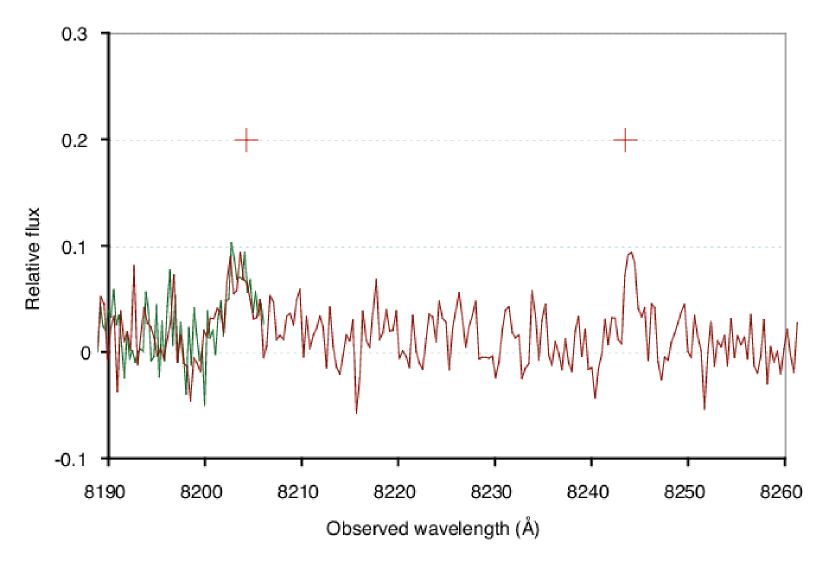
The Si III] doublet 1883, 1892 seen in the ESI spectrum merits some comment. It is underpredicted by all of our photoionization models using scaled solar abundances (see below) but the 1883Å line is seen in two ESI orders and, while close to the formal 3 detection limit, the 1892Å feature is at precisely the correct wavelength to be the second component of the doublet (see figure 6). We, therefore ascribe a high confidence level to the detection.
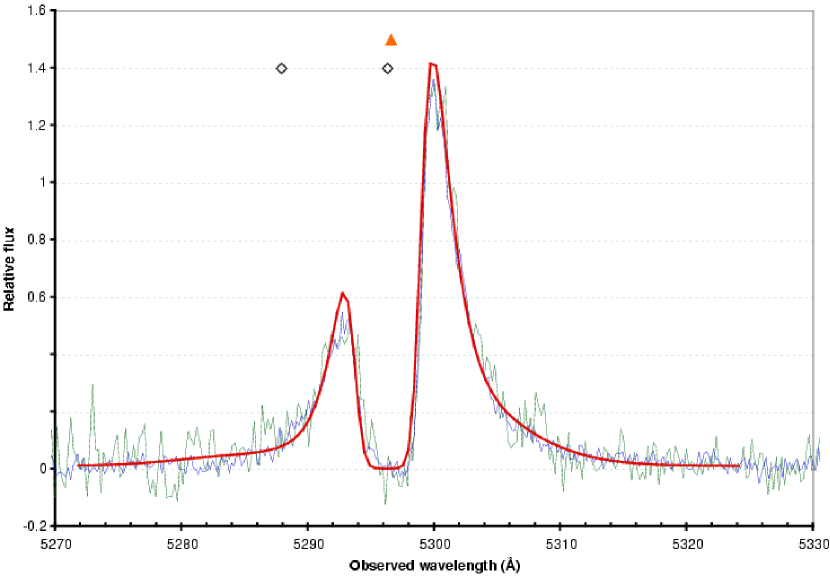
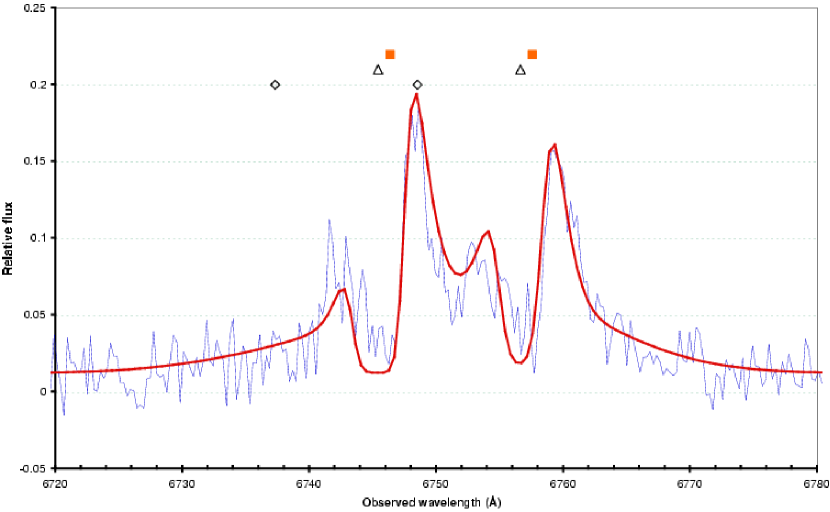
Both Ly and C IV are affected by absorption which we have modelled using pure Gaussian line emission and absorption coefficients. When fitting the ESI data, the model components are broadened in quadrature using an instrumental width derived from sky and arc lines and taking the form (Å) km s-1. The fit to Ly is shown in figure 7 and the parameters for the two emission and two absorption components are given in table 3. These four components are the minimum number required for a satisfactory fit and show the presence of an outflowing wind with a low velocity component at 15 km s-1 having an H I column density of cm-2. The C IV doublet is similarly modelled with each component having two emission and two absorption components (figure 8) with the doublet separation and oscillator strength ratio constrained to their theoretical values. These fit parameters also appear in table 3 together with the H0 and C3+ column densities derived from and . The C IV fit is less well constrained due to the lower s/n of the data for this weaker line. The value of is, however, required to be in order to match the steepness of the red edges of the absorption troughs. Note that for both Ly and for C IV, the two emission components have no relative velocity offset. The velocity offsets of the absorption components in the two species are not identical. Such an effect could result from an ionization gradient in the flow. The absorption correction factors for Ly and C IV used in table 5 are derived by setting the absorption optical depths equal to zero in these fits.
| Component | Intensity | N | |||
|---|---|---|---|---|---|
| km s-1 | km s-1 | normalised | 1015 cm-2 | ||
| Ly | |||||
| e1 | 0 | 150 | 0.71 | ||
| e2 | 0 | 400 | 0.29 | ||
| a1 | 15 | 63 | 9 | 1.05 | |
| a2 | 490 | 270 | 1.2 | 0.60 | |
| C IV | |||||
| e1 | 0 | 80 | 0.43 | ||
| e2 | 0 | 350 | 0.24 | ||
| a1 | 40 | 35 | 7.5 | 0.83 | |
| a2 | 400 | 400 | 0.8 | 1.02 |
Note. — For C IV, the emission doublet is assumed to have an optically thin 2:1 ( 1548:1551) intensity ratio: the fitted parameters and normalised intensities refer to the stronger line (1548Å). For the absorption, it is the line absorption coefficients that have the 2:1 ratio.
4 DISCUSSION
In section 4.1, the lens modelling is discussed with the principal aim of computing the magnification that will allow the estimation of the true observed brightness of the source. Using a grid of photoionization models in conjunction with the observed emission line ratios, we discuss in section 4.2 the nature of the source: physical conditions, nebular element abundances and the characteristics of the ionizing source. The absorption components seen in Ly and in C IV allow us to deduce some properties of the wind for comparison with low-redshift H II galaxies. Finally, in section 4.3 we compare the observed line luminosity, using a current ‘standard’ cosmology, with the value prediced from the calibration of local H II regions/galaxies from Melnick, Terlevich & Terlevich (1999).
4.1 Lensing analysis
The primary goal of the lensing analysis in this study is to constrain the magnification of the lens. The modeling has been carried out using two guiding principles. Firstly, we note that the system is intrinsically complex because of the cluster environment. Hence, an accurate description of the mass distribution should include several components, corresponding to the main galaxies that are contributing to the lensing signal. Secondly, the number of constraints available from the observed images is rather small. In particular, using the observed positions, ellipticities and fluxes of the two main images (A & B) we have 5 free parameters for the lensing model.111In fact, we have 5 parameters for each image (2 from the position, 1 from the luminosity, and 2 from the ellipticity of the image), but we have also to use 5 parameters to describe the source. Note that, because of the conservation of the surface brightness in lensing, using the size of the source would not gain us any additional information.
These two competing facts put strong constraints on the families of models we can use. With only two images, we cannot use more than 5 parameters; on the other hand, since the system is complex, we need to take into account the effects of the several masses that might contribute to the lensing. A standard method, which we adopt here, is to model the collective effect of nearby galaxies as an external shear (see, e.g., Keeton, Kochanek, & Seljak, 1997). More formally, it can be shown that, within a given region of sky, the gravitational lensing effect of external masses can be described using a multipole expansion (see Schneider & Bartelmann 1997). In this framework, the external shear represents a quadrupole term, this being the first observable multipole. We also stress that in many strong lensing studies the external shear is required for a good fit seems to be larger than one would expect by considering the influence of the nearby masses (see, e.g., Witt & Mao, 1997).
A simple quantitative analysis can be used to better understand the lens. Assuming that the system is symmetric and that no external field is acting upon it, we can obtain a first estimate of the mass inside the Einstein radius of the system. The definition of the Einstein radius is in our case rather arbitrary since, as mentioned above, the apparent centre of the arc is far away from the centre of the brightest galaxy in CL J0848.84455 (the centre of figure 9). In any case, assuming an Einstein radius of about (i.e., the observed angular distance between the arc and the brightest cluster galaxy), we obtain a projected velocity dispersion for the lens of about 550 km s-1. This is likely to be too high for a single galaxy and too small when compared with the velocity dispersion of the cluster. Hence, this suggests that the lens system can be explained only if we take into account both the strong gravitational field of the central galaxy and the external tidal field of the cluster. Notice that the detailed lens modeling presented below is independent of the simple analysis discussed here.
Mao & Schneider (1998) have discussed in detail the impact of substructures on the lens models. They note how, in several cases, simple lensing models are able to account for the observed configurations but fail to reproduce the observed fluxes ratios between the various images. The conclusion is that small-scale substructure could play a significant role. The effect of substructures is particularly important in highly-magnified images where even a small change in the local density (for example, due to a compact object such as a globular cluster) can have large effects on the observed fluxes; more recent studies reach the same conclusion (see, e.g., Bradač et al., 2002 and references therein).
We have modeled the lens as a single elliptical profile, centred on the dominant cluster galaxy (figure 9). Contributions from other galaxies have been represented by an external shear. The mass profile of the lens was taken to be a pseudo-isothermal profile (see, e.g., Keeton & Kochanek, 1998 with velocity dispersion , core radius , and truncation radius . More specifically, the surface mass density of the lens (i.e., the mass density projected along the line of sight) is taken to be
| (1) |
where is the elliptical coordinate for an ellipse of axis :
| (2) |
Note that we used a model with an elliptical mass distribution rather than an unphysical elliptical potential (see Kassiola & Kovner, 1993 for a discussion on this point). This mass distribution is characterized by a total mass (in the limit of small ellipticities, )
| (3) |
The lens parameters were obtained by fitting the predicted image positions, fluxes and ellipticities to the observed data. The fitting procedure was carried out first on the source plane (Kayser et al., 1990). Given a lens model, the observed positions of each image were projected onto the source plane and compared to each other. In our analysis, we extended this technique to include the observed fluxes and ellipticities. The final fit was then carried out by inverting the lens equation and fitting directly the observed quantities on the lens plane. The lens inversion was performed using a technique similar to the one described by Keeton (2001). The final minimization was done using a simulated annealing algorithm (Kirkpatrick et al., 1983; Kirkpatrick, 1984). This method, which is based on an analogy with a thermodynamic process (the formation of crystals as a liquid slowly freeze), has proved to be very effective in dealing with minimization of functions in high-dimension spaces, when the presence of local minima can create severe problems to standards algorithms (see, e.g., Press et al., 1992). In the following we briefly present the final results of the lensing analysis.
| Parameter | Model 1 | Model 2 | Model 3 | Model 4 |
|---|---|---|---|---|
| Lens ellipticity | ||||
| Position angle [degrees] | ||||
| Vel. disp. [] | ||||
| External shear | ||||
| External shear | ||||
| Total | ||||
| Degrees of freedom | 2 | 4 | 6 | 7 |
| Magnifications |
For each lens model the fitting algorithm was run several times in order to check the reliability of the results obtained. Indeed, the minimization procedure, based on a simulated annealing method, has an external parameter, the ‘temperature’ of the system, that needs to be carefully tuned (see Press et al., 1992 for a brief discussion on the simulated annealing algorithm). For example, a low temperature can prevent the algorithm from finding the global minimum of the function.
In order to better understand the degeneracies of the system, we tried several models. In almost all cases, we were able to reproduce the observed positions, fluxes and ellipticities of the images with good accuracy (see table 4). Clearly, we do not claim that all the models are an accurate description of the system. Rather, we provide a number of models that give good fits to the data in order to show the possible range of magnifications for the system. All models require a very large external shear. Interestingly, the external shear of many models (see in particular models 1, 2, and 4 in table 4) is approximately aligned with the direction of the Northern cluster. Assuming a velocity dispersion of km s-1(Holden et al., 2001), we find that about one half of the external shear required by our models can be simply explained by this cluster; the remaining external shear is probably due to other galaxies in CL J0848.84455.
The simplest model tried on the system is a singular isothermal elliptical lens (SIE) centred on the main cluster galaxy in CL J0848.84455 with an additional external shear (model 1 in table 4) This model is characterized by five free parameters: the lens velocity dispersion , ellipticity , position angle and the two components of the external shear, and . Although the model is very simple, the final fit is very good; the only significant residuals come from the fit to the flux (which contributes to the total of ). The best model has a round lens and a rather large external shear. This produces a faint third image (about 10 times fainter than image A) which would be difficult to detect in our data. Figure 9 shows the best fit configuration.
In order to reduce the external shear, we tried to add a significant ‘penalty’ on the for large external shears (model 2). This, however, did not reduce significantly the shear and produced larger errors on the fluxes. Interestingly, because of the well known degeneracy between the external shear and the lens ellipticity (see, e.g., Keeton, Kochanek, & Seljak, 1997), the final fit obtained was qualitatively different from model 1.
The inclusion of 4 more images (see figure 1) in the fitting algorithm led to model 3. These extra images include the mirror-symmetric components C and D as well as fainter substructure within A and B. The best solution has a low , a very faint third image but a large lens ellipticity and external shear.
In model 4, we tried to use a candidate third image labelled T in figure 1. This object, from groundbased observations (Stern et al., 2002; Eisenhardt et al., 2003), is found to have a color consistent with our source and is in a good position to be a candidate third image. In all models obtained in this configuration, further images are either not present or extremely faint. The best fit model shows significant scatter on the fluxes and on the ellipticities and thus has a large .
Finally, we also tried to relax the position of the lensing galaxy around the observed position; this, however, never significantly improved the fit.
In summary, we find a relatively wide range of models that successfully describe the system. The total magnification for the images AB in our models span the range –. Hence, although the present study is not able to completely constrain the system, there are indications that the source could be strongly magnified by the lens. The class of acceptable models would be narrowed should a third image be found. For the following discussion, we should be aware that, by being so close to a caustic, some part of the source may be more highly magnified than the average. This could affect the interpretation of line ratios and widths in terms of spatially-averaged models.
4.2 Photoionization modelling
Photoionization modelling is carried out using the mappings ic code (Ferruit et al., 1997). For the exploration of the spectrum discussed in this paper, we have assumed that the gas is ionized by a pure black body. In effect, the stellar cluster is replaced by a single ionizing star with a temperature (Evans & Dopita, 1985), based on the notion that the ionizing spectrum is not strongly dependent on the slope of the IMF. This is a reasonable approximation in stellar clusters since the number of ionizing photons increases so rapidly with the temperature of the hottest stars (Searle, 1971). The acceptability of the black body approximation as a representation of the real SED of a massive star is, of course, strongly dependent on the stellar metallicity although for metal-free stars (Bromm, Kudritzki, & Loeb, 2001) they are very similar.
Deducing the true nature of the ionizing stellar cluster from the nebular emission alone is difficult. There are, however, several important clues that indicate the presence of massive, luminous and probably very low metallicity stars. These are:
-
•
The color temperature of the ionizing source is much higher than seen in H II regions in the local universe. The ionizing flux in typical Galactic compact H II regions are typically characterized by stellar model effective temperatures 40,000K (Lumsden et al., 2003) which correspond to somewhat lower color temperatures.
-
•
The ionization parameter, is also higher than seen in local H II regions.
-
•
The nebula emits He II 1640.
-
•
No stellar continuum is observed between Ly and the visible spectrum.
-
•
The cluster has a very high ionizing photon luminosity yet the nebular lines are narrow, indicating a low gravitating mass (see section 4.3).
While these observations do not uniquely diagnose the presence of Population III stars, they are all qualitatively consistent with the predictions of the models of such stars and their surrounding nebulæ. In particular, the question of the actual time-averaged ionizing properties of system containing massive Population III stars, including the effects of evolution away from the ZAMS and assumptions regarding the IMF are addressed by Schaerer (2002).
The C III] emission line ratio indicates that the ionized gas density is at or below the low density limit for this doublet ( cm-3, Osterbrock, 1989). In our models, we assume cm-3, ensuring that there are no significant collisional de-excitation effects. An increase in density would result merely in a decrease in the ionization parameter . Our models are isobaric which means that we set the density at the illuminated face of the cloud and it increases with depth to keep the pressure constant.
We have assumed a plane-parallel geometry, modelling the emission from a single ‘cloud’ ionized by a central cluster of stars. The output spectrum can be considered as the integrated emission from many clouds distributed spherically around the ionizing source. In dust-free models, different geometries will be represented by different effective values of the ionization parameter . In the presence of dust, however, the geometry will determine the photon escape probabilities and so will have a much stronger effect on line ratios, especially those involving Ly and C IV. Since models of low redshift H II regions generally employ a spherical geometry, it should be noted that our values of are not directly comparable.
Our photoionization models explore a parameter space consisting of the ionizing source black body temperature , the ionization parameter and the gas metallicity . The metallicity has been scaled in proportion to the relative solar abundances (Anders & Grevesse, 1989) and assumes no depletion onto dust. Such a representation of the element abundance distribution is probably quite inappropriate for a source at this epoch but we do not explore this part of the parameter space in this paper. Our objective is to find a ‘fiducial’ model that represents the general nature of the emission line spectrum and to discuss how departures from it might be addressed.
The color temperature of the photoionizing source is relatively well-determined by the nitrogen spectrum. The dominance of N IV] over both N V and N III] restricts to K. Such an ionizing SED would dominate the continuum spectrum shortward of Ly but, in our observed spectral range, would be much weaker than the nebular continuum. This is consistent with the result presented in figure 5 — see also: Panagia, Stiavelli, Ferguson, & Stockman (2002).
There are two line ratios that are sensitive to metallicity but essentially independent of stellar temperature and only weakly dependent on : He II/C IV and [O III]/H. The observed ratios both exclude very low metallicities () which would result in very strong H and He lines relative to C IV and [O III]. Similarly, is excluded by the observed value of [O III]/H in this regime where oxygen is not the dominant coolant and the ratio depends directly on metallicity. Consequently, we assume a gas-phase metallicity of with an uncertainty of about a factor of two. The line spectrum in general is best reproduced with a high ionization parameter, . Such a high value of distinguishes the spectrum from that of a planetary nebula which can have a similar stellar color temperature. The line spectrum produced by this fiducial model (K, , ) is presented in table 5.
Photoionization models with these parameters always predict weak Si III] lines: our fiducial model implies a Si/C ratio approximately forty times larger than the solar ratio. This problem can be alleviated by decreasing the ionization parameter but at the cost of essentially eliminating the N IV], O III] and C IV lines. Similarly, decreasing will strengthen Si III] but weaken the high ionization lines. The minimum Si/C ratio we can obtain by decreasing to 60,000K is around five in solar units. This quantitative conclusion should be treated with some caution due to the simplicity of our photoionization model, e.g., the use of a black body SED in place of a real stellar continuum.
4.3 The ionizing source
The rate of ionizing photon production needed to power the arc can be estimated from the de-magnified H flux. Using a cosmology with km s-1 Mpc-1; and with the source redshift of , we compute a luminosity distance of Mpc. The (hydrogen) ionizing photon luminosity is then given by:
| (4) |
where is the lens magnification and the and are respectively the total and effective H case B hydrogen recombination coefficients for K (Osterbrock, 1989). Using and from table 5, we get ph s-1, assuming a nebular covering factor of unity.
This number can be used to constrain the nature of the ionizing stellar population. The number of massive stars needed to provide this photon flux depends in detail on the cluster IMF and on the stellar metallicity. The stellar color temperature we deduce from the emission line spectrum is very high and argues for a low stellar metallicity, possibly much lower than the nebular metallicity which may be affected by stellar winds and earlier supernova explosions. Using the Population III stellar models given by Schaerer (2002), the appropriate range for lies between about 49 and 50, indicating that we are dealing with up to 106 massive stars.
The observed SED can also place constraints on the stellar population subject to uncertainties in the extinction to the stellar cluster. Figure 5 includes STARBURST 99 models (see section 3.1) that illustrate the level and shape of the SED expected for a very young cluster of with a normal Salpeter IMF lensed by the cluster of galaxies. An unreddened cluster of this mass would be marginally detected in our optical data but would only produce a ph s-1, a factor of twenty below the estimated requirement.
The modest value of the velocity dispersion measured for the O III] and the C III] lines of km s-1 places an effective limit on the gravitating mass within the line emitting region. If we use the calibration of the relation for H II galaxies by Melnick, Terlevich & Terlevich (1999)
| (5) |
we predict the intrinsic H luminosity to be for the nebular oxygen abundance of that is implied by our photoionization models. This is about 150 times smaller than the observed value of 43.63 and is inconsistent with our estimate of the lensing magnification of only .
There are many uncertainties in this argument, not least the extreme extrapolation of the relation to low metallicity. A crucial issue may be the nature of the metallicty term in this relation whose value was determined empirically by Melnick, Terlevich, & Moles (1988) for local H II regions and galaxies. The physics of the metallicity dependence is to do with the luminosities of the ionizing stars () rather than the chemical composition of the surrounding nebula. It is the metallicity of the stars that determines their IMF and mass-to-light ratio and, at early epochs as we have noted above, this may be considerably lower than the wind and supernova-polluted surroundings. Whatever the solution of this discrepancy turns out to be, there is a strong indication that the Lynx arc has a very low mass-to-light ratio implying an IMF dominated by massive stars.
Emission line velocity widths and characteristic sizes for faint sources with 0.19 to 0.35 were measured by Guzman et al. (1996) who found Gaussian velocity dispersions of 30 to 50 km s-1 and inferred masses of . For a higher redshift sample of luminous, compact, blue galaxies with 0.4 to 1.2, Guzmán et al. (2003) used multi-broad-band photometry to deduce stellar masses with a median value of , a factor of about two lower than previous virial estimates. They concluded that compact blue galaxies at intermediate redshifts are about an order of magnitude less massive than typical galaxies today.
Another lensed galaxy seen at high redshift and studied in detail is MS 1512-cB58 with (Ellingson, Yee, Bechtold, & Elston, 1996; Pettini et al., 2000; Teplitz et al., 2000). This is an Lyman-break galaxy with a clearly measured stellar SED characterized by a continuous star formation model with a Salpeter IMF, an age of about 20 Myr and a virial mass of . This has a metallicity of about 1/4 , a few times higher than typical damped Ly systems at the same redshift. In comparison, the Lynx arc is much younger, has a considerably lower metallicity and is less massive. The intrinsic, unlensed H luminosity of MS 1512-cB58 is some five times lower than that of the Lynx arc and it does not exhibit the strong ultraviolet emission spectrum which results from the latter’s very hot ionizing stars.
5 CONCLUSIONS
The Lynx arc was discovered during the spectroscopic follow-up of the ROSAT Deep Cluster Survey. The fortuitous location of an H II galaxy near a fold caustic in the source plane of a complex cluster environment at a redshift of a half has given us the opportunity to study the properties of an intrinsically luminous starforming region is some detail at a redshift of 3.357.
From observations of the emission line spectrum from Ly to [O III] we show that the H II region is characterized by very hot ionizing stars with a temperature of K and a high ionization parameter of . While the nebular metallicity is not dramatically low, with , there is indirect evidence that the ionizing stellar cluster is considerably more metal-poor. The low velocity dispersion of the nebula and the high luminosity imply a very low mass-to-light ratio for the part of the H II galaxy that is strongly magnified. This conclusion is supported by the absence of any detectable stellar continuum in the spectrum longward of Ly: the observed flux in the restframe UV being satisfactorily explained as pure nebular continuum with no dust reddening. An unreddened young stellar cluster of with a normal IMF would be detected in our data.
The outflowing wind seen as absorption components in both Ly and C IV is highly ionized, having similar column densities of cm-2 in both H0 and in C3+. This is in contrast to local H II galaxies which typically have H0 column densities closer to cm-2 (Kunth et al., 1998).
From our photoionization modelling of the nebula, using scaled solar abundances, the most outstanding discrepancy amongst the observed and predicted emission line intensities is the Si III] doublet at 1883, 1892. The substantial overabundance of silicon suggested by this observation may be a nucleosynthetic signature of past pair instability supernovæ in a Population III cluster (Heger & Woosley, 2002). These supernovæ result in the total disruption of stars in the mass range and produce an excess of elements with odd nuclear charge relative to the even nuclei.
It appears that we are witnessing a very early phase of star formation in a dwarf galaxy which initially had sufficiently low metallicity to allow the formation of many high mass stars producing an effective ionizing color temperature much higher than found in such objects in the local universe. The magnification-corrected ionizing luminosity of ph s-1 implies the presence of some 106 hot O stars, while the low gas velocity dispersion and the absence of any detected stellar continuum longward of Ly demands a low mass-to-light ratio. The nebula has a high ionization parameter and there is an outflowing wind, ranging in velocity from to km s-1, which is much more highly ionized than winds in local H II galaxies.
We are fortunate to have found such an object lensed by an intervening cluster of galaxies. Its intrinsic luminosity is, however, sufficiently high that astrophysically meaningful observations could be obtained of similar objects that are unmagnified. The Lynx arc represents a galaxy that is considerably less massive than a typical Lyman break galaxy at a similar redshift (Pettini et al., 2001) but one that is in a very short-lived luminous phase lasting as little as a few million years and powered by a top-heavy IMF containing many stars with temperatures approaching K.
References
- Aller (1984) Aller, L. H., 1984, Astrophys. Space Science Lib., 112
- Anders & Grevesse (1989) Anders, E. & Grevesse, N. 1989, Geochim. Cosmochim. Acta, 53, 197
- Bertin & Arnouts (1996) Bertin, E. & Arnouts, S. 1996, A&AS, 117, 393
- Binette et al. (2003) Binette, L., Groves, B., Villar-Martín, Fosbury, R. A. E. & Axon, D. 2003, A&A, in press
- Bradač et al. (2002) Bradač, M., Schneider, P., Steinmetz, M., Lombardi, M., King, L. J., & Porcas, R. 2002, A&A, 388, 373
- Bromm, Kudritzki, & Loeb (2001) Bromm, V., Kudritzki, R. P., & Loeb, A. 2001, ApJ, 552, 464
- Eisenhardt et al. (2003) Eisenhardt, P., Elston, R., Stanford, S. A., Stern, D., Wu, K. L., Connolly, A., & Spinrad,H. 200, AJ, in prep.
- Ellingson, Yee, Bechtold, & Elston (1996) Ellingson, E., Yee, H. K. C., Bechtold, J., & Elston, R. 1996, ApJ, 466, L71
- Ellis, Santos, Kneib, & Kuijken (2001) Ellis, R., Santos, M. R., Kneib, J., & Kuijken, K. 2001, ApJ, 560, L119
- Epps & Miller (1998) Epps, H. W. & Miller, J. S. 1998, Proc. SPIE, 3355, 48
- Evans & Dopita (1985) Evans, I. N. & Dopita, M. A. 1985, ApJS, 58, 125
- Ferruit et al. (1997) Ferruit, P., Binette, L., Sutherland, R. S., & Pécontal, E. 1997, A&A, 322, 73
- Fruchter & Hook (2002) Fruchter, A. S. & Hook, R. N. 2002, PASP, 114, 144
- Guzman et al. (1996) Guzman, R., Koo, D. C., Faber, S. M., Illingworth, G. D., Takamiya, M., Kron, R. G., & Bershady, M. A. 1996, ApJ, 460, L5
- Guzmán et al. (2003) Guzmán, R., Östlin, G., Kunth, D., Bershady, M. A., Koo, D. C., & Pahre, M. A. 2003, ApJ, 586, L45
- Heger & Woosley (2002) Heger, A. & Woosley, S. E. 2002, ApJ, 567, 532
- Holden et al. (2001) Holden, B. P. et al. 2001, AJ, 122, 629
- Hu et al. (2002) Hu, E. M., Cowie, L. L., McMahon, R. G., Capak, P., Iwamuro, F., Kneib, J.-P., Maihara, T., & Motohara, K. 2002, ApJ, 568, L75
- Kassiola & Kovner (1993) Kassiola, A. & Kovner, I. 1993, ApJ, 417, 450
- Kayser et al. (1990) Kayser, R., Surdej, J., Condon, J. J., Kellermann, K. I., Magain, P., Remy, M., & Smette, A. 1990, ApJ, 364, 15
- Keeton & Kochanek (1998) Keeton, C. R. & Kochanek, C. S. 1998, ApJ, 495, 157
- Keeton, Kochanek, & Seljak (1997) Keeton, C. R., Kochanek, C. S., & Seljak, U. 1997, ApJ, 482, 604
- Keeton (2001) Keeton, C. R. Computational methods for gravitational lensing, 2001. Preprint (astro-ph/0102340)
- Kirkpatrick et al. (1983) Kirkpatrick, S., Gelatt, C.D., & Vecchi, M.P. 1983, Science 220, 671
- Kirkpatrick (1984) Kirkpatrick, S. 1984, Journal of Statistical Pysics 34, 975
- Kodaira et al. (2003) Kodaira, K. et al. 2003, PASJ Lett., 55, vol.2, in press (astro-ph/0301096)
- Kunth et al. (1998) Kunth, D., Mas-Hesse, J. M., Terlevich, E., Terlevich, R., Lequeux, J., & Fall, S. M. 1998, A&A, 334, 11
- Leitherer et al. (1999) Leitherer, C. et al. 1999, ApJS, 123, 3
- Lumsden et al. (2003) Lumsden, S. L., Puxley, P. J., Hoare, M. G., Moore, T. J. T., & Ridge, N. A. 2003, MNRAS, 340, 799
- Mao & Schneider (1998) Mao, S. & Schneider, P. 1998, MNRAS, 295, 587
- McLean et al. (1998) McLean, I. S. et al. 1998, Proc. SPIE, 3354, 566
- McLean et al. (2000) McLean, I. S., Graham, J. R., Becklin, E. E., Figer, D. F., Larkin, J. E., Levenson, N. A., & Teplitz, H. I. 2000, Proc. SPIE, 4008, 1048
- Melnick, Terlevich, & Moles (1988) Melnick, J., Terlevich, R., & Moles, M. 1988, MNRAS, 235, 297
- Melnick, Terlevich & Terlevich (1999) Melnick, J. Terlevich, R. & Terlevich, E., 1999, MNRAS, 311, 629
- Oke et al. (1995) Oke, J. B. et al. 1995, PASP, 107, 375
- Osterbrock (1989) Osterbrock, D. E., 1989, “Astrophysics of gaseous nebulae and active galactic nuclei”, Mill Valley: University Science Books
- Panagia, Stiavelli, Ferguson, & Stockman (2002) Panagia, N., Stiavelli, M., Ferguson, H. C., & Stockman, H. S. 2002, Galaxy evolution, theory and observations, (astro-ph/0209346)
- Pettini et al. (2000) Pettini, M., Steidel, C. C., Adelberger, K. L., Dickinson, M., & Giavalisco, M. 2000, ApJ, 528, 96
- Pettini et al. (2001) Pettini, M., Shapley, A. E., Steidel, C. C., Cuby, J., Dickinson, M., Moorwood, A. F. M., Adelberger, K. L., & Giavalisco, M. 2001, ApJ, 554, 981
- Press et al. (1992) Press, W.H., Teukolsky, S.A., Vetterling, W.T., & Flannery, B.P. 1992, “Numerical Recipes in C”, Cambridge University Press, Cambridge
- Rhoads et al. (2003) Rhoads, J. E. et al. 2003,AJ, 125, 1006
- Schaerer (2002) Schaerer, D. 2002, A&A, 382, 28
- Schneider & Bartelmann (1997) Schneider, P. & Bartelmann, M. 1997, MNRAS, 286, 696
- Schneider, Ehlers & Falco (1992) Schneider, P., Ehlers, J., & Falco, E. 1992, Gravitational lenses, Springer-Verlag, Berlin
- Searle (1971) Searle, L. 1971, ApJ, 168, 327
- Stern et al. (2002) Stern, D. et al. 2002, AJ, 123, 2223
- Teplitz et al. (2000) Teplitz, H. I. et al. 2000, ApJ, 533, L65
- Witt & Mao (1997) Witt, H. J. & Mao, S. 1997, MNRAS, 291, 211
| Line | |||||
|---|---|---|---|---|---|
| Å | erg cm-2 s-1 | obs | model | km s-1 | |
| O VI | 1035 | 0.0002 | |||
| Ly | 1215 | 11.2 | 3.11 | ||
| Lycorr | 38.9 | 10.8 | 28.2 | 150 | |
| N V | 1240 | 0.32 | 0.09 | 0.02 | |
| Si IV | 1397 | 0.32 | 0.09 | 0.05 | |
| N IV] | 1483 | 0.62 | 0.17 | ||
| N IV] | 1487 | 0.88 | 0.25 | 0.38 | |
| C IV | 1548+51 | 2.32 | 0.64 | ||
| C IVcorr | 13.15 | 3.65 | 7.11 | 80 | |
| He II | 1640 | 0.38 | 0.11 | 0.25 | |
| O III] | 1661 | 0.66 | 0.18 | ||
| O III] | 1666 | 1.36 | 0.38 | 0.94 | 35 |
| N III] | 1750 | 0.64 | 0.18 | 0.05 | |
| Si III] | 1883 | 0.32 | 0.09 | 0.0021 | |
| Si III] | 1892 | 0.21 | 0.06 | 0.0016 | |
| C III] | 1907 | 1.26 | 0.35 | 1.6 | 30 |
| C III] | 1909 | 0.87 | 0.24 | ||
| C II | 2326 | 0.003 | |||
| [Ne IV] | 2424 | 0.06 | |||
| Mg II | 2800 | 0.02 | |||
| [O II] | 3728 | 0.9 | 0.25 | 0.02 | |
| [Ne III] | 3869 | 2.50 | 0.69 | 0.69 | |
| [Ne III] | 3969 | 0.8 | 0.22 | 0.20 | |
| [O III] | 4363 | 0.28 | |||
| He II | 4686 | 0.8 | 0.22 | 0.03 | |
| H | 4861 | 3.60 | 1.00 | 1.00 | |
| [O III] | 4959 | 9.30 | 2.58 | ||
| [O III] | 5007 | 27.00 | 7.50 | 7.91 | |
| He I | 5876 | 0.09 | |||
| [O I] | 6300 | 0.0005 | |||
| H | 6563 | 2.95 | |||
| [N II] | 6583 | 0.003 | |||
| [S II] | 6731 | 0.0007 |
Note. — The second entries for Ly and for C IV are values corrected for absorption. The rule below C III] represents the division between optical and NIR spectroscopy. Above this line, the statistical flux errors () are approximately erg cm-2 s-1; below the line, they are approximately erg cm-2 s-1. Model intensities computed for multiplets, where shown as a single number, represent the sum of the components. It should be remembered that our data only extend to a restframe wavelength of 5400Å.