Some implications of the introduction of scattered starlight in the spectrum of reddened stars.
Abstract
This paper presents new investigations on coherent scattering in the forward direction (orders of magnitude; conservation of energy; dependence of scattered light on geometry and wavelength), and on how scattered light contamination in the spectrum of reddened stars is possibly related to as yet unexplained observations (the diminution of the bump when the obscuring material is close to the star, the difference between Hipparcos and photometric distances). This paper then goes on to discuss the fit of the extinction curve, a possible role of extinction by the gas in the far-UV, and the reasons of the inadequacy of the Fitzpatrick & Massa (1990) fit.
keywords:
ISM: Dust, extinctionPACS:
98.38.j , 98.38.Cp, 98.58.Ca1 Introduction
When, in the past, observations were limited to the visible spectrum, interstellar extinction could be understood by the presence of large (compared to the wavelength) forward scattering grains, with scattering and extinction cross-sections proportional to ; the visible extinction curve ( as a function of ) is linear in . The column density of large grains between a star and the observer is proportional to the slope of the visible extinction , which is twice the visible reddening of the star if is expressed in m (Zagury, 2000b).
The problem of interstellar extinction was complicated by the release, in the 1960-70’s, of the first UV spectra of reddened stars. Extinction in the UV is less than the UV extension of the linear (in ) rise of the visible extinction, which can be explained either by a specific composition and size distribution of interstellar dust, or by an addition of starlight scattered and re-injected into the beam of the telescope. In the former case we do see what we think we see, i.e. the direct light from the star extinguished by interstellar dust. In the latter the effect of the additional component of scattered light diminishes the impression of extinction of the direct starlight by large grains.
The UV extinction curve exhibits a marked extinction feature, centered close to , in its near-UV part, and consists of a steep rise, though still under the UV extension of the visible extinction, in the far-UV.
If we observe the direct and extinguished light from reddened stars, the relation between these features and the large grains, and their variations from cloud to cloud, may be investigated by comparing extinction curves in different directions, normalized to a common slope in the visible (i.e. to the same column density of large grains). If extinction curves in different directions are normalized by , their visible parts superimpose well, but large and unpredictible variations in the bump region and in the far-UV are observed (Figure 6 in Bless & Savage (1972)): for an equal column density of large grains, the observed UV extinction can noticeably differ from one interstellar cloud to another.
Consequently, if the light we receive from a reddened star is dominated by the direct extinguished light from this star, large grains do not contribute to the UV extinction features, and their UV extinction must be a flat underlying continuum. Different types of particles -a minimum of three- are then needed to explain the visible to UV extinction curve (Désert et al., 1990; Greenberg, 2000). Large grains are responsible for the extinction of starlight in the visible and have a grey extinction in the UV. The bump feature is attributed to a distribution of small grains, and the far-UV rise of the extinction should be due to the presence in interstellar clouds of Polycyclic Aromatic Hydrocarbons (PAHs: Allamandola et al. (1985)) molecules, which should re-emitt in the near-infrared what they absorb in the far-UV.
The respective proportion of each of these three types of particles determines the importance of the extinction in each of the three parts (visible, bump, and far-UV regions) of the extinction curve. The observed extinction curve in one direction is then the sum of these 3 extinctions, and requires at least 3 parameters to be fitted. In fact, Fitzpatrick & Massa (1986, 1988, 1990) have shown that such a decomposition needs 6 independent parameters.
However, this standard interpretation of the extinction curve meets observational and analytical difficulties.
The observed relationships between the different parts of the extinction curve (see Figure 4 in Savage et al. (1985), Figure 9 in Savage (1975), Cardelli et al. (1989), and Zagury (2001d)), are difficult to reconcile with a three component grain model in which the proportion of each type of particles varies with the line of sight, and in an unpredictable way. In addition, no dependence of the different types of particles on environment has ever been evidenced (Jenniskens & Greenberg, 1993), so that the reason for these variations remains a mystery. For example, the claim that large grains might be destroyed into small grains in low column density, UV-exposed, regions, is contradicted by the linear relation which exists (Savage, 1975) between the bump height and ; this relationship means that the column density of small grains must grow in proportion to that of large grains. More specific problems remain: these include the precise identification of the PAH, the means by which they absorb the UV and re-emit in the near infrared, and the difficulty of reproducing in laboratory particles with such particular properties.
Recent analysis of UV observations by the International Ultraviolet Explorer (IUE) satellite contradict the near-UV breakdown of the extinction by large grains that is assumed by the standard theory. The scattering cross-section deduced from the UV spectra of nebulae varies as (Zagury, 2000a), as in the visible, which proves the continuity of the scattering cross section of interstellar matter, and a fortiori the continuity from the visible to the UV of the extinction law by large grains (Zagury, 2002a).
The visible-UV continuity of the extinction by large grains was further demonstrated for directions where the extinction is very low; the light we receive from stars with mag. is extinguished by the same exponential of in the visible and in the UV (Zagury, 2001c). At intermediate reddenings () the visible extinction law still extends in the near-UV, down to the bump region (Zagury, 2000b).
Analytically, the situation of the standard theory is no better. Not only have Fitzpatrick & Massa (1988) been unable to give any physical meaning to their mathematical expression of the far-UV extinction curve, but the Fitzpatrick & Massa (1990) fit for extinction curves is curiously confined to the UV domain: its extension to the visible systematically diverges from the observations (see Figure 4 of this paper and section 12.1 for a detailed discussion on this point). Second (and it is stricking that this was passed over in silence in nearly all the articles published so far on the three component grain model) Cardelli et al. (1989) have shown that extinction curves can generally be fitted using one parameter only, over all the visible-UV spectrum. If one parameter is enough to reproduce a large set of extinction curves, why does the standard theory of extinction needs 6 parameters? And why, with so many degrees of freedom, is it not able to do as well as the Cardelli et al. (1989) fit, i.e. to reproduce the complete visible+UV extinction curve?
Unless one has absolute faith (Li & Greenberg (2002), ‘In Dust We Trust….’) in the three component model, the several problems met by the standard theory of interstellar extinction prompt out to seek for other solutions. The only alternative to the standard theory is if the UV light we receive from reddened stars is not direct starlight alone, as it has been accepted so far, but that it also contains a non-negligible proportion of scattered light. Scattered light will first modify the UV part of the spectrum because it is in the UV that extinction, thus the number of photons available for scattering, is the highest.
The scattered light component is most easily observed in directions of moderate reddening where it is limited to the far-UV wavelengths. In these regions, it clearly appears as an excess superimposed on the tail of the exponential extinction by the large grains (Zagury, 2000b). At large optical depths, direct starlight, extinguished by large grains, becomes much smaller than scattered light. This is especially true at UV wavelengths, where, if the linear extinction by large grains extends to the UV, a moderate column density of interstellar matter will be able to extinguish all the direct starlight: we no longer see the star but its light scattered by foreground interstellar matter. If the visible reddening is important, the scattered light component can be large enough to modify the near-UV extinction, and even be detected in the visible (Zagury, 2001a).
The lower level of extinction in the UV, compared to what is expected by Mie theory for ‘normal’ large grains, is due not to a change of the extinction law of these grains between the visible and the UV, and to additional particles, but to this addition of scattered light.
This not only conforms to observations, but also leads to a simplification in our understanding of the interstellar medium: large grains follow a continuous, linear, extinction law from the near infrared to the far-UV; their properties are the same in all directions. The constraints on the nature of large grains implied by the standard theory, as well as the need for a grey extinction in the UV, are removed.
My papers published over the past five years have highlighted some properties of the scattered light component. To explain both its importance, a probable dependence on as , and the small angle within which it is effective, it seems that scattering must be coherent, thus confined to a very small angle (of order ”) around the direction of the star, and due to spherically symetric particles (Zagury, 2002c). Hydrogen fullfills all the conditions imposed to the scatterers (Zagury, 2002c).
In the first part of this paper I will reinvestigate some aspects of coherent scattering from the near forward directions (section 2 to section 7). Amongst the consequences, I shall then discuss the extinction curve of stars with circumstellar dust (section 8 to section 10), the spurious effect a scattered light component could have on distance estimates established by means of photometry (section 11), and the fit of the extinction curve (section 12).
2 Incoherent scattering
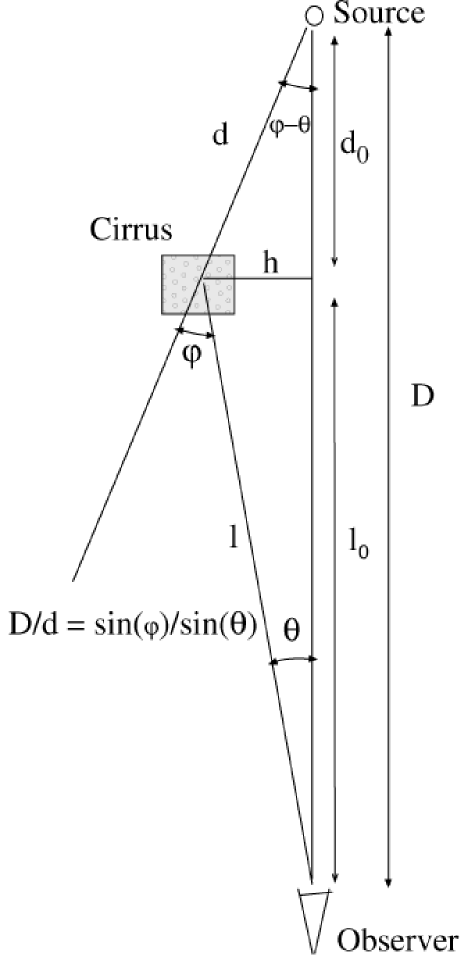
Let us consider a star of luminosity observed behind an interstellar cloud. The cloud is at a mean distance from the star and from the observer. is the distance star-observer. and are the distance of a point of the cloud, its distance to the star-observer axis is (see Figure 1).
The star is assimilated to a point source of unreddened flux measured by an observer on earth: .
The power per unit surface received by the observer due to the scattering of starlight by one atom, with scattering cross section , at is:
| (1) |
[for sake of simplicity, since we will be interested by orders of magnitude only, the Rayleigh cross-section is assumed to be isotropic; this is true within a factor of two, see van de Hulst (1969), section 6.12].
For an average column density of hydrogen of the cloud, the power scattered by the gaz reaching earth per unit surface can be estimated by:
| (2) |
if the scattering is not coherent.
Considerations on energy conservation show that the power scattered by an homogenous medium and received per unit surface will not exceed . This is demonstrated by imagining a spherical sheet of gas centered on the star and dense enough to extinguish all of its light. The scattered light received by a unit surface of a second sphere of radius will then be at its maximum and, for reasons of symetry, .
, for a cloud half way between the star and the observer (), will be:
| (3) | |||||
| (4) |
with , and .
The Rayleigh cross-section of a particle small compared to the wavelength is (van de Hulst, 1969), with , and the polarisability of the particle. For atomic hydrogen, (CGS units, is the Bohr radius of hydrogen). The Rayleigh cross-section of hydrogen is: ( in cm).
Typical reddenings of a few mag. ( a few 0.3 mag.) correspond to column densities of hydrogen (Bohlin et al., 1978). In the UV, is in the range . The maximum contribution of incoherent scattering by the gaz to the UV light received from the direction of the star, estimated from Equation 4, will remain small, at most.
3 Coherent scattering in the near forward directions
It is only in the near forward directions that scattering is singular enough to require a specific attention since the waves scattered by all atoms on the line of sight, regardless of their spatial organisation, keep a phase relation (Bohren & Huffman, 1983).
This coherent scattering is superimposed on the incoherent scattering estimated above, and restricted to a very small volume of the cloud around the direction of the star. As a first approximation, it will be assumed that the coherent scattered light can be described by a mean surface of the cloud around the direction of the star, and by atoms of the cloud within , so that the intensity of the coherent scattering the observer measures is simply .
This assumption separates a focused beam of scattered light (received from the near-forward directions), from the classical incoherent scattered light (received from the rest of the cloud). Reality is certainly more complex, with successive regions in phase and in phase opposition, as we move away from the direction of the star. In a perfectly homogenous medium the contributions of these successive zones must cancel to leave only the incoherent component of scattered light. The simplified approach adopted here will nevertheless be used to derive first orders of magnitude for , , and an upper value of the power of the coherent scattered light received by the observer.
The order of magnitude of should be given by the size of the first Fresnel zones, for the wavelength range over which coherent scattering is observed. The surface of the first Fresnel zone, as it is viewed by the observer, for a given wavelength , is:
| (5) |
is maximum when .
defines the region of the cloud within which all the path-lengths from the star to the observer differ by less than . It is also the largest surface within which the scattered light, at wavelength , observed at the positon of the observer, is constructively coherent. Consequently, if is a lower limit of the wavelength range over which scattering is constructively coherent: .
For an atom in , , the difference between the star-atom-observer path-length and , is (see Figure 1):
| (6) |
Viewed from the position of the observer, is seen under an angle ( is the radius of ), which must be less than the angle :
| (7) |
( was obtained by setting in Equation 6).
can logically be estimated by .
The power scattered by , at wavelength , is:
| (8) |
An upper value of is determined by setting :
| (9) |
Note that depends on , while varies as .
The power extinguished by the gas in is:
| (10) |
The ratio, , of the power extinguished in to the power received by a detector of size at the position of the observer is:
| (11) |
4 Numerical orders of magnitude
4.1 Numerical application
To estimate orders of magnitude for the quantities defined in section 3, we will suppose , and a cloud, of average column density [ mag.], a hundred parsec far from the sun. The rayleigh cross-section of hydrogen at (), the UV wavelength used in this section, is . The low column density approximation applies since .
The following orders of magnitude are then obtained:
| (12) | |||||
| (13) | |||||
| (14) | |||||
| (15) | |||||
| (16) |
The radius of the first Fresnel zone, for astronomical distances, is extremely large, of order km, at UV wavelengths and for a cloud 100 pc away. The power per unit surface of the light scattered from the first Fresnel zone, at the position of the observer, can theoretically be much larger than the unreddened flux of the star.
4.2 Comparison with observations

If extinction by large grains affects scattered light in the same proportion as direct starlight, and if the Rayleigh (exponential in ) extinction by the gas remains small, is equal to the observed ratio of scattered to direct starlights.
Figure 2 plots the ratio of scattered to direct starlights for a number of stars for which these two components have been estimated (Zagury (2001a) and the Appendix of this paper). The ratio of scattered to direct starlights increases with column density, as expected. The effect of gas extinction (the exponential of in Table 4) on the fits of the reduced spectra is small under , meaning that for this sample of stars is in the range around . For () the observed is between 0.1 and 10 (Figure 2), thus substantially smaller than in the idealized conditions of sections 3 and 4.1. can grow with larger values of , but it cannot grow too much because the gas extinction term of equation 19 will then become important.
5 Energy conservation
As long as Fresnel’s theory is correct, there is no doubt that atoms locked in the first Fresnel zone will give a scattered flux, at the position of the observer, given by equation 16, and estimated in section 4.1, very much greater than the unreddened flux of the source. Because of energy conservation, we must have: . , for a cloud half way between the source and the observer, and 100 pc away from the sun, can be estimated by: (equation 10), if and for . From Figure 2, is between and at (), for . The condition imposed by energy conservation is then: .
The power per unit surface scattered by atoms in the first Fresnel zone is sufficient to explain the deviation from the linear extinction by large grains observed in the UV. However, interstellar clouds are certainly not limited to a small space between the star and the observer, and for an homogenous medium a unit surface at the position of the observer should not receive more power than (for ), and in no way more than (section 2). The implication of this apparent contradiction is that interstellar clouds are not homogenous at scales larger than , which means that density fluctuations must exist at scales smaller than a few hundred kilometers.
Reality is then in between these two extreme approximations, of a perfectly homogenous medium on the one hand, of a concentration of gas in the first Fresnel zone (and nothing around) on the other. This is further justified by the observational orders of magnitude found in section 4.2 which are significantly smaller than the theoretical predictions of section 4.1, and much higher than what the brightness of an homogenous medium can be presumed to be.
6 Wavelength dependence of the scattered light
The maximum flux observable from coherent scattering from the first Fresnel zone at wavelength varies as (Equation 9). However, coherent scattering occurs from well defined interstellar structures which each will give a dependence (Equation 8), as it is indicated by observation (Zagury, 2001a, d).
It is also worth noting that the depth of the cloud along the line of sight (which was not considered in the preceding sections) will not change the wavelength dependence. As far as (and ) does not vary appreciably across the cloud, the waves scattered by atoms close to the line of sight, regardless of their exact projected position on the star-observer axis, reach the observer with identical amplitudes and phases, and add positively. If varies appreciably across the cloud the phases at the position of the observer will remain the same, though a sum over different amplitudes will have to be considered; but the dependence of the scattered light will be unchanged.
7 Dependence of the scattered light on geometry
The scattered coherent light from the cloud depends on geometry through the dependence of on distances, and through the small scale organisation of interstellar matter. For instance, if the scattering medium is close to the star, path-lengths’ differences will be large even very close to the direction of the star; coherent scattering is restricted to a quasi-null surface around the complete forward direction ( if , equation 5), and should tend to 0.
8 Stars with circumstellar dust
We expect (section 7) stars with circumstellar dust to have less scattered starlight contamination than if they were farther behind a cloud. If, as I believe (Zagury, 2002b), the bump is associated with the scattered light component, it follows that stars surrounded by interstellar matter should have a smaller bump than expected from their reddening. This is exactly the conclusion Sitko et al. (1981) reach from a sample of hot stars with a dust shell.
In the next sections I discuss the case of planetary nebulae (P.N.), and the shell stars of Sitko et al. (1981) article. Two methods can be used to detect an absence of scattered light in the UV spectrum of these object. One way is to prove [as it was done in Zagury (2001c) for directions of very low reddening] that the extinction law remains the same in the visible and in the UV: this is the case if the UV reduced spectrum of the object exponentially decreases as ( in m, see Zagury (2000b)), with . Another way is to check the presence of a bump: the study given in Zagury (2001c), on the extinction in very light interstellar media, shows that the threshold of above which a bump generally appears should be around 0.05 mag.; it is also above this value that the far-UV part of the extinction curve will in general no more be fitted by a straight line. The absence of a bump for a reddening much larger than 0.05 mag. indicates that the scattered light component is negligible.
|
||||||||||||||||||||||||||||||||||||||||||||||||||||||||||||||||||||||||||||||||||||||||||||||||||||||||||||||||||||||||||||||||
-
Large scale value of from Schlegel et al. (1998) (http://nedwww.ipac.caltech.edu/forms/calculator.html). Gives the reddening due to interstellar cirrus in the direction of the P.N., for . When , the galactic latitude replaces . If the P.N. is behind the cirrus, is the reddening due to foreground dust, excluding the material surrounding the star.
-
Photometric distance (kpc) from Cazetta & Maciel (2000).
-
Trigonometric distance (kpc), from Hipparcos, when available. ‘’ is for negative Hipparcos parallaxes.
-
IUE number of one IUE long-wavelength spectrum that can be used to prove the absence or the presence of a bump.
|
||||||||||||||||||||||||||||||||||||||||||||||||||||||||||||||||||||||||||||||||||||||||||||||||||||||||||||||||||||||||||||||||||||||||||||||||||||||||
9 Stars with circumstellar dust; planetary nebulae
For this section I will use the large dataset of planetary nebulae (P.N.) from Table 1 in Cazetta & Maciel (2000), and the P.N., observed by Hipparcos, of Acker et al. (1998). This sample of P.N. covers a large part of class 70-71 IUE objects (planetary nebulae observed with and without the central star).
In Table 1 and Table 2, these P.N. have been classified according to whether they have a bump at or not. P.N. are presented in decreasing order of reddening.
The striking difference of P.N. with no bump and P.N. with a bump, is that the reddening of the former is on the average much lower than that of the latter. This increase of reddening of P.N. with a bump compared to that of P.N. with no bump correlates with an increase of the ‘large scale’ reddening, , due to interstellar cirrus on the line of sight. Consequently, the difference of reddening between the two classes of P.N. (from Table 1 and Table 2) will be attributed to a difference of foreground extinction. If this part of the reddening could be identified and substracted, it is probable that Table 2 and Table 1 would be alike.
Thus, if it is assumed that the two sets of P.N., P.N. with a bump and foreground dust from Table 2, and P.N. without an apparent bump and negligible foreground dust from Table 1, differ because of the foreground extinction but have the same intrinsic properties on the average, it will be concluded that:
-
•
The reddening of a P.N. due to circumstellar dust is generally low. For most P.N., intrinsic should not exceed 0.1-0.2 mag.. Except for a few cases, larger extinctions are due to foreground dust.
-
•
A bump in a P.N. is due mainly to foreground dust, not to the surrounding material.
That the intrinsic should be low, 0.1-0.2 mag at most, reflects a general feeling, already expressed in the literature (Phillips, 1984). According to Phillips (1998), exceptions are compact nebulae of small radius ( pc). This may be the case of A35, NGC6905 and NGC5189 in Table 1, and of IC4997 and HD167362 in Table 2, for which the intrinsic reddening is apparently large, since the large scale reddening is low in these directions (though local enhancements of the foreground column density can not be excluded). A35, NGC6905 are cited by Phillips (1984) (see his Figure 3) as two among the few P.N. with higher intrinsic reddening than the average.
The intrinsic reddening of A35, NGC6905 and NGC5189 should be larger than 0.5 mag. The absence of an apparent bump in these nebulae, as for other P.N. with intrinsic larger than 0.05 mag, is, according to the framework developped in this paper, due to an absence of scattered light contamination, because of the proximity of the star and of the obscuring material (section 7).
To conclude this section on the reddening of planetary nebulae, it is worth mentionning the article of Stasińska et al. (1992) (and references therein), which compare the interstellar extinction of P.N. by means of photometry and a standard extinction law, and by means of radio measurements. There seems to be a systematic difference (always in the same way) when the reddenings found by the two methods are compared. This difference increases with reddening. According to Stasińska et al. (1992), it can only be due to a modification of the interstellar extinction law for clouds at larger distances than 2.2 kpc from the sun. At these distances, would be smaller than in the vincinity of the sun.
Strictly speaking the results of Stasińska et al. (1992) state that:
-
•
The observed extinction law depends on the distances ( and ) from the observer.
-
•
Standard extinction laws do not properly describe the interstellar reddening.
Both items agree with the ideas discussed so far. That interstellar extinction varies with distance from the observer can hardly be explained by a modification of its properties, which would lead to a questioning case of geocentricism: why should the properties of interstellar grains vary with distance from the sun?
|
-
Spectral type.
-
from Sitko et al. (1981); updated with Simbad and the Lausanne University database (http://obswww.unige.ch/gcpd).
-
deduced from spectral type and Fitzgerald (1970). The uncertainty on should not exceed mag..
-
Large scale value of from Schlegel et al. (1998). For stars in the galactic plane, galactic latitude is given.
-
Estimated distance (pc) from the sun (Hipparcos).
-
Infrared color, around the star, of the interstellar cirrus. This is the slope of the linear regression between the and the images, on a field centered on the star.
-
Ratio of the emission at the position of the star, to what should be the emission of the cirrus, estimated from the emission at the position of the star, and the linear regression found between the and emission (item (6)). If the reddening of a star is mainly due to circumstellar dust, should be small. On the contrary, if the extinction is due to foreground dust will be close to 1.
10 Stars with circumstellar dust; Sitko et al. (1981) shell stars
The first columns of Table 3 list the main characteristics of the shell stars used in Sitko et al. (1981). In this paper, the authors show that when intrinsic and foreground reddenings can be separated, the bump feature associated with the intrinsic reddening is less than expected for a ‘normal’ star extinguished by the same amount of foreground interstellar matter.
Stars in Table 3 are ordered by decreasing . HD44179, the Red Rectangle, was excluded from the table, since we know today that we do not observe the star, hidden behind a thick torus of dust, but scattered starlight escaping from the edges of the torus (Waelkens et al., 1995). ZCMa (HD53179) and HD31648 were also discarded because the noise level of their LWP and/or SWP spectra is nearly as high as the signal itself.
All stars in Table 3 have cirrus on their line of sight. Column is the average opacity of the cirrus in the direction of each star (Schlegel et al., 1998) and column its mean infrared color. Since the extinction due to these cirrus can be important, a major problem is to separate the reddening by circumstellar dust from the one due to the cirrus.
10.1 Separation of intrinsic and foreground reddenings
From the mean linear relation which exists between the and the emissions (seventh column of Table 3) in the vicinity of each star, we can calculate what should be the m emission of the cirrus at the position of the star, , for the m surface brightness measured by IRAS at the same position. The comparison of to , the measured m surface brightness at the position of the star, gives an indication on the respective proportions of foreground and intrinsic reddenings: if the proportion of foreground reddening is large should be close to 1, while a large proportion of intrinsic reddening should imply a high m surface brightness at the position of the star (because of the heating of the dust surrounding the star); thus a low .
Additional indications on the origin of the reddening of the stars will come from the distance; from the comparison of with the reddening of the stars; and from the level of this reddening, since intrinsic reddenings, as for P.N., can be presumed not to exceed 0.1-0.2 mag.
These criteria applied to Table 3 permit the separation of BD, BD, V380 Ori, and HD190073, on the one hand, from HD45677, AB Aur, and HD50138 on the other. The cases of HD259431 and of HD163296, both at low galactic latitude, are more difficult to fix. HD259431 has an intermediate value, and its reddening is larger than what can be expected for a normal intrinsic one, which may be due to a better equilibrium between intrinsic and foreground extinctions. For HD163296 is close to 1 but this pre-main sequence star is close to the sun, and its reddening is low and may be due to the dust surrounding the star.
The main source of reddening for the former stars, BD, BD, V380 Ori, and HD190073, is probably foreground dust. If so, the low foreground reddenings ( mag.) Sitko et al. (1981) find for V380 Ori and for HD190073 are underestimated. This should also be the case for BD, for which Sitko et al. (1981) give mag.. The proportion of inrinsic reddening for HD45677, AB Aur, and HD50138, is larger.
10.2 The bump feature and intrinsic reddening
Sitko et al. (1981) tried to correct the extinction curves of AB Aur, HD50138, HD259431, and HD45677, for their foreground reddening, using a standard extinction law. This correction being done [Figure 9 of Sitko et al. (1981)] the authors find a bump feature (attributed to intrinsic reddening) much lower than expected from a ‘normal’ reddening by foreground dust.
This conclusion is supported by a direct analysis of the reduced spectrum of the stars (Figures 3 and 10, Table 4). There are five stars in Table 4 with reddening less than 0.2 mag. The four stars whose reduced spectrum can be fitted without a scattered light component are all Sitko et al. (1981) shell stars. The bump-like depression in the spectrum of these stars, centered around , is due to the Fe lines. HD50138 and AB Aur in particular have reddenings well above the 0.05 mag threshold. Their reduced spectrum can be compared to that of HD23480 (Figure 3), of lesser reddening, but with a clear bump feature.
For HD259431 and HD45677, which have higher reddening, intrinsic and foreground extinctions are mixed and conclusions from the size of the bump are not so easy to reach. Comparison of their spectrum to HD62542 or to HD149757 ( Oph) is meaningless since these two stars are surrounded by dust (Cardelli & Savage, 1988).
11 Effect of scattered starlight contamination on distance estimates
A component of scattered light in the spectrum of reddened stars, if it is not identified and separated from the direct starlight, will give an impression of less extinction by large grains than it really is the case. A star for which the extinction is underestimated appears farther, if its distance is estimated by means of photometric methods, than it really is. Consequently, photometric distances to reddened stars will be overestimated when compared to trigonometric distances if the presence of scattered light is large enough to modify the estimate of the reddening of the star.
This result can be retrieved through analytical considerations, since the presence of scattered light introduces a term which grows with : scattered light in the spectrum of reddened stars will always modify extinction curves by decreasing the visible slope [], and therefore lead to an underestimate of the reddening.
The difference between the reddening estimated from observation, , and the true , deduced from the analysis of the spectrum of HD46223 (Zagury, 2001a), is mag.. For the stars with high reddening used in Zagury (2001d) (Figure 4 of Zagury (2001d)), can be up to mag. The corresponding errors on the distance modulus [, and are the observed and absolute magnitudes of a star in the -band] are mag and mag, meaning that estimates of distance by means of UBV photometry can be out by up to . This relative error can be enhanced if the reddening is estimated from wavelengths shorter than the -band (H for example), since scattered light contamination increases with decreasing wavelength.
Hipparcos distances have been compared to photometric distances for some star clusters (see van Leeuwen & Hansen (1997); van Leeuwen (1999); Robichon et al. (1999); Stello & Nissen. (2001) and an article of Floor van Leeuwen at Hipparcos website), and for some planetary nebulae (Acker et al., 1998; Pottasch & Acker, 1998). There is agreement between the two methods for some objects, but there are cases for which the two methods lead to different results, with a systematic trend for Hipparcos distances to be smaller, by up to , than the classical photometric methods.
Since the same particularity exists for star clusters and for P.N., the cause is probably not linked to a specific class of objects (such as young clusters, as argued by van Leeuwen & Hansen (1997); see Stello & Nissen. (2001) who also rejects this hypothesis). It is not likely either that the reduction procedure of Hipparcos data be the cause of the discrepency; it would then affect all Hipparcos data, while there is a good agreement between Hipparcos and other ground-based parallaxes (Harris et al., 1997).
I wondered if the presence of scattered light in the spectrum of reddened objects could influence the determination of their reddening and distance, and contribute to the differences observed between Hipparcos and photometric distances. In general, since extinction is much enhanced in the UV, UV extinction curves will be a powerful tool in determining the true extinction of a star for which the distance is to be determined by means of photometry.
12 Towards a fit of the extinction curve


12.1 The standard theory framework
In the framework of the standard theory of extinction (i.e. if we do observe the direct light from reddened stars) the comparison of extinction curves, normalized to the same column density of large grains, is necessary to understand the relationships between the different types of particles responsible for the overall extinction. If the particles responsible for the UV extinction were the same large grains responsible for the visible extinction -or are in a constant proportion to these large grains- UV normalized extinction curves should superimpose well. In the contrary extinction curves normalized in the visible will differ in the UV.
Although logical, this reasoning leads to a dead-end. Extinction curves normalized by have aleatory behaviors in the UV, meaning that the relations which clearly exist between the different parts of a non-normalized extinction curve [Savage et al. (1985), or Zagury (2001d) for the relation between visible and far-UV extinctions] are lost when extinction curves are normalized by ; the number of parameters necessary to fit normalized extinction curves grows to 6, in contradiction with the empirical finding of Cardelli et al. (1989): ‘The most important result presented here is that the entire mean extinction law, from the near-IR through the optical and IUE-accessible UV, can be well represented by a mean relationship which depends upon a single parameter…The deviations of the observations from the mean relation (e.g., Figs. 1 and 2) are impressively small.’ [Cardelli et al. (1989), p.252-253. The ‘mean relation’ of their Fig. 1 linearly relates, for UV wavelengths, and , thus to ].
Moreover the Fitzpatrick & Massa (1990) fits correctly reproduce the observations in the UV but diverge from it in the visible. For three of the stars of Figure 3, the fit coefficients were calculated by Fitzpatrick & Massa (1988) or by Aiello et al. (1988). Figure 4 plots the reduced spectra of these stars along with their Fitzpatrick & Massa (1990) fit. The fits are good at UV wavelengths (except in the bump region) but clearly diverge from observation in the visible. This absence of constraint of the Fitzpatrick & Massa (1990) fit by the visible part of the extinction curve is a first explanation to the absence of relationship found between the coefficients of the fit and (Jenniskens & Greenberg, 1993; Aiello et al., 1988).
In a recent paper (Fitzpatrick, 2004), E. Fitzpatrick recognizes the limitations of the Fitzpatrick & Massa (1990) fit, and argues that the correlations found by Cardelli et al. (1989) between the different parts of non-normalized extinction curves is only due to a too small number of stars [29 stars are used by Cardelli et al. (1989)]. This argument doesn’t stand. Firstly, Cardelli et al. (1989) stars are field stars, which were taken from Fitzpatrick & Massa (1988) and had available near-IR photometry at the time the paper was written, with no particular assumption governing their choice. Why shouldn’t the following fifty or hundred stars follow the same relationships, except for possible deviations due to uncertainties on spectral types? Secondly, even the 29 stars of the Cardelli et al. (1989) study present strong divergences in the UV if they are normalized by (see Figure 6 of Bless & Savage (1972)). Lastly, the existence of a relationship, between the visible and far-UV parts of extinction curves, which is evident in the study of Cardelli et al. (1989), was independently retrieved by Zagury (2001d), on the basis of the physical ideas developed in the present paper.
It is therefore the normalization process of extinction curves which is to be questioned, and not the number of stars used by Cardelli et al. (1989).
If scattered starlight is added to direct starlight, the light we receive from a reddened star will be composed of direct starlight, extinguished by large grains in proportion of the column density (thus proportional to ), on the one hand, and of the starlight scattered by hydrogen, also extinguished by large grains, but proportional to the square of the column density [], on the other. Because of this difference in the dependence of the two components of the extinction curve on , normalization by is meaningless. It can only increase the differences between extinction curves, and mask their relationships. The normalization by is the second reason, in addition to its limited wavelength domain of application, why no relation was ever found between the far-UV and visible parts of the Fitzpatrick & Massa (1990) decomposition of the extinction curve.
12.2 A first step towards the fit of the extinction curve


Rayleigh scattering by hydrogen, with an additional extinction by large grains, should be fitted by a function proportional to (Rayleigh, 1871):
| (17) |
The term is for the extinction by large grains of the scattered light. The term accounts for extinction by the gas. should grow with the gas column density. This term is usually considered as small compared with the extinction by large grains, but it may gain in importance in the UV. It must affect direct starlight as well as scattered light.
Outside the bump region, the fit of the reduced spectrum of a reddened star should ressemble:
| (18) |
in m.
Since direct and scattered light cross media which should be very much alike, we can suppose and ( is the true reddening, determined from the UV part of the reduced spectrum, which should be close to deduced from photometry and spectral type).
contains the dependence of the scattered light, corrected for the extinction by large grains, on . also depends on the distances to the cloud and to the star.
Observations I have used (Zagury, 2001a, d), give an dependence on as . Therefore, the analytical expression of interstellar extinction outside the bump region should look like:
| (19) |
depends on the distances to the cloud and to the star.
Figure 3 summarises all the fits calculated (from expression 19) and included in the appendix. The spectra are ordered from top to bottom by decreasing reddening. The expression of each fit is in Table 4. Although there are uncertainties on these fits and they probably can be improved, the coefficients found already give an idea of the relationships which may exist between the parameters of expression 19.
Figure 5 confirms the relationship, already evidenced in Zagury (2001d), between the visible and the far-UV parts of the extinction curve. , the value of the reddening in the direction of each star obtained from the analysis of the extinction curve, is plotted against , the reddening determined from the star photometry. There is good agreement between the two values.
The coefficient which fixes the importance of the scattered light is plotted against in Figure 6. It roughly behaves as , as expected, with (neglecting the dependence on the geometry).
The gas extinction term affects the far-UV part of the fits, permitting a steeper curve in the far-UV. It is not clear whether the steepness of the far-UV extinction curve is due to this term or to the wing of the Ly absorption line. AB Aur (Figure 10) and HD190073 for instance have steep far-UV reduced spectra. Since the reddening in these two directions is low it can be surmised that gas extinction is negligible -even in the UV- so that the steepness of the far-UV extinction curve in these directions is due to the wing of the Ly absorption. Comparison with the non-reddenned star HD104878 shows this is certainly the case for AB Aur, and probably also for HD190073 (Figure 8). The absence of a clear relation in Figure 7 plot of versus will also be related to this difficulty of a precise determination of . The pertinence of a gas extinction term can probably also be investigated from a theoretical point of view by the comparison of the extinction cross-section of the gas to the values of (a few , if is in m) given in Table 4.
13 Conclusion
The hypothesis of the standard theory of extinction, that the UV light we receive from a reddened star is mainly the direct light from the star, and its corollary, the three component interstellar grain model, are not borne out by observation.
The only alternative to the standard theory is that the spectrum of a reddened star is contaminated by light scattered at small angular distances from the star. The far-UV part of the extinction curve is observed to be less than the continuation of the visible extinction by large grains because of the importance of the scattered light component in the UV.
There is no need for particles such as PAH to explain the far-UV light we receive from a reddened star, with the probable implication that these particles do not exist in the interstellar medium. This is not so much surprising since one can wonder how particles we are not even able to synthesize on earth, can proliferate in the cold and low density environment of an average interstellar cloud.
In the first part of the paper I have discussed several aspects of coherent scattering in the near forward directions, which is the unique reason I have found to explain the importance of the scattered light component in the spectrum of reddened stars (Zagury, 2001b). There is up to date no theoretical treatment of this phenomenom, only briefly mentioned in some textbooks as the Bohren & Huffman (1983). The reason might be the specific conditions necessary to its observation, which require large distances between the source of light, the scattering medium, and the observer; and a non-homogenous (turbulent) medium.
Elementary calculations show that coherent forward scattering by hydrogen easily accounts for the order of magnitude found for the scattered light component of the spectrum of reddened stars, and will give the observed wavelength dependence. This scattering occurs within angles of ” or less from the direction of the stars, which represents a surface of radius a few for a cloud 100 pc away. It implies that interstellar clouds still have structure at scales of a few hundred km.
If the cloud is close to the star () variations of the pathlengths for the scattered light will be large (compared to UV wavelengths) and random, even at very close angular distance from the star. The effect of coherence will be annihilated. This latter result was announced by Sitko et al. (1981), who showed that hot stars with circumstellar dust have a bump smaller than expected from their reddening. Sitko et al. (1981) result was extended to planetary nebulae (section 9). It is concluded that circumstellar matter participates little or nothing to the bump. The bump, when present, is mainly due to a foreground cloud. The extinction curves for the Sitko et al. (1981) stars with are a straight line from the visible to the UV: we observe the extinction of the direct starlight by the large grains (with a continuous extinction law) only.
The diminution of the bump when extinction comes from circumstellar material emphasizes the link between the coherent scattered light and the bump. It confirms an opinion I have already expressed (Zagury, 2001b, 2002b) that the bump is not an absorption feature but an interruption of the scattered light, or, as I believe today, a compensation between (1) the extinction by the gas of the direct starlight, and (2) the scattered light.
Standard extinction laws tend to underestimate the true extinction by large grains. If the distance of a star is estimated by means of photometry, the unreddened flux of the star will be underestimated, and the star will be believed to be farther off than it really is. The mismatch can be larger than , and should be observed when photometric distances of reddened stars are compared to parallaxes. This may be related to on-going problems (van Leeuwen, 2004) on the comparison between Hipparcos results to distances determined by photometric means.
Based upon the dependence on of the far-UV extinction curve in a few directions found in Zagury (2001a, d), I have discussed what should be the fit of the extinction curve (outside the bump region). This early attempt to give a physical meaning to the fit of the extinction curve was applied to the stars used in this paper and in Zagury (2000b). The relationship between far-UV and visible extinctions found by Zagury (2001d) is well confirmed. The coefficient which determines the importance of the scattered light component roughly behaves as , as expected. The fit used in section 12 and in the appendix introduces a gas extinction term which accounts in part for the steepness of the extinction in the far-UV. It is not clear whether this effect is real or due to the wings of the Ly absorption.
In section 12.1 I have also discussed the reasons why no relation was ever found using the Fitzpatrick & Massa (1990) fit of the extinction curve, and more generally why this fit is not appropriate -despite a new attempt, announced in Fitzpatrick (2004), to model simultaneously the spectra of the reddened and standard stars- to a correct representation of the extinction curve.
A last implication of this work, foreseen, and refused, by Fitzpatrick (2004), is that the true interstellar extinction law, and the average extinction properties of interstellar grains, are the same in all directions.
Appendix A Appendix: Fit of extinction curves

The reduced spectra of the stars used in Zagury (2000b) are fitted in Figure 9, using the general formulation of section 12, equation 19. There is not absolute uniqueness of each fit, and the relevance of the gas extinction parameter still remains to be proved (section 12). In absence of more constraints I tried to determine a good fit to each of the spectra. The fits extend from the visible to the far-UV, the visible spectra are replaced by the photometric UBV points retrieved from the Lausanne database (http://obswww.unige.ch/gcpd).
The reduced spectra of Sitko et al. (1981) stars can be classified, as I have done in previous papers, according to how far towards the visible the scattered component can be perceived. HD163296, HD190073, HD50138, AB Aur, follow the same extinction law in the visible and in the UV (Figure 10), thus have a negligible scattered light contamination. For HD45677, of moderate reddening, the visible extinction law extends down to the bump region, the scattered component appears as superimposed on the tail of the far-UV extinction by large grains. The reduced spectrum of each of the four stars of higher reddening (HD259431, V380 Ori, BD, BD) multiplied by , is an exponential of in the far-UV (Figure 11); the exponent, , is close to (Figure 5). The far-UV slope of BD, the star with the highest reddening, is difficult to determine, because of the small wavenumber interval between the bump on the short wavenumber side, and the Ly line on the other side. Figure 10 plots, as it was done for the stars of Zagury (2000b), the reduced spectra of Sitko et al. (1981) stars (except for HD190073, see figure 8) and a possible fit deduced from equation 19.


|
|
-
Spectral type.
-
from the Lausanne University database (http://obswww.unige.ch/gcpd).
-
deduced from spectral type and Fitzgerald (1970).
References
- Acker et al. (1998) Acker A., et al., 1998, A&A, 337, 253
- Aiello et al. (1988) Aiello S., et al., 1988, A&ASS, 73, 195
- Allamandola et al. (1985) Allamandola, L.J., Tielens A.G.G.M., Barker J.R., 1985, ApJ, 290, 25
- Bless & Savage (1972) Bless R.C., Savage B.D., 1972, ApJ, 171, 293
- Bohren & Huffman (1983) Bohren C.F., Huffman, D.R., 1983, Absorption and Scattering by Small Particles, John Wiley & Sons, p.68
- Bohlin et al. (1978) Bolhin R.C., Savage B.D, Drake J.F, 1978, ApJ, 224, 132
- Cardelli & Savage (1988) Cardelli J.A., Savage B.D., 1988, ApJ, 325, 864
- Cardelli et al. (1989) Cardelli J.A., Clayton G.C., Mathis J.S., 1989, ApJ, 345, 245
- Cazetta & Maciel (2000) Cazetta J.O, Maciel W.J., 2000, RexMexAA, 36, 3
- Désert et al. (1990) Desert F.X., Boulanger F., Puget J.L., 1990, A&A, 237, 215
- Fitzgerald (1970) FitzGerald M. P., 1970, A&A, 4, 234
- Fitzpatrick & Massa (1986) Fitzpatrick E.L., Massa D., 1986, ApJ, 307, 286
- Fitzpatrick & Massa (1988) Fitzpatrick E.L., Massa D., 1988, ApJ, 328, 734
- Fitzpatrick & Massa (1990) Fitzpatrick E.L., Massa D., 1990, ApJSS, 72, 163
- Fitzpatrick (2004) Fitzpatrick E.L., 2004, astro-ph/0401344, to appear in the procedings of ‘Astrophysics of Dust (2004)’, in press
- Harris et al. (1997) Harris H.C., Dahn C.C., Monet D.G., Proceedings of the ESA Symposium ‘Hipparcos - Venice ’97’, ESA SP-402, p.105
- van de Hulst (1969) Van de Hulst, H.C., ‘Light Scattering by Small Particles’, Dover, 1981
- Greenberg (2000) Greenberg, J.M., 2000, Sci. Am., 283, 6, 46
- Jenniskens & Greenberg (1993) Jenniskens P., Greenberg J.M., 1993, A&A 274, 439
- van Leeuwen (1999) van Leeuwen F., 1999, A&A, 341, L71
- van Leeuwen (2004) van Leeuwen F., 2004, Proceedings of the IAU Colloquium No 196 ‘Transit of Venus: Views of the Solar System and Galaxy’, in press
- van Leeuwen & Hansen (1997) van Leeuwen F., Hansen C., 1997, Proceedings of the ESA Symposium ‘Hipparcos - Venice ’97’, ESA SP-402, p.689
- Li & Greenberg (2002) Li A., Greenberg J.M., 2002, Solid State Astrochemistry, edited by V. Pirronello & Krelowski J., Kluwer Academic Publishers
- Phillips (1984) Phillips J.P., 1984, A&A, 140, 141
- Phillips (1998) Phillips J.P., 1998, A&A, 336, 986
- Pottasch & Acker (1998) Pottasch S.R., Acker A., 1998, A&A, 329, L5
- Rayleigh (1871) Lord Rayleigh, 1871, Phil. Mag. XLI, 274, 107
- Robichon et al. (1999) Robichon N., et al., 1999, A&A, 345, 471
- Savage (1975) Savage B.D., 1975, ApJ, 199, 92
- Savage et al. (1985) Savage B.D., Massa D., Meade M., Wesselius P.R., 1985, ApJSS, 59, 397
- Sitko et al. (1981) Sitko M.L., Savage B.D., Meade M.R., 1981, ApJ, 246, 161
- Stasińska et al. (1992) Stasińska G., et al., 1992, A&A, 266, 486
- Schlegel et al. (1998) Schlegel D., Finkbeiner D.P., Davis M., 1998, ApJ, 500, 525
- Stello & Nissen. (2001) Stello D., Nissen P.E., 2001, A&A, 374, 105
- Waelkens et al. (1995) Walkens C., et al., 1996, A&A, 314, L17
- Zagury (2000a) Zagury, F., 2000a, NewA, 4, 211
- Zagury (2000b) Zagury, F., 2000b, NewA, 5, 285
- Zagury (2001a) Zagury, F., 2001a, NewA, 6/7, 403
- Zagury (2001b) Zagury, F., 2001b, NewA, 6/7, 415
- Zagury (2001c) Zagury, F., 2001c, NewA, 6/8, 471
- Zagury (2001d) Zagury, F., 2001d, NewA, 7/3, 117
- Zagury (2002a) Zagury, F., 2002a, NewA, 7/4, 185
- Zagury (2002b) Zagury, F., 2002b, NewA, 7/4, 191
- Zagury (2002c) Zagury, F., 2002c, NewA, 7/6, 369