High-Resolution Measurements of the Dark Matter Halo of NGC 2976: Evidence for a Shallow Density Profile11affiliation: Based on observations carried out at the WIYN Observatory. The WIYN Observatory is a joint facility of the University of Wisconsin-Madison, Indiana University, Yale University, and the National Optical Astronomy Observatory.
Abstract
We have obtained two-dimensional velocity fields of the dwarf spiral galaxy NGC 2976 in H and CO. The high spatial ( pc) and spectral (13 km s-1 and 2 km s-1, respectively) resolution of these observations, along with our multicolor optical and near-infrared imaging, allow us to measure the shape of the density profile of the dark matter halo with good precision. We find that the total (baryonic plus dark matter) mass distribution of NGC 2976 follows a power law out to a radius of 1.8 kpc, assuming that the observed radial motions provide no support. The density profile attributed to the dark halo is even shallower, consistent with a nearly constant density of dark matter over the entire observed region. A maximal disk fit yields an upper limit to the K-band stellar mass-to-light ratio () of (including systematic uncertainties), with the caveat that for the dark matter density increases with radius, which is unphysical. Assuming , the dark matter density profile lies between and . Therefore, independent of any assumptions about the stellar disk or the functional form of the density profile, NGC 2976 does not contain a cuspy dark matter halo. We also investigate some of the systematic effects that can hamper rotation curve studies, and show that 1) longslit rotation curves are far more vulnerable to systematic errors than two-dimensional velocity fields, 2) NGC 2976 contains radial motions that are as large as 90 % of the rotational velocities at small radii, and 3) the H and CO velocity fields of NGC 2976 agree within their uncertainties, with a typical scatter between the two velocities of 5.3 km s-1 at any position in the galaxy.
1 INTRODUCTION
The apparent disagreement between the observed dark matter density profiles of dwarf and low-surface brightness (LSB) galaxies and the density profiles predicted by numerical Cold Dark Matter (CDM) simulations has been widely discussed by both theorists and observers over the past several years (e.g., Flores & Primack, 1994; Burkert, 1995; Navarro, Frenk, & White, 1996; Moore et al., 1999b). However, there remains a disturbing lack of consensus in the observational community on the actual shape of the observed dark matter density profiles. Many authors claim that only constant-density cores are allowed by the observations (de Blok et al., 2001; Borriello & Salucci, 2001; de Blok, McGaugh, & Rubin, 2001; de Blok & Bosma, 2002; Salucci, Walter, & Borriello, 2002; Weldrake, de Blok, & Walter, 2003). On the other hand, van den Bosch et al. (2000), van den Bosch & Swaters (2001), and Swaters et al. (2002, hereafter SMVB) argue that most existing rotation curves are also consistent with NFW-like () central density cusps. Even the very highest resolution ( pc) studies do not seem to be converging on a single result; Blais-Ouellette, Amram, & Carignan (2001) found in NGC 3109 and in IC 2574 (ignoring the stellar disk contributions to the rotation curves), Bolatto et al. (2002) showed that NGC 4605 has a density profile , and Weldrake et al. (2003) determined that NGC 6822 contains an essentially constant-density halo.
The recent study by SMVB shows that, in large part, the lack of consensus among observers reflects ambiguities in the data themselves. For the parameters of typical dwarf/LSB galaxy observations ( km s-1 velocity resolution and ″ seeing for longslit H observations, and km s-1 velocity resolution and ″ angular resolution for H I interferometry), they find that most galaxies show central density profiles that are consistent with any shape between and .
We address this problem with a new study that combines a number of techniques to overcome the observational challenges. Our program includes 1) two-dimensional velocity fields obtained at optical (H), millimeter (CO), and centimeter (H I) wavelengths, 2) high angular resolution (), 3) high spectral resolution ( km s-1), 4) multicolor optical and near-infrared photometry, and 5) nearby dwarf galaxies as targets. Observing completely independent tracers of the velocity field at two or three different wavelengths reduces our vulnerability to the systematic problems that can affect a single tracer. For example, H velocity fields can be distorted by extinction, or by large-scale flows that are associated with star formation, while existing H I data generally suffer from beam smearing. Two-dimensional velocity fields also represent a major improvement over the traditional longslit spectra, making the effect of positioning errors negligible and allowing us to account for simple noncircular motions. High angular resolution is important because the central cores described in the literature have typical radii of kpc, which corresponds to an angular size of arcseconds. In order to resolve this size scale and minimize the impact of beam smearing on our conclusions, an angular resolution element several times smaller is required. High spectral resolution is also beneficial because it results in more accurate rotation curves. Finally, our multicolor photometry plays a crucial role in allowing us to attempt to realistically model the rotational contribution from stellar disks instead of simply guessing an appropriate mass-to-light ratio and assuming an exponential disk.
Target selection also has important effects on the strength of the conclusions we will be able to draw. We focus on very nearby objects (D 10 Mpc) in order to maximize our physical resolution. Dwarf and LSB galaxies are the preferred targets for this type of study because they are presumed to be the most dark-matter dominated galaxies. (Note that in this paper when we refer to dwarf galaxies, we mean high-mass dwarf irregulars and low-mass spiral galaxies, not dwarf spheroidals or ellipticals.) LSB galaxies, though, tend to be relatively distant and are necessarily quite faint, so they are difficult to observe with sufficient resolution and sensitivity. Dwarf galaxies, in comparison, are both bright and plentiful in the nearby universe. Dwarfs are traditionally presumed to be dark-matter dominated at all radii (Carignan & Freeman, 1988; Carignan & Beaulieu, 1989; Jobin & Carignan, 1990; Martimbeau, Carignan, & Roy, 1994). However, the observations upon which this assumption is based were made at low angular resolution. Higher resolution observations of the inner regions of dwarf galaxies show, as we discuss later, that stars can dominate the kinematics of dwarf galaxies in their inner kpc (e.g., Broeils, 1992; Swaters, 1999; Blais-Ouellette et al., 1999; Bolatto et al., 2002). Comparable data for LSB galaxies are scarce (although see Swaters, Madore, & Trewhella, 2000; Swaters et al., 2003), but it is possible that reliance on low-resolution observations (e.g., de Blok & McGaugh, 1997) could have caused an overstatement of the case for dark matter domination in these galaxies as well. Future studies of LSB galaxies, featuring two-dimensional H spectroscopy and/or pc resolution H I observations, if feasible, are desirable both to investigate this question and to clarify the severity of the cusp/core problem.
In a previous paper, we reported on a rotation curve study of the dwarf spiral galaxy NGC 4605 (Bolatto et al., 2002). In this paper, we present a similar, but improved, study of a second nearby dwarf galaxy, NGC 2976. As before, we use high-resolution CO interferometry to study the inner velocity field of the galaxy, but we have also acquired high-resolution two-dimensional H data (instead of longslit observations) to supplement the CO and extend the velocity field out to larger radii. In addition, we have obtained multicolor optical imaging of this galaxy, which, combined with archival 2MASS near-infrared images, enables us to accurately model the stellar disk.
In the following section, we describe NGC 2976 and our observations and data reduction. In §3, we model the stellar and gaseous disks. In §4, we derive the rotation curve of the galaxy and the density profile of its dark matter halo. The analysis routines that we use are presented in more detail in Appendix A. We discuss our results and their implications in §5. In §6, we describe some systematic uncertainties that can affect rotation curve studies, and test the robustness of our results against them. We present our conclusions in §7.
2 TARGET, OBSERVATIONS, AND DATA REDUCTION
2.1 Properties of NGC 2976
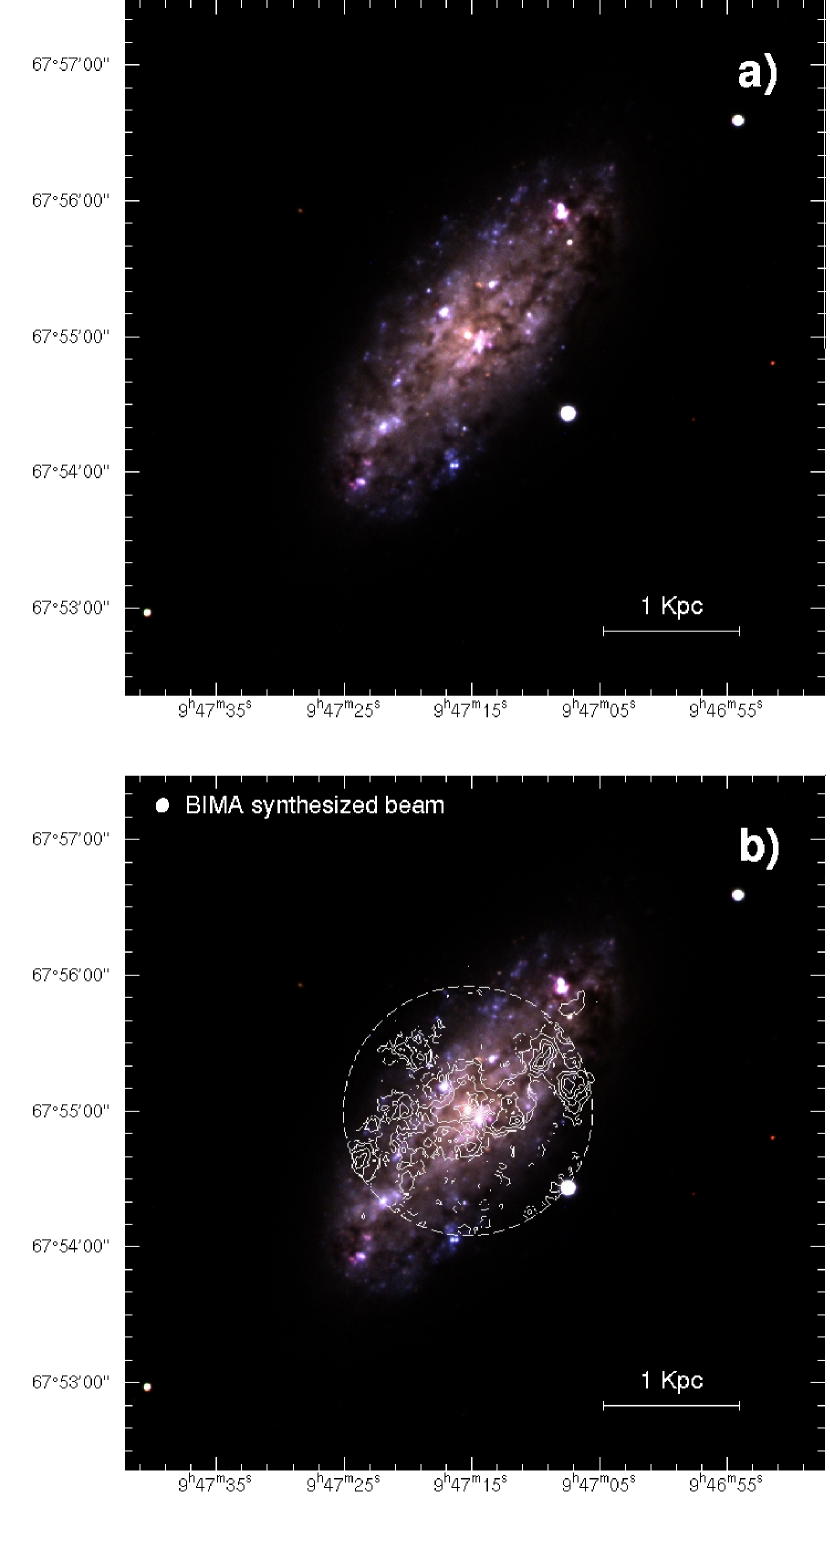
NGC 2976 is a regular Sc dwarf galaxy located in the M 81 group. Karachentsev et al. (2002) measured a distance of Mpc using the Tip of the Red Giant Branch (TRGB) method, and the Tully-Fisher distance is Mpc (M. Pierce, private communication). We adopt a distance of 3.45 Mpc, which sets the conversion between physical and angular scales to pc arcsec-1. NGC 2976 has absolute magnitudes of M and M, a heliocentric velocity of km s-1, an inclination-corrected H I linewidth W km s-1, and a total mass of , so it is somewhat less luminous and less massive than the Large Magellanic Cloud. The low systemic velocity is not a problem for our observations because the galaxy is located at high Galactic latitude, where there is little Milky Way CO emission, and no Galactic H emission is visible. In optical and near-infrared images it is clear that NGC 2976 is a bulgeless, unbarred, pure disk system (see Figure 1), which makes it an ideal galaxy for mass modeling.
2.2 H Observations and Reductions
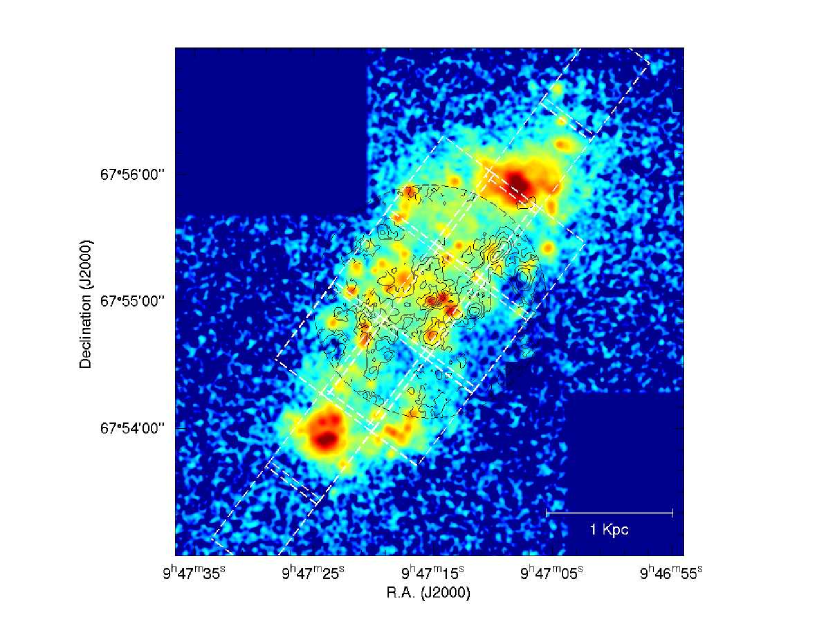
Our H observations were obtained on the nights of 2002 March 20-21 at the 3.5 m WIYN telescope with the DensePak instrument. DensePak is an array of 94 28-diameter fibers, fixed in a rectangle with a fiber-to-fiber spacing of 4″ (Barden, Sawyer, & Honeycutt, 1998). Five of the fibers are broken and four are sky fibers, placed at fixed positions outside the main array. Thus, there are 85 data fibers covering almost the whole instrument footprint (see Figure 2). The fibers feed into the Bench Spectrograph, which we used in its echelle mode to yield 13 km s-1 velocity resolution over a 180 Å range centered on H. The detector was a SITe T2KC CCD.
We observed the galaxy at 13 positions to cover most of its optical extent (see Figures 3 and 4a). The galaxy was not visible on the guide camera at the telescope, so we acquired the target by offsetting from a nearby bright star. Each subsequent position on the galaxy was observed by making a blind offset from the previous position. Integration times at each position were between 20 and 70 minutes, with just a single 20-minute exposure at most positions. Consecutive exposures at the same position were reduced separately and then coadded. Two of the fields were observed on both nights, and one field was observed twice on the same night, but five hours apart. In these three cases, instead of assuming that the positions observed were the same for the later observations as they were for the earlier ones, we analyzed the frames entirely independently. We therefore had 16 observations of NGC 2976, yielding a total of 1360 spectra, of which 1087 contained H emission at a level of or higher. Based on comparison with adjacent fibers that contained brighter emission at similar velocities, we also judged that 9 spectra containing emission at a significance level between and represented real signal. The median detection level in the 1096 spectra that contained emission was in integrated intensity, or at the peak of the line.
The DensePak data were reduced in IRAF111IRAF is distributed by the National Optical Astronomy Observatories, which is operated by the Association of Universities for Research in Astronomy, Inc. (AURA) under cooperative agreement with the National Science Foundation., using the HYDRA package. We subtracted a bias frame, removed cosmic rays, interpolated over bad columns, and then extracted the spectra with the task dohydra. The trace and response function for each fiber and the relative transmission efficiencies were derived from a set of flat field images, and wavelength calibration was provided by spectra of a CuAr lamp. Night-sky emission line wavelengths from Osterbrock et al. (1996) and observations of a radial velocity standard star were used to check the wavelength scale. After extraction and wavelength calibration, we averaged together the four sky fibers, leaving out any sky spectra that were contaminated by emission lines from the target galaxy. We then removed a linear baseline, performed a Gaussian fit to the averaged sky emission near H, and subtracted the fit from all of the data fibers. Some spectra contained noticeable residuals at the wavelength of the sky H line after this subtraction. Sky residuals are easily distinguishable from real signals because they are unresolved and always located in the same four pixels. If the residual overlapped with and was comparable in strength to the H emission from NGC 2976, the spectrum was discarded (29 spectra were thrown out because of this consideration). This only occurred in places where the galaxy velocities were about km s-1 (see Figure 4). Individual frames of the same field were then averaged together (except for the cases noted above), weighted by exposure time if it was clear, or signal-to-noise ratio if there were clouds during the exposure. Velocities were calculated for each fiber by fitting a Gaussian to the observed H emission. Typical linewidths are 34 km s-1, and the median uncertainties on the Gaussian fit centroids are 0.77 km s-1; some fits have uncertainties as small as 0.04 km s-1, and a few are as large as 23 km s-1.
It was obvious from comparing frames that were taken several hours apart or on different nights that the telescope positioning accuracy for our observing procedure was only . We therefore designed an algorithm to determine the absolute positions that were observed based on our H image of NGC 2976, which is displayed in Figure 3. We sampled the H image with simulated “fibers” of the same size and location as the DensePak fibers, and added up the flux in each simulated fiber. By cross-correlating this set of photometric fluxes with the observed spectroscopic fluxes (integrated over the H line), we could measure the similarity between them. We repeated this process at a grid of positions around the expected pointing center and searched for the highest value of the cross-correlation function. We estimate that the accuracy of the positions derived with this method is 1″. The algorithm failed for one field, because only 15 of its fibers contained detectable signal, and very little emission was visible at that location in the image. For this field we assumed that the offset from the expected position was the same as the one we measured for the preceding exposure. Since this field is located ′ from the center of the galaxy, an error of a few arcseconds in its position is unlikely to be important. For the other 15 fields, the algorithm gave a smooth, well-defined peak with a cross-correlation coefficient between 0.81 and 0.996. We verified the results of the cross-correlation by finding the location of the minimum rms difference between the photometric and spectroscopic fluxes. This position was always within 1″ of the cross-correlation maximum. Fourteen of these 15 fields are located within 69 of their expected positions, and the other differs by 113.
2.3 CO Observations and Reductions
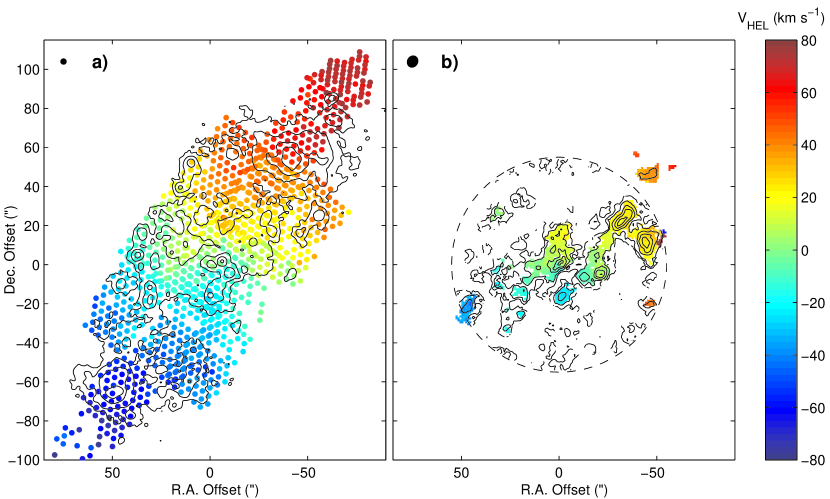
Our 12CO () observations were acquired using the B, C, and D configurations of the 10-element BIMA array (Welch et al., 1996) between April 2001 and March 2002. The total integration time was hours, much of which was in the most extended (B) configuration. The BIMA primary beam has a half-power diameter of , and we found CO emission spanning this entire width, including a cloud outside the primary beam at (see Figure 1b). For our observations, the spectrometer was configured with 2 km s-1 wide channels and a 260 km s-1 bandpass. The individual tracks were calibrated, combined, imaged, and deconvolved using the clean algorithm within the MIRIAD package. The tracks were then combined with natural weighting to create a ( pc) synthesized beam with a position angle (PA) of . The rms noise of the individual planes of the datacube is 24 mJy beam-1 in each 2 km s-1 channel. An integrated intensity contour map is displayed in Figure 1b, and a first moment map produced from a masked version of the datacube is shown in Figure 5b. Because the signal in a single channel was relatively weak, we used the first moments to represent the velocity at each position instead of attempting to fit Gaussians to the line emission. Typical uncertainties in the line velocities are 3 km s-1, and typical linewidths are 10-15 km s-1 across most of the galaxy, although some lines are as wide as 35 km s-1 near the center.
2.4 Optical and Near-IR Imaging and Reductions
We observed NGC 2976 with B, V, R, and I filters at the 1.8 m Perkins Telescope at Lowell Observatory on the photometric night of 2002 February 11. The detector was a Loral CCD with 15 m pixels and a 32 field of view, and the seeing was . We used exposure times of 600 s in B and 300 s in V, R, and I and observed three overlapping positions to cover the full extent of the galaxy. A three-color composite of these images is displayed in Figure 1a. To extend our set of images to the near-infrared, we used the 2MASS JHK Atlas images of NGC 2976. The 2MASS images are and have 1″ pixels, adequately sampling the seeing.
The optical data reduction, done in IDL, consisted of the following steps: overscan subtraction, dark subtraction, flatfielding, and cosmic ray removal. Several bad columns were fixed by adding or subtracting a constant so that their median values matched those of the surrounding columns; except for the constant offset, the fluxes in these columns do not appear to be systematically affected. The three images in each filter were then shifted and coadded. We observed several Landolt (1992) standard fields for photometric calibration, which was done with the IRAF implementation of daophot (Stetson, 1987). With the new standard stars in these fields identified by Stetson (2000) in addition to the original Landolt ones (we used Stetson’s magnitudes for all of the stars), we had 34 - 38 standard star measurements per filter. Our photometric solutions were derived from a least-squares fit to the following formula:
| (1) |
where is the apparent magnitude, is the instrumental magnitude (), is a constant that sets the instrumental zero point, is the color coefficient, is the color of the object, and is the extinction coefficient. Our observations did not span a large enough range of airmass to determine the extinction coefficient directly, so we used previously derived values. Reasonable ranges for the coefficients are mag airmass-1, mag airmass-1, mag airmass-1, and mag airmass-1 (P. Massey, private communication). For B and V, we used values of 0.27 mag airmass-1 and 0.15 mag airmass-1, which were the mean values of measurements made between 1997 and 1999 at the same telescope (D. Hunter, private communication). Lacking comparable measurements in R and I, we used the standard Lick Observatory values of 0.11 mag airmass-1 and 0.08 mag airmass-1, respectively. These fall within the reasonable ranges for both filters, and the Hunter B and V measurements are very close to the Lick values. Since all of our images were taken at airmasses close to 1.2, these assumptions are unlikely to cause significant errors.
In order to double-check our photometric solutions, we obtained the V- and I-band Keck222The W. M. Keck Observatory is operated as a scientific partnership among the California Institute of Technology, the University of California, and the National Aeronautics and Space Administration. The Observatory was made possible by the generous financial support of the W.M. Keck Foundation. images that Mendez (2002) acquired for the purpose of measuring the TRGB distance to NGC 2976. These images were taken with the Low-Resolution Imaging Spectrometer (Oke et al., 1995), and cover a field. Exposure times were 300 s in I and 400 s in V.
2.5 Surface Brightness Profiles
We used the IRAF routine ellipse in the STSDAS package to perform surface photometry on the images. The routine fits elliptical isophotes to a galaxy image at specified radii, and allows the position angle (PA), ellipticity, and center to change with radius. There is no evidence that the PA changes with radius, so we used the average value of 143°, identical to the cataloged PA of the galaxy (de Vaucouleurs et al., 1991, hereafter RC3). The ellipticity , which is related to the inclination angle via the formula , where , and are the major and minor axis lengths, and , varies from to in the inner part of the galaxy before converging to a constant value of 0.49 for . Galaxies often display such behavior, and it is not generally interpreted as a changing inclination angle with radius. Accordingly, we use an ellipticity of 0.49 for the whole galaxy. The corresponding inclination angle is 61.4°, the same as the RC3 inclination of 61.5° within the uncertainties. The center of the isophotal fits changed incoherently with radius before converging for . The isophotal center was within a few arcseconds of the visually obvious nucleus at ()= (09h47m15.3s, 67°55m00.4s), so we used the nucleus as the fit center. The coordinates of the nucleus coincide with the cataloged galaxy positions within their uncertainties (Cotton, Condon, & Arbizzani, 1999; Falco et al., 1999). We then ran ellipse again with all of the parameters fixed to produce the final surface brightness profiles. We fit ellipses every 2″ out to a radius of 172″, where the ellipses began to run off the edge of the image.
We also ran ellipse on the Keck images with the same parameters. This revealed some systematic differences between the Lowell and Keck photometry: although the profile shapes were quite similar in the two datasets, the Lowell V magnitudes are 0.1 mag brighter than the Keck V magnitudes, and the Lowell I magnitudes are 0.1 mag fainter than the Keck I magnitudes. The cause of this discrepancy is not clear, and it is worrisome because a 0.2 mag change in the galaxy color is significant. However, as we will show in §3.1, the measured Lowell colors all predict stellar mass-to-light ratios that are consistent with one another, while the Keck color predicts a noticeably higher mass-to-light ratio that is inconsistent with the other determinations. An additional piece of evidence in favor of the Lowell magnitudes is that the tabulated color in, e.g., the RC3 is close to our measured value, so we conclude that it is safe to assume that our Lowell photometry is accurate. Since the LRIS field of view is larger than that of the Lowell CCD, we also used the Keck images to verify that the light profile does not change shape at larger radii, and to measure the fraction of the total flux that we missed due to the limited extent of the Lowell mosaic. We estimate that of the galaxy’s light is contained within the ellipse out to which we measured, so our integrated magnitude measurements should probably be revised upwards by 4 % (0.04 mag).
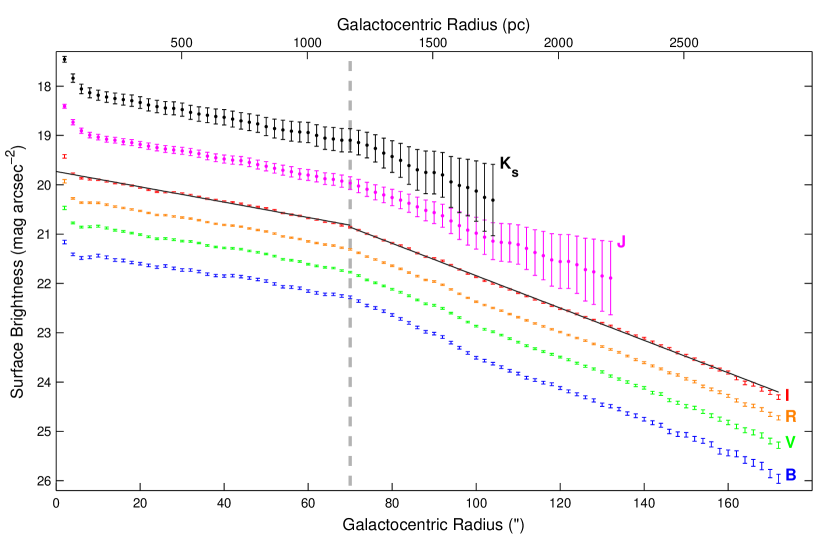
The measured surface brightness profiles are corrected by applying the Schlegel, Finkbeiner, & Davis (1998) Galactic extinction estimates in each band. To account for extinction within NGC 2976, we used an inclination-based approach, as described by Sakai et al. (2000). Sakai et al. (2000) give internal extinction coefficients for all of the bands we use except J, so to determine the J-band correction we interpolated their results from the other bands and found that . For our best-fit axial ratio of 1.96, we estimate that the internal extinction in magnitudes in the seven bands is (from B to K): 0.23, 0.20, 0.18, 0.13, 0.11, 0.07, and 0.03.
The surface brightness profiles, displayed in Figure 5, are qualitatively similar in all of the filters. NGC 2976 clearly contains three components: a nucleus, an exponential inner disk, and an exponential outer disk. Since the nucleus is not resolved in any of our images, we used the HST/NICMOS images acquired by Böker et al. (1999) to estimate that its radius is less than 036 (6 pc). It seems to be too reddened to reliably derive a mass-to-light ratio from its colors. The nuclear luminosity is , so the rotation velocity due to the nucleus is km s-1, where is the stellar mass-to-light ratio of the nucleus in solar units. If we assume that the mass-to-light ratio is the same as the maximum allowable value for the disk (see §4.2), the nucleus becomes dynamically insignificant outside 10″. Because the nucleus is probably a large cluster of young stars (judging by its compactness, luminosity, and H emission), its actual mass-to-light ratio is likely much lower. Parameters for the disk of NGC 2976 in each band are listed in Table 1. The presence of an outer exponential disk, with a surface brightness that declines more quickly than would be expected from extrapolating the inner disk, has been seen in other spiral galaxies (Näslund & Jörsäter, 1997; Pohlen, 2001; Pohlen et al., 2002, hereafter PDLA). The ratio of the inner scale length to the outer scale length is 2.1, consistent with the value of measured by PDLA for four other galaxies. In fact, NGC 2976 only differs from the galaxies PDLA observed in that the break between the inner and outer disks occurs close-in, at 1 inner disk scale length instead of scale lengths. NGC 2976 is an order of magnitude less luminous than the galaxies in the PDLA sample, suggesting that the break radius might be a function of luminosity.
3 BARYONIC COMPONENTS OF NGC 2976
Because our images of NGC 2976 do not reveal a bulge or a bar, and its nucleus is dynamically unimportant, the only relevant reservoirs of baryons to consider are the stellar and gaseous disks.
3.1 The Stellar Disk
There are two obvious approaches to studying the importance of the stellar contribution to a galaxy rotation curve: 1) compare multicolor surface photometry of the galaxy with the predictions of stellar population synthesis models to obtain an estimate of the stellar mass-to-light ratio () that is independent of the galaxy kinematics, or 2) leave as a free parameter while simultaneously fitting a scaled stellar disk and a dark matter halo to the observed rotation curve. The second technique has a very significant drawback: is insensitive to changes in during rotation curve fits (McGaugh & de Blok, 1998; Swaters, 1999; Bolatto et al., 2002), so the fit with the lowest value of does not necessarily convey any information about the value of . As an illustration of this effect, the best fit often turns out to be , even though that is clearly not correct. We would therefore like to have an independent constraint on the mass-to-light ratio so that we do not have to leave it as a free parameter. For this reason, and because we have BVRIJHK photometry available, we choose the first method.
3.1.1 Population Synthesis Constraints On
One way to estimate a stellar mass-to-light ratio from photometry alone is to use the semi-empirical relationships derived by Bell & de Jong (2001). Bell & de Jong (2001) showed that the colors of spiral galaxies are strongly correlated with the mass-to-light ratios of their stellar populations. With our multicolor photometry, we can construct the entire array of colors for which they give formulas, and then calculate the expected mass-to-light ratios, which are listed in Table 3. The average predicted values from the six tabulated inner disk colors are in K band333We will mostly use the K-band stellar disk for the remainder of the paper for the following reasons: 1) K-band light is the best tracer of the stellar mass distribution and the least skewed by luminous young stars from recent star formation, and 2) K band is the least affected by extinction., and in R band. That all of the colors predict consistent mass-to-light ratios is an indication that the predictions have some validity for this galaxy. It must be noted, however, that the Bell & de Jong (2001) mass-to-light ratios are derived assuming that galaxies have maximal disks. If the average galaxy has a disk that is a factor () less than maximal, then the predicted mass-to-light ratios from their calculations must also be scaled by the same factor . A further uncertainty in this analysis is the initial mass function (IMF), which may not follow the assumed scaled Salpeter form, particularly at low masses.
An alternative method to measure photometrically is to compare the observed colors directly to the outputs of publicly available stellar population synthesis models. We used the Starburst99 population synthesis models (Leitherer et al., 1999) to attempt to constrain in this way. For a given star formation history (constant star formation rate or instantaneous burst of star formation), Starburst99 predicts colors and luminosities as a function of time. This allows us to search systematically for the population age that matches the observed set of colors most closely. The two best Starburst99 models are 1) a population with a small (10 %) young component that has been forming stars continously, and the remaining stars in an old ( Gyr) population that formed in an instantaneous burst, and 2) a very young ( yr old) starburst. However, the mass-to-light ratios of these models seem rather implausible: for model 1) and for model 2). Neither of these values is compatible with observed values of in the few other galaxies for which measurements are available (e.g., Olling & Merrifield, 2001; Vallejo, Braine, & Baudry, 2002) or with the predictions of Bell & de Jong (2001). We also tried the online population synthesis code described by Worthey (1994), which predicts colors and mass-to-light ratios for an arbitrary combination of input stellar ages and metallicities. It is more difficult to do a comprehensive search through the likely parameter space with this technique, but we did find that a mixture of 70 % of an old (but metal-rich) population and 30 % of a young population ( Gyr) comes close to reproducing the observed colors (assuming a Miller-Scalo IMF), yielding a mass-to-light ratio of 0.31 .
We conclude that it is not possible to uniquely determine the for NGC 2976 by comparing the galaxy colors with the predictions of current population synthesis models. From this information alone, NGC 2976 could contain either a very young starburst, or a normal, mixed stellar population with a low to moderate (0.3 to 0.5) . There are three reasons for discounting the starburst possibility in NGC 2976. First, the colors of the outer disk of NGC 2976, where our observations show no evidence for widespread star formation, are very similar to the inner disk colors, particularly in the near-infrared where extinction is less important (as shown in Table 3). It is unlikely that the galaxy contains a starburst and an old population that coincidentally have the same observed colors. Second, the starburst would have to be unusually young (in which case our observations of it at this particular time are rather fortuitous), and also quite strong, dominating not only the light output from the galaxy, but also containing a significant fraction of its total stellar mass (otherwise the mass-to-light ratio would begin to run into the kinematic limit; see §4.2). And finally, the visual appearance of the galaxy is not suggestive of a vigorous starburst. The more likely alternative is that NGC 2976 has a substantial old component to its stellar population, driving toward the values of a few tenths that are seen in other galaxies.
3.1.2 Rotation Velocities Due to a Thin Disk
In order to compare the stellar rotation velocities to the observed rotation curve, we calculate the rotation velocities for material confined to a thin disk. Because the disk of NGC 2976 is not a pure exponential, its rotation curve must be calculated numerically. We perform the calculation with the routine ccdpot, which is based on a derivation given by Binney & Tremaine (1987), in the NEMO package (Teuben, 1995). This rotation curve is similar to that from the fitted exponential disk out to the breakpoint between the inner and outer disks, where it briefly exceeds the exponential disk rotation curve, and then begins to decline more quickly (as expected, since the surface density at large radii is lower than in the single exponential case). Our calculations assume an infinitely thin disk for simplicity; allowing the disk to have some thickness leaves the shape of the rotation curve almost unchanged, but lowers its amplitude, thus raising the allowed (Swaters, 1999; Peng et al., 2002). For a scale height equal to 1/6 of the disk scale length, the rotation curve is lowered by about 10 % (Peng et al., 2002), so that the allowed may be 20 % higher than in the infinitely thin case (since ).
3.2 The Gas Disk
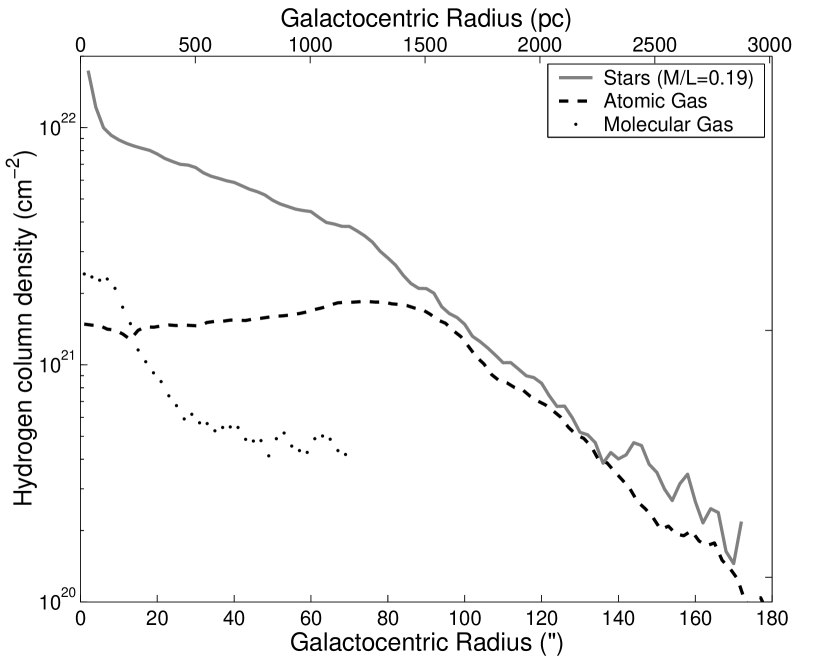
The atomic and molecular gas disks of NGC 2976 do not contribute appreciably to its measured rotation curve. Although it is rich in CO for a dwarf galaxy, the measured total flux of Jy km s-1 over the central 750 pc (Young et al., 1995) implies only of molecular gas (including helium), if the Galactic CO-H2 conversion factor is valid in NGC 2976. The total molecular mass might be somewhat larger, because the BIMA observations did not cover the large H II regions at either end of the inner disk, which are likely associated with molecular clouds. Nevertheless, the molecular material is not dynamically significant globally or locally, regardless of how it is distributed. The atomic gas mass is much larger, at (Appleton et al., 1981; Stil & Israel, 2002a). We adapt the H I surface density distribution from the data presented by Stil & Israel (2002a). The stellar, atomic, and molecular surface densities are plotted in Figure 6. Even with a low , the stars are clearly the dominant reservoir of baryons in NGC 2976. It is noteworthy that the H I and stellar scale lengths in the outer galaxy appear nearly identical, and the surface densities are comparable as well. We calculate the rotation curves of the gaseous components directly from their surface density profiles (again assuming zero thickness) using the same method as for the stars.
4 ROTATION CURVE AND DARK MATTER HALO OF NGC 2976
Now that we have a handle on the behavior of the stellar and gas disks of the galaxy, we can move on to our primary goal of constraining the structure of the dark matter halo. First, we convert our two-dimensional velocity field into a one-dimensional rotation curve. This is accomplished by fitting tilted-ring models to the velocity field using three complementary techniques. The algorithms are mentioned briefly below, and more detailed descriptions are given in Appendix A. Rotcur breaks the velocity field into rings and fits for the PA, inclination, center, systemic velocity, and rotation velocity in each ring. Ringfit also divides the galaxy into rings, and it fits for the rotation velocity, the radial velocity (in the plane of the galaxy), and the systemic velocity in each ring. Ringfit thus has the desirable feature that a simple form of noncircular motions are included in the fit. The third algorithm, rotcurshape, fits the entire velocity field with a single PA, inclination, center, and systemic velocity, and also assumes a functional form for the rotation curve and solves for the parameters of that function. Fit results are similar for all three procedures, although fitting for radial velocities in addition to rotation does make the rotation curve somewhat shallower (see §6.2).
4.1 Rotation Curve of NGC 2976
It is apparent from the data (Figure 4) that the velocity field near the center of the galaxy cannot be adequately described by rotation alone. There are two choices for how to proceed: 1) use additional Fourier terms to describe the velocity field, or 2) allow for changes in the position angle of the galaxy with radius. The second possibility, which is difficult to reconcile with the photometry, is discussed in §5.5; for now, we will use Fourier analysis to provide an accurate description of the velocity field. The next Fourier term beyond pure rotation (, where is the angle from the major axis in the plane of the galaxy; see Appendix A) is pure radial motions (). We have investigated the decomposition of the velocity field using higher order terms, and found that they are much smaller than the rotation and radial components and are consistent with noise. Therefore, we leave those terms out of our subsequent analysis.
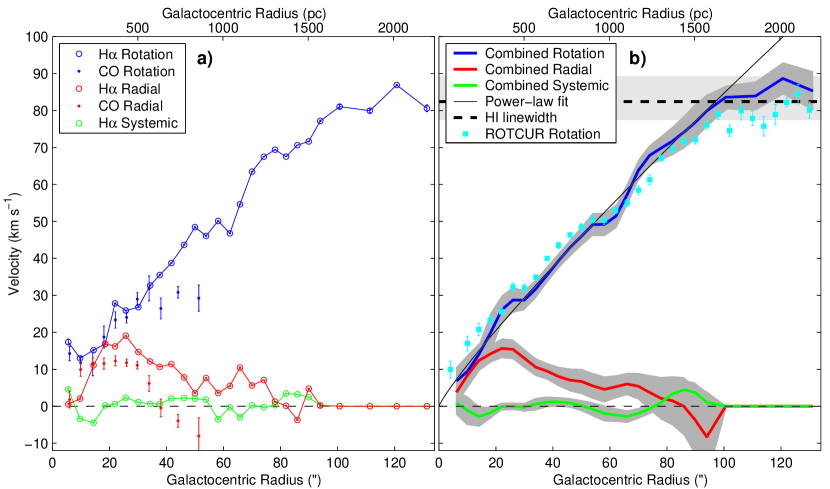
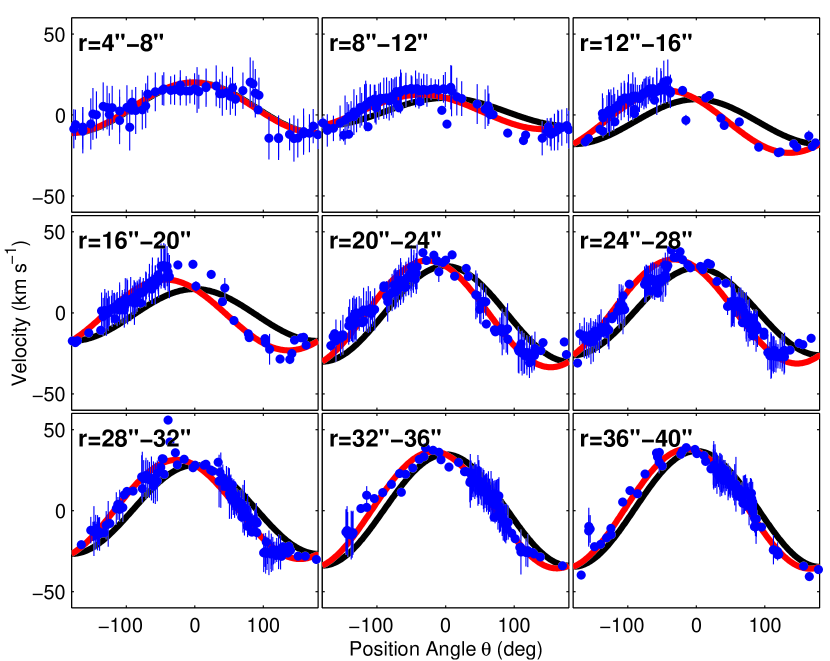
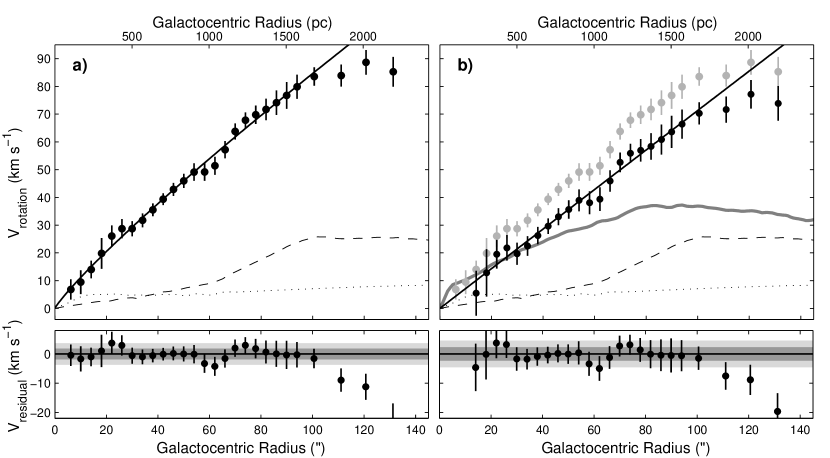
Our final rotation curve was derived with ringfit, so that we could account for the radial motions that are present in the velocity field. We first fit the H and CO velocity fields separately to verify that they agree with each other, as displayed in Figure 7a. At small radii (), it is evident that the derived rotation curves and radial motions do agree, although they begin to diverge somewhat at . However, the CO ring fits at these radii are based on only one or two independent measurements, so the apparent difference between the CO and H velocity fields is not significant. Therefore, we combine the two datasets and fit again, weighting each data point by the inverse square of its statistical uncertainty. The fits for rings at are displayed in Figure 8, where it is apparent that the velocity maxima do not lie along the major axis. This indicates the presence of radial motions, which could not have been measured with longslit observations or rotcur fitting. The rotation curve from these fits is plotted in Figure 7b, and the significance of the radial velocities is again apparent. The estimated systematic uncertainties (the derivation of which is described in §6.2) are shown by the shaded gray areas surrounding each curve.
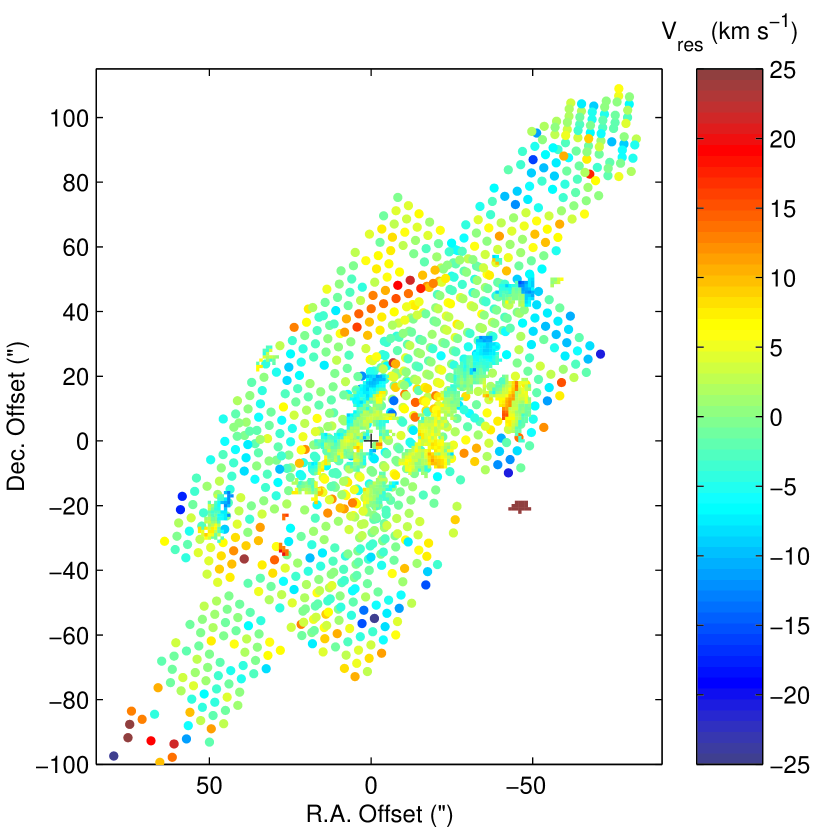
The residual velocity field after subtracting this best-fit model is displayed in Figure 9. Although individual residuals are occasionally as large as 30 km s-1, the rms of the residual field is 6.4 km s-1, and there are no obvious systematic trends. The random velocity variations in the residual map are much larger than the uncertainties in the observed velocities, and the value of 6.4 km s-1 is consistent with the random velocities of gas observed in other galaxies; the residuals therefore likely represent real small-scale structure in the velocity field. The rotation velocities and radial velocities with their associated uncertainties, and the stellar and gas rotation curves, are all listed in Table 2. In order to incorporate more accurately the uncertainties in the rotation curve, the values listed in Table 2 and plotted in Figure 7b are the mean values obtained from a Monte Carlo study rather than directly from the data (see §6.2.6).
The rotation curve of NGC 2976 is well-described by a power law from the center of the galaxy out to a radius of almost 2 kpc, as displayed in Figure 10a. The residuals after subtracting the fit from the rotation curve are shown in the bottom panel. The rotation curve only begins to deviate systematically from power-law behavior at (1.84 kpc). The total (baryonic plus dark matter) density profile corresponding to the rotation curve is pc-3 (see Appendix B, Equations B2 and B3, for the conversion between power laws in velocity and density). This density profile is the mean of the fits to 1000 Monte Carlo rotation curves, which represents a more accurate estimate of the uncertainties than the fit to the single rotation curve shown in Figure 7b. In the following subsection, we show that the density profile of the dark matter halo alone follows a shallower power law.
A key assumption underlying the derivation of this density profile is that the orbits are circular, and therefore that the gravitational and centripetal forces are in equilibrium. This assumption is not likely to be correct in detail, but an inversion of the velocity field (including noncircular motions) to obtain the underlying nonaxisymmetric potential is beyond the scope of this paper. Nevertheless, we note that the radial motions are comparable in magnitude to the rotation only for the inner four points of the rotation curve (the central 300 pc of the galaxy). At larger radii the rotation clearly dominates, and the orbits are nearly circular. If we fit the rotation curve using only points between 300 pc and 1.8 kpc — where the radial motions are probably unimportant — the derived density profile is almost identical to the one described in the previous paragraph. This suggests that a more complete analysis of the effect of noncircular motions on the inversion from a rotation curve to a density profile should not have a large impact on the derived slope of the density profile.
4.2 Limits on the Dark Matter Halo
To reveal the shape of the density profile of the dark matter halo, we first remove the rotational velocities contributed by the baryonic components of the galaxy. The rotation curve of the dark matter halo is defined by
| (2) |
We determine the lower limit to the dark matter density profile slope by maximizing the rotation curve contribution from the stellar disk. The maximum possible stellar rotation curve is set by scaling up the mass-to-light ratio of the stellar disk until the criterion
| (3) |
is no longer met at every point of the rotation curve. This requirement sets maximum disk mass-to-light ratios of and , where the uncertainties are calculated by replacing with in Equation 3.
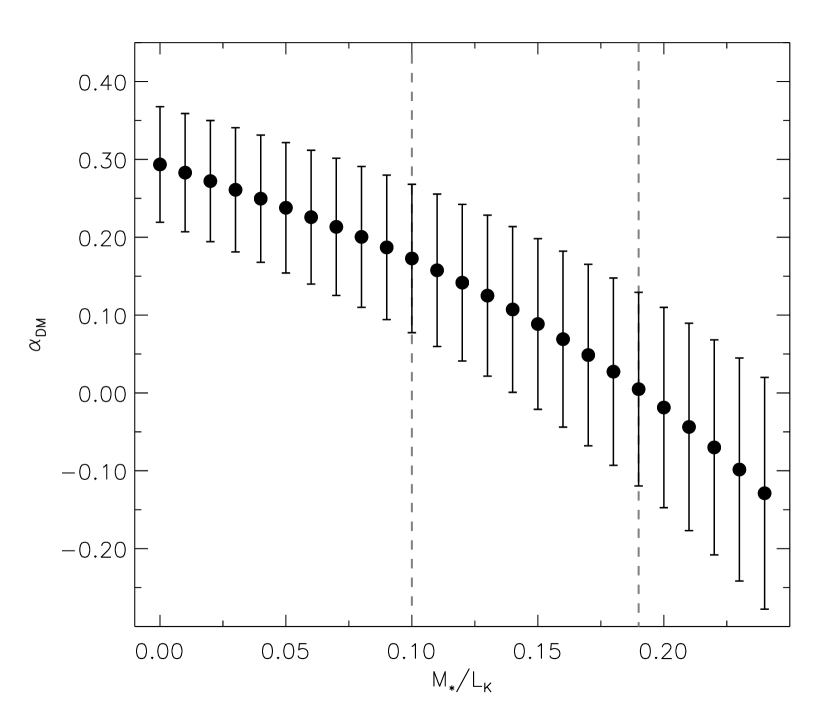
We now use Equation 2 to obtain the rotation curve due to the dark halo. Under the assumption that the density profile can be described with a power law, , we perform a linear fit to determine as a function of . The fit extends out to a radius of 105″, and we ignore points that have imaginary halo rotation velocities. A power law provides a good fit to the halo rotation curve for any mass-to-light ratio. The results of these fits are plotted in Figure 11. For , and the density of the dark matter halo is increasing with radius. Because such a dark matter configuration is probably unphysical, we consider 0.19 to be a firm upper limit to the stellar disk mass-to-light ratio, with the corresponding lower limit to of 0. The dark matter density profile for this maximal disk is
| (4) |
As we argued in §3.1.1, the only way that the stellar mass-to-light ratio can be lower than this value is if the galaxy contains a young starburst, so Equation 4 represents the most likely shape for the dark matter halo. Note that even though the kinematic value of we derive is rather low, there are two effects that we have not accounted for that tend to raise it: the finite thickness of the stellar disk (§3.1.2), and asymmetric drift (§6.2.7). Including these effects raises the maximum disk close to the range that is predicted from the photometry.
The slope of the total density profile of the galaxy represents the absolute upper limit for the slope of the dark matter density profile, so . In practice, because the galaxy contains stars and gas, the upper limit must be lower. If NGC 2976 is not undergoing a strong and very young starburst, its stellar mass-to-light ratio must be at least 0.10 .
Therefore, we conclude that the dark matter density profile is bracketed by and (see Figure 11). Due to the extremely low value of the maximal disk mass-to-light ratio, the galaxy must contain an essentially maximal disk. We adopt the disk and halo, which are shown in Figure 10b, as our preferred solution for the rest of the paper. This disk dominates the gravitational potential of the galaxy out to a radius of 35″ (550 pc). The total mass of NGC 2976 out to the edge of the observed velocity field at 2.2 kpc is , of which 5 % is contributed by the gas, and up to 14 % (for ) is contributed by the stars.
5 DISCUSSION
5.1 Comparison to Cold Dark Matter Simulations
In the previous section, we derived the dark matter density profile of NGC 2976, and determined that it cannot have a slope steeper than . Even in this minimum disk case an NFW halo in NGC 2976 is ruled out.
5.1.1 Does the Density Profile of NGC 2976 Conflict With CDM?
The shallow central density profile of NGC 2976 does not necessarily imply a problem with CDM. It is also possible that the simulations and the observations may not be directly comparable, or that the simulations may not incorporate all of the relevant physics. Our observations have only probed the very inner portion of the galaxy’s potential, whereas the numerical simulations are better at revealing the density structure at large radii. The highest-resolution simulations can reach radii as small as 0.5 % of the virial radius (Power et al., 2003). An NFW halo comparable in size to NGC 2976 would have a virial radius of kpc, so a simulation resolution element would be 400 pc in the best case. There would then be resolution elements within the observed region of the galaxy, which might not be enough to accurately determine the slope of the density profile over those radii. It is therefore plausible that higher-resolution simulations could help to resolve the apparent conflict between the observational and theoretical results. It is also worth noting that none of the CDM simulations reported in the literature to date have explored galaxies as small as NGC 2976. Although the simulated density profiles appear to be independent of mass, simulated dwarf galaxies could conceivably have different density profiles than the large galaxies and galaxy clusters that have thus far been studied. Finally, we point out that the current dataset just reaches what appears to be the peak of the rotation curve; it would be extremely interesting to trace the rotation curve farther out as it presumably flattens and turns over. We are in the process of using recently-obtained VLA H I observations to carry out this study.
Beyond numerical effects, though, there are more important reasons to suspect that the simulations may not correspond well to the observations. One potentially significant problem with current simulations is that they neglect the effects of the baryons on the dark matter halo. As we have shown, the central region of NGC 2976 is dominated by the stellar disk. It is possible that the formation of a massive disk at the center of a cuspy spherical halo could destroy the central cusp (Weinberg & Katz, 2002, although see Gnedin & Zhao (2002)).
An additional possibility for accounting for the very shallow central density profile within the context of CDM is suggested by the recent work of Stoehr et al. (2002) and Hayashi et al. (2003). These authors find in their simulations that dark matter satellite halos orbiting in the potential of a more massive neighbor are subject to tidal stripping. The stripped satellites end up with density profiles that are much shallower than their original NFW profiles. If NGC 2976 can be identified with one of the most massive few dark matter satellites of M 81, this mechanism provides a natural way to explain its nearly constant-density dark matter halo without modifying the CDM model.
We conclude that the solution to the density profile problem does not currently require fundamental changes to CDM. There are a number of simpler explanations that may remedy the discrepancy between observations and simulations. More complete simulations can help to clarify the situation, as can more carefully targeted high-resolution observations (for example, studies of a few isolated galaxies could confirm or refute the possibility that density profiles are being modified by tidal stripping).
5.1.2 NFW and Pseudoisothermal Fits for NGC 2976
Up to this point, we have used power law fits to describe the rotation curve and density profile, giving us a straightforward measurement of the central slope444Note that in general a power law is not a good representation of the expected CDM density profile form, which has a logarithmic slope that varies from to . Our measurements, however, are all within the characteristic radius of the halo of NGC 2976, where the density profile predicted by CDM is close to a power law.. This method has two advantages over the traditional approach of fitting the rotation curve with various observationally or theoretically motivated functional forms to see which one best matches the data. First, it is model-independent. Second, some functional forms (NFW, for example) require that the data cover a certain range of radii in order to constrain the fit parameters. An NFW rotation curve reaches its maximum at and then turns over. If the velocity data do not extend beyond the turnover radius, the scale radius (and hence the concentration parameter) of the halo cannot be reliably measured.
Although we argue that the power-law approach may be more useful, we recognize that performing NFW and pseudoisothermal fits to our data will facilitate comparisons to previous work. Accordingly, we have used the rotcurshape routine (Appendix A.3) to attempt to find best-fitting parameters for the velocity field of NGC 2976, assuming each of those functional forms for the rotation curve. An isothermal halo with a constant-density core provides a reasonable fit to the data, with a core radius of 67″ (1.12 kpc) and an asymptotic velocity of 130 km s-1. This fit is comparable in quality to the power law fit. For an NFW rotation curve, rotcurshape cannot obtain a satisfactory fit for any value of the concentration. We also attempted to fit the NFW form just to the rotation curve (not the full velocity field) with various nonlinear least-squares techniques. Because we know that the rotation curve of NGC 2976 is shallower than an NFW rotation curve, we fixed the concentration parameter at an artificially low value (, lower than expected; Bullock et al. (2001)) for these fits, and only solved for and . We found that neither nor are significantly constrained by the rotation curve of NGC 2976. The best NFW fits have a reduced value of 6.2 (compare to a reduced of 1.3 for a power law fit), and the NFW rotation curve only passes within (combined statistical and systematic uncertainties) of 2 out of the 27 points in the rotation curve. The remainder of the fitted points are up to away from the data points, showing that an NFW rotation curve is very strongly excluded for this galaxy. Note that both the pseudoisothermal and NFW fits described here were performed on the total mass distribution of the galaxy, not just the contribution from the dark matter halo. Removing the stellar and gas disk velocities first would make the NFW fit worse.
Although our velocity field does not extend beyond the turnover of the rotation curve and NFW fits to the rotation curve are unconstrained, there is another way to estimate the NFW concentration parameter, and the effective concentration parameters for other dark halo models from the data. Alam, Bullock, & Weinberg (2002) defined the parameters (the radius at which the rotation curve has risen to half of its maximum value) and (the mean density within , in units of the critical density) in order to make it easier to compare rotation curve observations with theoretical predictions. For the minimum disk case in NGC 2976, km s-1, pc and . Using the formulae given by Alam et al. (2002), we calculate concentrations of 18.5, 4.1, 51.5, and 225.4 for an NFW profile, a Moore profile, a Burkert profile, and an isothermal+core profile, respectively. For our preferred solution, after accounting for the stellar and gas disks, the dark matter halo parameters are km s-1, pc and , reducing the concentrations to 14.5, 3.1, 40.8, and 165.0.
The Alam et al. (2002) analysis is designed to study the value of the central density of the dark matter halo (which is also a potential point of disagreement between observations and simulations). With or without accounting for the baryonic contribution to the rotation curve, the central density of the dark matter halo of NGC 2976 (parameterized by Alam et al.’s definition of ) is consistent with CDM simulations, even though the shape of the density profile is not.
5.2 Comparison to NGC 4605
NFW suggested, and most subsequent authors have agreed, that relaxed CDM halos should all have the same shape independent of mass or merger history555Provided that they have not recently undergone a major merger. There is no kinematic or photometric evidence to suggest that either of the galaxies discussed here was recently involved in a merger.. NGC 2976 is superficially rather similar to the first galaxy we studied, NGC 4605, so it is reasonable to compare the two. Our observations of NGC 4605 showed that its dark matter halo has a density profile with (Bolatto et al., 2002). At first glance, this result does not appear to seriously conflict with our findings for NGC 2976. However, the NGC 4605 density profile was for a maximal disk, and therefore represents a lower limit on . We argued that the maximum disk solution was the most likely for NGC 4605 because the mass-to-light ratio could not realistically be much smaller than its maximum value of 0.22 in that galaxy, and because it leads to a simpler density structure for the halo (a single power law rather than two).
For NGC 2976, by contrast, we set an upper limit of for the minimum disk case, and we prefer lower values of because a minimum disk is not physically realistic. For solutions in the range that we believe is reasonable (), the dark matter density profile slope disagrees with that of NGC 4605 by up to , even though the disks of these two galaxies are quite similar. Although we have only examined two galaxies so far, their incompatible dark matter density profiles suggest that the cosmic scatter in halo properties may be large.
5.3 Are All Dwarf Galaxies Dark-Matter Dominated?
It is generally assumed that, with the possible exception of tidal dwarfs (Barnes & Hernquist, 1992), all dwarf galaxies are dynamically dominated by dark matter (Carignan & Freeman, 1988; Carignan & Beaulieu, 1989; Jobin & Carignan, 1990; Martimbeau, Carignan, & Roy, 1994). While this assumption is likely true for the outer parts of dwarfs (radii larger than times the disk scale length), the observational evidence is more ambiguous close to their centers. One of the main sources of this problem is that dwarf rotation curves are traditionally observed in H I, with angular resolution as low as 30″. The rotation curves therefore often contain only two or three data points at radii where the stellar and gas disks are dynamically important. To make matters worse, these inner data points are the most likely to be affected by beam smearing and other systematic problems. We suggest that higher resolution observations of dwarf galaxies may show that their central regions are often dominated by luminous material.
In the case of NGC 2976, the baryonic mass dominates the central 220 pc of the galaxy even for the lower limit to of 0.10 . For our preferred solution of a maximal disk (), the disk dominates out to a radius of 550 pc. Consequently, the stellar disk has a significant impact on the derived density profile of the dark matter halo: slopes ranging from to are possible depending on the choice of (see Figure 11).
That stars contribute to the dynamics of a dwarf galaxy is not unique to NGC 2976; similar conclusions were reached for NGC 1560 by Broeils (1992), for NGC 5585 by Blais-Ouellette et al. (1999), and for NGC 4605 by Bolatto et al. (2002). In addition, this result is also in agreement with the work of, e.g., Persic, Salucci, & Stel (1996, hereafter PSS), who showed that the fraction of dark mass in spiral galaxies is a strong inverse function of luminosity. PSS found that in galaxies with luminosities comparable to NGC 2976 (), dark matter can be detected gravitationally beginning at of the optical radius (which is located at 2.8 kpc for NGC 2976), or about 350 pc. This is entirely consistent with our mass modeling (see Figure 10b). The average rotation curve constructed by PSS has dark matter dominating the rotation curve at radii beyond (560 pc), also consistent with our preferred solution. Thus, even though it may seem counterintuitive, the PSS results support our conclusion that luminous matter is sometimes an important contributor to the inner rotation curves of dwarf galaxies.
5.4 Are the Kinematics of NGC 2976 Affected By M 81?
NGC 2976 does not appear to be participating in the dramatic tidal interaction currently taking place between M 81, M 82, and NGC 3077 (Yun, Ho, & Lo, 1994); however, it has likely interacted with M 81 in the past. Appleton, Davies, & Stephenson (1981) discovered a faint H I streamer stretching from M 81 to NGC 2976. Boyce et al. (2001) used HIJASS data to show that this gas comprises a single tidal bridge that smoothly connects the two galaxies (see their Figure 2a). The bridge contains somewhat more H I than NGC 2976 itself ( M⊙ and M⊙, respectively). Unfortunately, the HIJASS observations lack the angular resolution to see the details of the connection between the bridge and NGC 2976, and the presence of Galactic H I further complicates the situation. Yun, Ho, & Lo (2000) suggested that the bridge is a remnant of an interaction that took place only between M 81 and NGC 2976 before the current M 81/M 82/NGC 3077 event. Nevertheless, the optical galaxy (Figure 1) and the inner H I disk (Stil & Israel, 2002a, b) both appear regular, symmetric, and undisturbed. Assuming that M 81 has a total mass of (Karachentsev et al., 2002), its tidal field only becomes comparable to the gravity of NGC 2976 (at a radius of 2 kpc) if the galaxies approach within 20 kpc of each other. Since M 81 is currently at a projected distance of 79 kpc, the present-day kinematics of NGC 2976 are probably unaffected by the interaction.
5.5 Possible Origins of Noncircular Motions
In Figure 4a it is clear that the velocity field of NGC 2976 is distorted compared to a purely rotating disk. The velocity gradient near the center of the galaxy is not directed along the photometric major axis, but is offset by up to (see Figure 8). This twisting of the isovelocity contours means that the kinematics of NGC 2976 cannot be described by the simplest model: a constant PA and only rotational motions. We have shown that the velocity field can be adequately described by adding radial motions in the plane of the galaxy to the model. If there are systematic trends remaining after this model has been subtracted from the data, they are only present at the level of a few km s-1 (see Figure 9). However, a purely rotational velocity field with a kinematic PA that declines monotonically from near the center of the galaxy to at a radius of 90″, and remains constant at for larger radii can also fit the data. This model is the one produced by rotcur if the kinematic PA is left as a free parameter (see Appendix A.1). The total density profile obtained under these assumptions is . Since the photometric PA of the galaxy is quite stable, varying only a few degrees from its average value beyond a radius of 30″ (at smaller radii, local bright spots dominate the isophotal fitting), this model requires a physical mechanism that could cause the behavior of the photometric and kinematic PAs to deviate strongly from one another. It is unclear what such a mechanism could be, and why it would make the kinematic PA change so rapidly. Because this model lacks an observational motivation, while radial (or other noncircular) motions are expected to occur naturally for a variety of reasons (see below), we prefer the radial motion interpretation of the velocity field.
There are a number of possible sources of the radial motions. The galaxy could contain a stellar bar, although there is no sign of a bar in any of our images, even at 2.2 m. Further evidence against the presence of a bar is the lack of measurable higher order terms in our harmonic decomposition of the velocity field. The velocity field of a barred galaxy should contain a nonzero term (Wong, 2000). An alternative to a bar is the possibility that the dark halo is triaxial rather than spherical, as we have assumed. It is expected that CDM halos should be at least moderately triaxial (Dubinski & Carlberg, 1991; Warren et al., 1992; Cole & Lacey, 1996), and the potential of a triaxial halo is certainly not axisymmetric, so the velocity field of a galaxy embedded in a triaxial halo would exhibit noncircular motions. However, since the details of such a velocity field have not yet been simulated, we cannot compare our results to theoretical predictions. Future simulations of the kinematics of a gaseous disk within a triaxial halo would be quite interesting. Other potential causes of the radial motions include a disk that has nonzero ellipticity, and outflows associated with star formation.
6 SYSTEMATICS
In this section, we study in detail the systematic uncertainties in our analysis, and also some systematic problems that afflict rotation curve studies in general. We emphasize that systematic effects are the dominant source of uncertainties in our analysis. Some of the details contained in this section are therefore crucial to understanding the reliability of our conclusions. The general reader may wish to use the summary in the following paragraph and the subsection headings to select the portions in which he or she is interested.
We begin in §6.1 by mentioning the importance of considering systematic problems, and our efforts to account for these problems in the design of our survey. Section 6.2 continues with a description of our tests for systematic errors caused by the rotation curve fitting. In §6.3 we demonstrate that the H and CO velocity fields of NGC 2976 are consistent with each other, not just globally, but on a point-to-point basis. In §6.4 we use our velocity field to simulate longslit observations of NGC 2976, and compare the derived longslit density profiles to the one we extract from the two-dimensional velocity data. Section 6.5 examines the problem of offsets between the kinematic center of a galaxy and the position of the slit during spectroscopic observations, and §6.6 briefly discusses the difficulties that barred galaxies present for density profile studies.
6.1 The Problem of Systematics
It is well-known, although not often discussed, that there are a number of serious systematic uncertainties that can cause an observed rotation curve (and the associated density profile) to differ significantly from the true one. Worse, nearly all of these effects work in the same direction to cause density profiles to appear systematically shallower than they actually are. Fortunately, the most severe of these problems can be minimized or avoided by using two-dimensional velocity fields and by making velocity measurements at very high precision (Blais-Ouellette et al., 1999; van den Bosch & Swaters, 2001; Swaters et al., 2002; Bolatto et al., 2002). SMVB model several of these effects in detail and determine how severely observational results may be affected in various situations. One of the key systematics to investigate is the location of the dynamical center of the galaxy with respect to the assumed center. Other systematic errors that might potentially cause problems for rotation curve studies include extinction (for H observations), beam smearing (for H I observations), noncircular motions (which could be caused by a bar, an intrinsically elliptical disk, a triaxial halo, or outflows associated with vigorous star formation), incorrect galaxy centers, PAs, inclinations, and systemic velocities, asymmetric drift, and using observations made at low velocity resolution to study galaxies with small rotation amplitudes. We designed our study so as to avoid some of these problems, and to be able to account for the others, as described in the introduction; a few key points are mentioned below. We know that extinction does not affect our results because our CO and H velocity fields agree near the center of the galaxy, where extinction should be most important. Since we have two-dimensional information, we can explicitly account for radial motions, as discussed in §4, §6.2, and Appendix A. Our velocity resolution is times smaller than the maximum rotation velocity of NGC 2976 (and the precision of our velocity measurements is another order of magnitude smaller), so we are unlikely to be missing significant features in the velocity field due to insufficient resolution.
6.2 Rotation Curve Fitting Systematics
Due to the high precision of our velocity measurements, the statistical error bars on both the rotation curve and the radial velocity curve are negligible (less than 1 km s-1 everywhere). Therefore, the limiting factors on the accuracy of the rotation curve are the systematic uncertainties associated with our fit, which is a normal state of affairs for rotation curve and density profile observations.
6.2.1 Algorithmic Differences
The most straightforward check for systematic problems is to compare the rotation curves produced by different algorithms. Recall that neither rotcur nor rotcurshape allow the user to fit for the term (radial motions) in Eq. A2, and ringfit and rotcurshape both require that the PA, inclination, and center position not vary with radius. Using a set of input parameters that are compatible with all three algorithms (PA, , weighting, and no radial motions) and considering radii less than 105″, the algorithms all produce essentially identical results. We conclude that none of the assumptions that are built in to the fitting algorithms affect the results.
The only significant difference that appears between the algorithms stems from the inclusion of radial velocities in the fit. Earlier, we noted that it is obvious from inspection of the velocity field (Figure 4) that noncircular motions are present in NGC 2976: for example, the velocity fits in individual rings for show that the observed velocity maximum is systematically offset from the photometric major axis (Figure 8). Neglecting the term and fitting only for rotation increases the exponent of the density profile from to (for ).
If radial motions are ignored, however, an accurate description of the velocity field requires that that kinematic PA changes with radius. When either the kinematic PA or the inclination varies with radius, rotcur yields . If we allow both parameters to change with radius, tying the inclination to the photometric axis ratio and fitting for the kinematic PA, we obtain total density exponents as high as . Thus, by exchanging radial motions for geometric degrees of freedom it is possible to push to higher values. However, we regard these models as contrived and lacking physical motivation, and therefore less appealing than simply including radial motions.
6.2.2 Uncertainty in Center Position
Assessing the uncertainties on the rotation velocities requires that we first know the uncertainties on each of the parameters that are used to calculate the rotation velocities: the center, PA, inclination, and systemic velocity. We begin by considering the center position of NGC 2976.
The galaxy nucleus is located within 3″ of previously published estimates of the galaxy’s position. The astrometric precision on the photometric location of the nucleus is 02. However, the velocity field is only aligned with the images to about 1″, and the resolution of the velocity field is 4″, which limits the degree to which we can verify that the nucleus and the kinematic center of the galaxy coincide. To determine the position and uncertainty of the kinematic center, we used a bootstrap resampling technique. By running ringfit on 200 bootstrap samples of the velocity field, we measured a kinematic center of ()= (09h47m15.5s, 67°55m00.2s), with an uncertainty of 2″ in both and . Thus, there is no evidence for an offset between the kinematic and photometric centers of NGC 2976.
6.2.3 Uncertainty in Position Angle
We used the same bootstrap method to measure the kinematic PA666The kinematic PA is distinct from the photometric PA in that it is defined as the angle between north and the receding side of the galaxy’s major axis, so that it has a range of to (where positive angles are east of north). and its uncertainty. The kinematic PA is well-determined at PA and agrees with the photometric PA.
6.2.4 Uncertainty in Inclination Angle
Since the photometric inclination of NGC 2976 is relatively high, an error in the inclination angle does not significantly change the rotation velocities. Furthermore, because changing the inclination by a small amount is approximately equivalent to scaling the rotation curve by a constant, the exponent of the power law fit should not be affected. The reader may recall that if the ellipticity is left as a free parameter during the surface brightness profile fitting (§2.5), ellipse calculates inclinations that vary smoothly between 55° and 77° across the galaxy. As mentioned before, this behavior is not interpreted as an actual change of the inclination angle with radius. Nevertheless, if we force rotcur to use this function for the inclination, the density profile slope for the total mass distribution increases to , as discussed in §6.2.1.
6.2.5 Uncertainty in Systemic Velocity
If the systemic velocities are left as a free parameter in the velocity field fits, they have a scatter of 1.8 km s-1 from ring to ring. It is possible that these variations are real, although they are only marginally significant when the systematic uncertainties are taken into account. The alternative approach is to fix at its average value and then fit again with only and as free parameters. The results of the fit with fixed are nearly identical to the previous results. None of the radial or rotational velocities are changed by more than , the density profile exponent for the total mass distribution increases by less than (to ), and the maximum allowed mass-to-light ratio increases to 0.24 .
6.2.6 Uncertainties in Rotation Velocities and Radial Velocities
Using the measured uncertainties in the center position and PA, and assuming an uncertainty of 3° for the inclination angle, we calculated the resulting uncertainties on the rotation velocities and the radial velocities with a Monte Carlo technique. We generated 1000 random centers, PAs, and inclinations, assuming a Gaussian distribution for each of the parameters, and ran ringfit with each set of parameters. The standard deviation of the 1000 rotation velocities in each ring was defined to be the systematic error of that rotation velocity, and the systematic errors in the radial velocities and systemic velocities were calculated in the same way. The systematic errors on the rotation curve range from 2.1 km s-1 to 5.5 km s-1, as listed in Table 2. Power law fits to the 1000 Monte Carlo rotation curves yield a mean slope of the total density profile of .
6.2.7 Asymmetric Drift Correction
We have also calculated the asymmetric drift correction to the rotation curve, as defined by, e.g., Côté, Carignan, & Freeman (2000). We derived the velocity dispersion as a function of radius from the H data, and the surface density by adding the H I and H2 column densities. We then fit polynomials to and and calculated the derivatives and analytically. There are significant uncertainties that factor into this calculation, including 1) we have not included the ionized gas surface density (although its contribution is expected to be small), 2) the H2 surface density is uncertain due to our imprecise knowledge of the CO-H2 conversion factor, 3) our velocity field extends to radii that are smaller than the resolution of the H I data, so that the calculated asymmetric drift may be incorrect for the inner few points of the rotation curve where the correction is most important, and 4) some of the H velocity dispersion is probably due to flows associated with star formation. Because we view the derived corrections as rather uncertain, we have not corrected the observed rotation curve for asymmetric drift. However, the corrections are listed in Table 2 if the reader wishes to apply them. Their effects are to increase the maximum disk mass-to-light ratio, and to make the rotation curve slightly more linear, but the overall conclusions of the paper do not change.
6.2.8 Conclusions From Analysis of Rotation Curve Systematics
We have shown that the only ways to significantly change the derived slope of the density profile of NGC 2976 are to 1) assume the stellar mass-to-light ratio is zero, 2) ignore the radial component of the velocity field, or 3) allow the kinematic PA and/or inclination to change with radius. Assuming that the observed velocities are due entirely to rotation raises by , and allowing the PA and inclination to change with radius raises by up to an additional . Accounting for the contribution of the maximum stellar disk, however, limits the dark matter density profile exponent to .
Because inspection of the velocity field and the fits clearly reveals the presence of radial motions, neglecting the radial component is not justified. Changes in the PA with radius are not supported by the photometry, and changes in the inclination with radius are difficult to understand physically. Therefore, we argue that these solutions, despite being mathematically viable, are contrived and not motivated by the data.
We conclude that the galaxy contains substantial radial motions, and that the density profile results are not significantly affected by the most obvious sources of systematic errors. We caution that the robustness against systematics that we find is specific to this dataset, and may not be true in general. Because the rotation curve of NGC 2976 increases with radius so slowly, errors in any of the geometric parameters of the galaxy are diminished in importance. A galaxy with a more rapidly rising rotation curve would probably be more severely affected. Assuming that the radial motions provide no support, the dark matter density profile slope is in the range , with a upper limit of , where systematic errors have been included in the uncertainty on . NGC 2976 thus violates the prediction of universal central density cusps by CDM simulations.
6.3 Comparing Velocities Derived From Different Tracers
Some recent studies in the literature have shown that, beam smearing questions aside, there do not appear to be systematic offsets between H I and H rotation velocities (e.g., McGaugh, Rubin, & de Blok, 2001; Marchesini et al., 2002). With a handful of exceptions, though, these studies employed longslit H data, so the comparisons essentially took place only along the major axis. In addition, the spatial and velocity resolution of the H I and H data were often quite different.
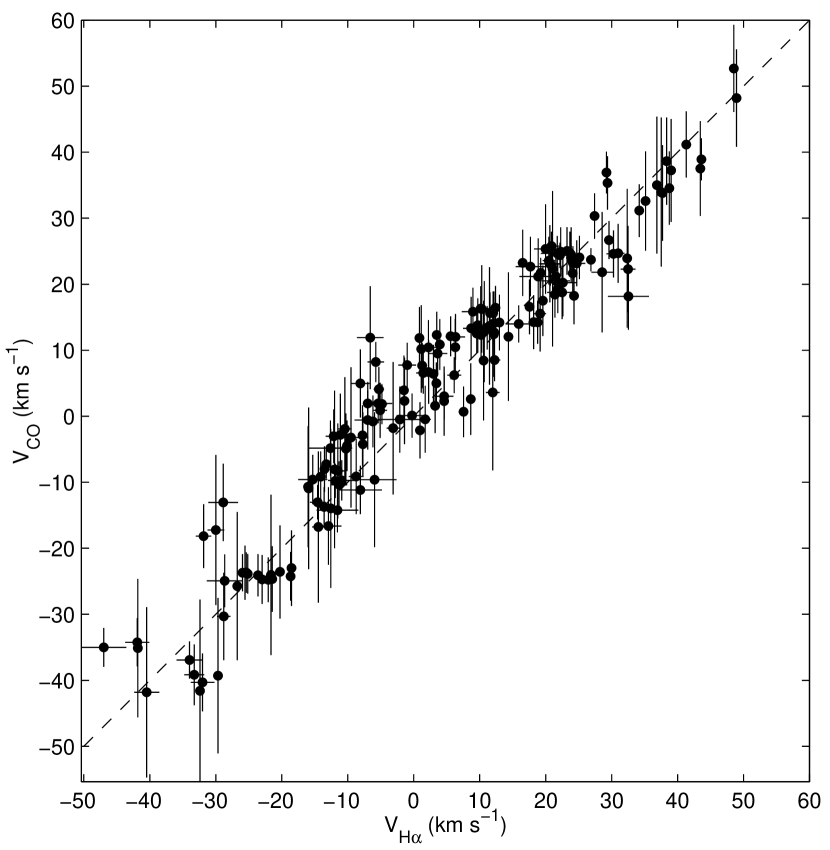
In this paper, we have presented for the first time the data necessary for a two-dimensional comparison across a dwarf galaxy of the CO and H velocity fields. The angular resolution of the two datasets is similar (6″ and 4″, respectively), and although the CO velocity resolution is better by a factor of , the higher signal-to-noise at H compensates such that the velocities can be measured with comparable precision. We use the following technique to compare the velocity fields. At the position of each H fiber, we compute a weighted average of the velocities of all of the pixels in the CO map that fall within the radius of the fiber. CO pixels that do not contain any emission are not used in computing the average, and of course, H fibers that do not coincide with any molecular emission are not used either. This process yields a unique one-to-one mapping between the two velocity fields. The rms difference between and is 5.3 km s-1, with the comparison being made at 173 points. Similar studies in the Milky Way found that the dispersion between the velocities of molecular clouds and the associated H-emitting gas was 4-6 km s-1 (Fich, Treffers, & Blitz, 1982; Fich, Dahl, & Treffers, 1990), so much of the scatter we observe in NGC 2976 may be intrinsic to the process of H II region formation rather than caused by observational uncertainties. We plot the H velocities against the CO velocities in Figure 12. There is a weak systematic trend visible in the residuals, with near the center of the galaxy and on the northwest side of the galaxy. The amplitude of this trend is only a few km s-1, so it does not affect our rotation curve. The origin of the trend is not clear, but we suggest that it could be a result of the spatial distribution of the gas. For example, where the ionized gas is largely in front of the molecular clouds, the expansion of H II regions away from nearby molecular clouds would make . This effect should appear preferentially where H emission is bright. Conversely, where the molecular clouds are in front, one would expect that . These areas should have faint H emission due to extinction within the molecular clouds. The H distribution in NGC 2976 appears to be qualitatively consistent with this interpretation; the H is brighter in the northwest, where the H velocities are larger, and there is an H hole to the southeast, where some of the CO velocities are higher. In any case, we conclude that the H and CO velocity fields agree, with a scatter of 5.3 km s-1, and thus that both species should be accurate tracers of the gravitational potential of NGC 2976.
6.4 Simulated Longslit Observations of NGC 2976
Our H dataset is well suited for studying the systematic problems associated with deriving rotation curves from longslit spectroscopy. It is straightforward to recreate what would be seen by an observer taking longslit spectra of NGC 2976. We begin by selecting all of the fibers within 1″ of a given cut parallel to the major axis of the galaxy. This creates an unevenly-sampled rotation curve, which we smooth by averaging the points into 4″-wide bins. We then proceed exactly as we would if we had obtained these rotation velocities from a longslit spectrograph. We find the center of the rotation curve by folding it about various points to determine the position of maximum symmetry. Three criteria are used to judge the degree of symmetry: the correlation coefficient of the two sides, the rms difference in velocity between points at the same radius on opposite sides, and the appearance of the rotation curve. These criteria are combined in a necessarily somewhat subjective manner, but since we know the true center in this case from our two-dimensional velocity field, we have verified that the chosen center never differs from the actual one by more than 12″ (200 pc). We fold the rotation curve about the chosen center and average the two sides together, weighting each point by the inverse square of its uncertainty. Finally, we fit a power law to the resulting rotation curve, ignoring any points near the center that have negative rotation velocities. We repeat this process with offsets from the major axis of up to 14″ (230 pc). The indices, , of the power law fits in density for each rotation curve are displayed in Figure 13.
The naive expectation from this experiment is that slits placed off of the major axis will make the density profile appear to be shallower than it actually is, and that this effect should become more severe with increasing distance from the major axis. The actual results do not show this trend very clearly. The positive slit offsets (corresponding to the northeast side of the galaxy) appear to agree with the expected behavior; for large slit offsets the slopes are on average shallower than the value that should be derived (, since we are neglecting radial motions). Offsets on the other side of the galaxy, though, do not follow a systematic trend. The derived slopes for negative offsets are similar to the actual slope. Note that when the rotation curve is folded about the correct central position (instead of the one that gives the most symmetric appearance), the slopes are systematically shallower than when other central positions are used. We speculate that this systematic effect is not very strong in NGC 2976 because this galaxy has a relatively shallow central velocity gradient. Other galaxies with steeper rotation curves might be affected more severely. A possible explanation for the difference between the two sides of the galaxy is that the H distribution is rather asymmetric; to the northeast of the major axis are a number of bright point sources, while the emission on the southwest side is faint and diffuse. In addition to coherent systematic errors, this exercise shows that attempting to derive a density profile from a single velocity cut through a galaxy is also a noisy process. Depending on the position of the slit, one could estimate a density profile between and for this galaxy. Only with observations along many slits, or full two-dimensional velocity data, can one be confident that the rotation curve and density profile of a galaxy accurately reflect its gravitational potential.
6.5 Positioning Errors and Slit Offsets
There are several factors that can play a role in positioning errors. First is the pointing and guiding of the telescope used to acquire the data. McGaugh et al. (2001) and de Blok & Bosma (2002) report that observations of LSB galaxies with different telescopes and instruments by independent observers result in essentially identical rotation curves. On this basis, they conclude that pointing errors do not impact their results. Telescope pointing and guiding are thus unlikely to cause problems for longslit observations, although they can be an issue for two-dimensional observations like ours, where the galaxy may not be visible on the guiding camera while observing it (see §2.2 for our solution to this problem). Quite independent of the telescope pointing, though, is the question of whether the center of a given galaxy is where it is reported to be. Even when the photometric center is known accurately, galaxies can have dynamical centers that differ from the photometric ones by hundreds of parsecs (Puche, Carignan, & Wainscoat, 1991; Helfer & Blitz, 1995; Matthews & Gallagher, 2002). Because of these two additional problems, a demonstration that pointing errors are minimal does not suffice to prove that rotation curves are systematically unaffected by offsets between their assumed and actual centers.
One example in the literature of a galaxy in which a poorly-determined center may have caused erroneous conclusions about its density profile is NGC 2552, often referred to by its alternate name of UGC 4325. The rotation curve of this dwarf LSB galaxy has been discussed in a number of recent papers (van den Bosch & Swaters, 2001; de Blok et al., 2001; Swaters et al., 2002; de Blok et al., 2002; Marchesini et al., 2002; de Blok & Bosma, 2002). All of these authors find density profiles with , where is the central slope of the density profile (see §4.2 or Equation B2). With six independent analyses reaching the same conclusion, it would seem that the density profile of this galaxy is well-determined. However, closer inspection reveals a potentially important discrepancy between these studies: they assume widely varying central positions for the galaxy (see Table High-Resolution Measurements of the Dark Matter Halo of NGC 2976: Evidence for a Shallow Density Profile11affiliation: Based on observations carried out at the WIYN Observatory. The WIYN Observatory is a joint facility of the University of Wisconsin-Madison, Indiana University, Yale University, and the National Optical Astronomy Observatory.). Two papers (van den Bosch & Swaters, 2001; Swaters et al., 2002) measure the galaxy’s center from their own photometry, while the other four make no reference to the assumed center. It is reasonable to suppose that they used the coordinates given by one of the standard databases, such as the NASA/IPAC Extragalactic Database777http://nedwww.ipac.caltech.edu/ or the SIMBAD Database888http://simbad.u-strasbg.fr/. These different positions span a range of 11″, or 550 pc at the distance of NGC 2552.
The reason for the uncertainty in the galaxy center is clear from inspection of a Digitized Sky Survey image: NGC 2552 is a lopsided galaxy, with a low surface brightness outer disk that is off center relative to the brighter inner disk. However, there has recently been an accurate determination of the actual position of the galaxy; Böker, Stanek, & van der Marel (2003) used HST imaging to show that NGC 2552 contains a nuclear star cluster, and that this nucleus is also the center of the inner isophotes. Because galaxies can display offsets between their nuclei and their dynamical centers, it is possible that the nucleus is not located at the dynamical center of NGC 2552, but in the absence of two-dimensional kinematic information it represents the best guess. As can be seen in Table High-Resolution Measurements of the Dark Matter Halo of NGC 2976: Evidence for a Shallow Density Profile11affiliation: Based on observations carried out at the WIYN Observatory. The WIYN Observatory is a joint facility of the University of Wisconsin-Madison, Indiana University, Yale University, and the National Optical Astronomy Observatory., the previously-used positions are up to 9″ (450 pc) away from the nucleus. Based on the results of SMVB and our discussion in Section 6.4, we suggest that density profiles derived from the longslit observations cited above could have been significantly over or underestimated. de Blok et al. (2002) argue that this is not the case because the three slit positions they used to observe NGC 2552 (one through their assumed center, and the other two 5″ away on either side) result in similar density profiles. However, one of the three slopes they measure () differs from the others by , showing that slit offsets can cause density profiles different from the true one to be derived. Also, if none of the three slits went through the actual center of the galaxy, then further observations may be needed to ensure that the measured density profile is correct. Given this degree of confusion over the position of a relatively nearby (d = 10 Mpc) and high-surface brightness (for a galaxy classified as LSB; mag arcsec-2) galaxy, it is certainly not obvious that the centers of fainter and more distant galaxies are well-determined in the literature.
6.6 Barred And Highly Inclined Galaxies
Two other common attributes of galaxies that can cause systematic errors deserve mention here: bars and high inclination angles. SMVB already discussed the problems associated with galaxies that are seen edge-on or nearly so and demonstrated that observations of such galaxies must be analyzed with extreme care. Equally problematic, though, are galaxies that contain bars. Barred galaxies certainly have noncircular motions out to the end of the bar, so one-dimensional velocity data will be systematically affected. Density profiles of barred galaxies derived from longslit data are therefore not trustworthy at radii less than the bar semimajor axis. SMVB include five barred galaxies in their sample, and unsurprisingly find that these objects have shallower central density slopes than their other targets. The kinematics of barred galaxies are interesting in their own right; there are suggestions that the presence of a bar can affect the evolution of dark matter density cusps (Weinberg & Katz, 2002), and with two-dimensional velocity fields it is possible to use barred galaxies to study dark matter density profiles (Weiner et al., 2001; Weiner, Sellwood, & Williams, 2001). However, longslit observations of barred galaxies may not be a reliable way to attack the density profile question.
7 CONCLUSIONS
We have used two-dimensional velocity fields, sampled at high spatial resolution and high spectral resolution in CO and H to study the density profile of NGC 2976 and the parameters of its stellar disk and dark matter halo. We obtained rotation curves from the two-dimensional data using tilted-ring models derived with three independent and complementary algorithms. Our tilted-ring fitting shows that there are significant radial (i.e., noncircular) motions in the inner 20″ (300 pc) of the galaxy. Accounting for these motions yields a total density profile of . There is a narrow range of possible stellar mass-to-light ratios for NGC 2976, and the corresponding dark matter halo density profiles range from to (constant density). A key assumption that we make in the inversion of the rotation curve to obtain the density profile is that the gravitational and centripetal forces are in equilibrium (or equivalently, that the radial motions provide no support). The density profile obtained by excluding measurements inside the 20″ radius is identical to that computed when including them, substantiating this assumption.
We found that in our preferred model, the maximum mass-to-light ratio of the stellar disk of NGC 2976 is . If , the dark matter halo has the unphysical property that its density increases with radius. Accounting for the thickness of the stellar disk and the asymmetric drift correction to the rotation curve brings this kinematic value of into line with photometric estimates. Comparison with stellar population synthesis models (Worthey, 1994; Leitherer et al., 1999; Bell & de Jong, 2001) suggests that the mass-to-light ratio is unlikely to be less than 0.10 , so the stellar disk — and hence the dark matter halo — are tightly constrained. We investigated many of the likely systematic effects on the rotation curve and found that none of them can bring the density profile close to . We therefore rule out an NFW or Moore et al. (1999b) density profile in the center of this galaxy at high confidence regardless of the stellar contribution.
In addition, we investigated the most extreme models of the galaxy that are allowed by the data. Density profile slopes as high as can be obtained, but only when all three of the following are true: 1) the mass-to-light ratio of the matter in the disk is zero, 2) the observed velocities are attributed entirely to rotation, despite the observed radial motions, and 3) the kinematic PA and inclination both change with radius in the manner described in §5.5 and §6.2.8. Retaining requirements 2 and 3, but assuming a maximal stellar disk, reduces to . We consider these models to be quite unlikely, and inconsistent with the complementary data we have presented for this galaxy.
We also discussed whether a universal dark matter halo shape is consistent with our observations. In a similar study of the slightly more massive galaxy NGC 4605, Bolatto et al. (2002) found a lower limit to the dark matter density profile slope of . Since the upper limit for NGC 2976 is , the density profiles of the halos of these galaxies are different from one another. If the disk of NGC 4605 is submaximal, or the disk of NGC 2976 is not minimal (which is likely), the inconsistency becomes more severe. In addition, we note that both of these dwarf galaxies are dynamically dominated by luminous matter at small radii.
Finally, we considered the impact of some of the known systematic uncertainties that afflict rotation curve studies, following up on the recent work of SMVB and de Blok et al. (2002). We found that systematic errors can cause the density profiles inferred from longslit observations to differ significantly from the true density profiles. We also illustrated the difficulties that can arise in determining the positions of galaxy centers without adequate two-dimensional kinematic and photometric information. These problems — as well as the disk-halo degeneracy — can be largely overcome by using high-resolution two-dimensional velocity fields, as we have shown in this paper.
Although previous studies have found that central density cusps cannot be ruled out in many dwarf and LSB galaxies, we have demonstrated that a cusp is not present in NGC 2976; the dark matter halo of this galaxy is nearly constant density out to the edge of the observed H emission at a radius of 2.2 kpc.
Appendix A ROTATION CURVE FITTING ALGORITHMS
When dealing with longslit kinematic data it is relatively straightforward to transform the reduced observations into a rotation curve. For a full velocity field, the process is more complicated because it involves converting two-dimensional data to one dimension while retaining as much of the information as possible. In this appendix, we describe the various techniques we use to make this conversion.
A.1 Rotcur
Rotcur (Begeman, 1987) is a standard algorithm to fit galaxy kinematics with a tilted-ring model. We used the implementation of rotcur in the NEMO package (Teuben, 1995). Rotcur divides the galaxy into a set of narrow, concentric rings, and in each ring performs a nonlinear least squares fit to the function
| (A1) | |||||
where is the systemic velocity, is the rotation velocity, is the inclination angle, is the angle between north and the receding side of the galaxy’s major axis, and () is the galaxy’s center. Each ring can thus contain up to six free parameters (the central position requires two), and rotcur finds the best fit by minimizing , where is the weight ascribed to each point. We weight each point by the cosine of the angle between the point and the major axis, automatically deemphasizing points near the minor axis, so it is not necessary to discard points within some angle of the minor axis. Rotcur’s most serious weakness is that it can only model rotational motions.
To create the rotcur rotation curve, we used the best-fit center and systemic velocity that we determined with ringfit. Because the position angle must be a function of radius if the galaxy is modeled with purely rotational motions, we first ran rotcur with both the rotation velocities and the position angle free to vary to determine . We then used this description of the position angle as an input to rotcur, and ran it again with only the rotation velocities as free parameters. The rotation curve produced in this way is displayed in Figure 7b. We did not allow rotcur to fit for the inclination angle because it was apparent early on that the rotation curve of NGC 2976 is essentially solid-body, which means that is small. Therefore, the inclination angle and the rotation velocities are degenerate in Equation A1, making the kinematic inclination angle poorly determined. We judged that the inclination angle was unlikely to differ significantly from the photometric value anyway, so the safest course was to leave the inclination fixed at 61.5°.
A.2 Ringfit
In addition to rotcur we constructed tilted-ring models with our own routine, ringfit. The purpose of this exercise was twofold: first, to compare the results from rotcur with those from a completely independent program and make sure that the answers agreed, and second, to fit for radial motions in the plane of the galaxy (inflow or outflow) instead of just assuming that the observed velocity field was due only to rotation. The ringfit fitting function is similar to Equation A1, except that we add an extra term to allow for radial velocities, and we do not fit for the PA, inclination, or the center. Thus, we can drop the explicit mention of the PA, , and , and write
| (A2) |
where is equal to the fractional expression that follows in the second term on the right hand side of Equation A1, and the free parameters in each ring are , , and . The solution is then determined with a linear least squares fit. The inclination, PA, and central position must be specified as inputs, but they can also be solved for by running ringfit with a grid of input parameters and minimizing . We have verified that rotcur and ringfit give indistinguishable results when the same input parameters and weighting function are used.
A.3 Rotcurshape
We also employed the NEMO routine rotcurshape, which is closely related to (and based on) rotcur. Rotcurshape dispenses with dividing the galaxy into rings and instead fits the whole velocity field at once. In addition to calculating the best-fit values for the PA, inclination, systemic velocity, and center, rotcurshape also assumes a functional form for the rotation curve/density profile (e.g., power law, NFW, pseudoisothermal, etc.) and solves for the free parameters of that function. One advantage of this approach is that near the center of the galaxy, where the velocities may be changing rapidly with radius, all of the data points are not artificially placed at the same radius (as was necessary with rotcur, where every point with was in the same ring). Another is that the kinematic parameters of the galaxy and the parameters of the fitting function are determined in a single step. This makes it straightforward to measure the global agreement between the model and the data. For a power law rotation curve, the results from rotcurshape are nearly identical to the ones we derive by running rotcur or ringfit and then fitting a power law to the resulting rotation velocities.
Appendix B NFW AND POWER LAW DENSITY PROFILES
Navarro et al. (1996) showed that CDM halos have density profiles of the form
| (B1) |
where g cm-3 is the critical density, is the halo overdensity, and is the scale radius (simulations suggest kpc for a galaxy the size of NGC 2976). For , Equation B1 clearly reduces to . The commonly-discussed concentration parameter is the ratio of the virial radius of the halo (, the radius enclosing a mean density of 200 times the background density) to the scale radius. In the simulations analyzed by NFW the concentration parameter varied from for galaxy clusters up to for large galaxies. Later studies at lower masses found a median concentration of for halos (Bullock et al., 2001). Other numerical simulations have resulted in slightly different profile shapes. For example, Moore et al. (1999b) argue that CDM halos exhibit steeper central cusps when simulated at higher resolution; their best-fitting functional form is similar to that of NFW, except that both terms in the denominator of the right hand side of Equation B1 are raised to the 1.5 power, resulting in a central density profile. Most subsequent studies in the literature have found central slopes that are bracketed by the NFW and Moore profiles (e.g., Jing & Suto, 2000; Ghigna et al., 2000; Klypin et al., 2001; Power et al., 2003). It is noteworthy that no set of simulations has found central density profiles that are shallower than , although Taylor & Navarro (2001) presented analytical arguments for a central slope.
Since we are mostly interested in power law fits to the rotation curve, we also note that for a spherical mass distribution, a density profile implies that
| (B2) |
and correspondingly, a rotation curve that can be fit by a power law yields a density profile
| (B3) |
A galaxy with a constant density halo thus has a linear () rotation curve, while the rotation curve associated with an NFW central density profile is .
References
- Alam, Bullock, & Weinberg (2002) Alam, S. M. K., Bullock, J. S., & Weinberg, D. H. 2002, ApJ, 572, 34
- Appleton, Davies, & Stephenson (1981) Appleton, P. N., Davies, R. D., & Stephenson, R. J. 1981, MNRAS, 195, 327
- Barden, Sawyer, & Honeycutt (1998) Barden, S. C., Sawyer, D. G., & Honeycutt, R. K. 1998, Proc. SPIE, 3355, 892
- Barnes & Hernquist (1992) Barnes, J. E., & Hernquist, L. 1992, Nature, 360, 715
- Begeman (1987) Begeman, K. G. 1987, Ph.D. thesis, Kapteyn Institute
- Bell & de Jong (2001) Bell, E. F., & de Jong, R. S. 2001, ApJ, 550, 212
- Binney & Tremaine (1987) Binney, J., & Tremaine, S. 1987, Galactic Dynamics (Princeton, NJ: Princeton University Press)
- Blais-Ouellette, Amram, & Carignan (2001) Blais-Ouellette, S., Amram, P., & Carignan, C. 2001, AJ, 121, 1952
- Blais-Ouellette et al. (1999) Blais-Ouellette, S., Carignan, C., Amram, P., & Côté, S. 1999, AJ, 118, 2123
- Böker et al. (1999) Böker, T., et al. 1999, ApJS, 124, 95
- Böker, Stanek, & van der Marel (2003) Böker, T., Stanek, R., & van der Marel, R. P. 2003, ApJ, in press
- Bolatto et al. (2002) Bolatto, A. D., Simon, J. D., Leroy, A., & Blitz, L. 2002, ApJ, 565, 238
- Borriello & Salucci (2001) Borriello, A., & Salucci, P. 2001, MNRAS, 323, 285
- Boyce et al. (2001) Boyce, P. J., et al. 2001, ApJ, 560, L127
- Broeils (1992) Broeils, A. H. 1992, A&A, 256, 19
- Bullock et al. (2001) Bullock, J. S., Kolatt, T. S., Sigad, Y., Somerville, R. S., Kravtsov, A. V., Klypin, A. A., Primack, J. R., & Dekel, A. 2001, MNRAS, 321, 559
- Burkert (1995) Burkert, A. 1995, ApJ, 447, L25
- Carignan & Beaulieu (1989) Carignan, C., & Beaulieu, S. 1989, ApJ, 347, 760
- Carignan & Freeman (1988) Carignan, C., & Freeman, K. C. 1988, ApJ, 332, L33
- Cole & Lacey (1996) Cole, S., & Lacey, C. 1996, MNRAS, 281, 716
- Côté, Carignan, & Freeman (2000) Côté, S., Carignan, C., & Freeman, K. C. 2000, AJ, 120, 3027
- Cotton, Condon, & Arbizzani (1999) Cotton, W. D., Condon, J. J., & Arbizzani, E. 1999, ApJS, 125, 409
- de Blok & Bosma (2002) de Blok, W. J. G., & Bosma, A. 2002, A&A, 385, 816
- de Blok, Bosma, & McGaugh (2002) de Blok, W. J. G., Bosma, A., & McGaugh, S. 2003, MNRAS, 340, 657
- de Blok & McGaugh (1997) de Blok, W. J. G., & McGaugh, S. S. 1997, MNRAS, 290, 533
- de Blok et al. (2001) de Blok, W. J. G., McGaugh, S. S., Bosma, A., & Rubin, V. C. 2001, ApJ, 552, L23
- de Blok, McGaugh, & Rubin (2001) de Blok, W. J. G., McGaugh, S. S., & Rubin, V. C. 2001, AJ, 122, 2396
- de Vaucouleurs et al. (1991) de Vaucouleurs, G., de Vaucouleurs, A., Corwin, H. G., Buta, R. J., Paturel, G., & Fouque, P. 1991, Third Reference Catalog of Bright Galaxies (Berlin: Springer-Verlag) (RC3)
- Dubinski & Carlberg (1991) Dubinski, J., & Carlberg, R. G. 1991, ApJ, 378, 496
- Falco et al. (1999) Falco, E. E., et al. 1999, PASP, 111, 438
- Fich, Dahl, & Treffers (1990) Fich, M., Dahl, G. P., & Treffers, R. R. 1990, AJ, 99, 622
- Fich, Treffers, & Blitz (1982) Fich, M., Treffers, R. R., & Blitz, L. 1982, Astronomy and Space Science Library Vol. 93: Regions of Recent Star Formation, ed. R. S. Roger, & P. E. Dewdney (Dordrecht: Reidel), 201
- Flores & Primack (1994) Flores, R. A., & Primack, J. R. 1994, ApJ, 427, L1
- Ghigna et al. (2000) Ghigna, S., Moore, B., Governato, F., Lake, G., Quinn, T., & Stadel, J. 2000, ApJ, 544, 616
- Gnedin & Zhao (2002) Gnedin, O. Y., & Zhao, H. 2002, MNRAS, 333, 299
- Hayashi et al. (2003) Hayashi, E., Navarro, J. F., Taylor, J. E., Stadel, J., & Quinn, T. 2003, ApJ, 584, 541
- Helfer & Blitz (1995) Helfer, T. T., & Blitz, L. 1995, ApJ, 450, 90
- Jing & Suto (2000) Jing, Y. P., & Suto, Y. 2000, ApJ, 529, L69
- Jobin & Carignan (1990) Jobin, M., & Carignan, C. 1990, AJ, 100, 648
- Karachentsev et al. (2002) Karachentsev, I. D., et al. 2002, A&A, 383, 125
- Klypin et al. (2001) Klypin, A., Kravtsov, A. V., Bullock, J. S., & Primack, J. R. 2001, ApJ, 554, 903
- Landolt (1992) Landolt, A. U. 1992, AJ, 104, 340
- Leitherer et al. (1999) Leitherer, C., et al. 1999, ApJS, 123, 3
- Marchesini et al. (2002) Marchesini, D., D’Onghia, E., Chincarini, G., Firmani, C., Conconi, P., Molinari, E., & Zacchei, A. 2002, ApJ, 575, 801
- Martimbeau, Carignan, & Roy (1994) Martimbeau, N., Carignan, C., & Roy, J.-R. 1994, AJ, 107, 543
- Matthews & Gallagher (2002) Matthews, L. D., & Gallagher, J. S. 2002, ApJS, 141, 429
- McGaugh & de Blok (1998) McGaugh, S. S., & de Blok, W. J. G. 1998, ApJ, 499, 41
- McGaugh, Rubin, & de Blok (2001) McGaugh, S. S., Rubin, V. C., & de Blok, W. J. G. 2001, AJ, 122, 2381
- Mendez (2002) Mendez, B. 2002, Ph.D. thesis, University of California at Berkeley
- Moore et al. (1999b) Moore, B., Quinn, T., Governato, F., Stadel, J., & Lake, G. 1999b, MNRAS, 310, 1147
- Näslund & Jörsäter (1997) Näslund, M., & Jörsäter, S. 1997, A&A, 325, 915
- Navarro, Frenk, & White (1996) Navarro, J. F., Frenk, C. S., & White, S. D. M. 1996, ApJ, 462, 563 (NFW)
- Oke et al. (1995) Oke, J. B., et al. 1995, PASP, 107, 375
- Olling & Merrifield (2001) Olling, R. P., & Merrifield, M. R. 2001, MNRAS, 326, 164
- Osterbrock et al. (1996) Osterbrock, D. E., Fulbright, J. P., Martel, A. R., Keane, M. J., Trager, S. C., & Basri, G. 1996, PASP, 108, 277
- Peng et al. (2002) Peng, Q., Peng, F., Chou, C., & Lin, Y. 2002, Ap&SS, 282, 499
- Persic, Salucci, & Stel (1996) Persic, M., Salucci, P., & Stel, F. 1996, MNRAS, 281, 27 (PSS)
- Pohlen (2001) Pohlen, M. 2001, Ph.D. thesis, Ruhr-Universität, Bochum, Germany
- Pohlen et al. (2002) Pohlen, M., Dettmar, R.-J., Lütticke, R., & Aronica, G. 2002, A&A, 392, 807 (PDLA)
- Power et al. (2003) Power, C., Navarro, J. F., Jenkins, A., Frenk, C. S., White, S. D. M., Springel, V., Stadel, J., & Quinn, T. 2003, MNRAS, 338, 14
- Puche, Carignan, & Wainscoat (1991) Puche, D., Carignan, C., & Wainscoat, R. J. 1991, AJ, 101, 447
- Salucci, Walter, & Borriello (2002) Salucci, P., Walter, F., & Borriello, A. 2002, A&A, submitted (preprint: astro-ph 0206304)
- Sakai et al. (2000) Sakai, S., et al. 2000, ApJ, 529, 698
- Schlegel, Finkbeiner, & Davis (1998) Schlegel, D. J., Finkbeiner, D. P., & Davis, M. 1998, ApJ, 500, 525
- Stetson (1987) Stetson, P. B. 1987, PASP, 99, 191
- Stetson (2000) ——. 2000, PASP, 112, 925
- Stil & Israel (2002a) Stil, J. M., & Israel, F. P. 2002a, A&A, 389, 29
- Stil & Israel (2002b) ——. 2002b, A&A, 389, 42
- Stoehr et al. (2002) Stoehr, F., White, S. D. M., Tormen, G., & Springel, V. 2002, MNRAS, 335, L84
- Swaters (1999) Swaters, R. 1999, Ph.D. thesis, University of Groningen
- Swaters & Balcells (2002) Swaters, R. A., & Balcells, M. 2002, A&A, 390, 863
- Swaters, Madore, & Trewhella (2000) Swaters, R. A., Madore, B. F., & Trewhella, M. 2000, ApJ, 531, L107
- Swaters et al. (2002) Swaters, R. A., Madore, B. F., van den Bosch, F. C., & Balcells, M. 2003, ApJ, in press (SMVB)
- Swaters et al. (2003) Swaters, R. A., Verheijen, M. A. W., Bershady, M. A., & Andersen, D. R. 2003, ApJ, 587, L19
- Taylor & Navarro (2001) Taylor, J. E., & Navarro, J. F. 2001, ApJ, 563, 483
- Teuben (1995) Teuben, P. J. 1995, in ASP Conf. Ser. 77: Astronomical Data Analysis Software and Systems IV, ed. R. Shaw, H. E. Payne, & J. J. E. Hayes (San Francisco: ASP), 398
- Vallejo, Braine, & Baudry (2002) Vallejo, O., Braine, J., & Baudry, A. 2002, A&A, 387, 429
- van den Bosch et al. (2000) van den Bosch, F. C., Robertson, B. E., Dalcanton, J. J., & de Blok, W. J. G. 2000, AJ, 119, 1579
- van den Bosch & Swaters (2001) van den Bosch, F. C., & Swaters, R. A. 2001, MNRAS, 325, 1017
- Warren et al. (1992) Warren, M. S., Quinn, P. J., Salmon, J. K., & Zurek, W. H. 1992, ApJ, 399, 405
- Weinberg & Katz (2002) Weinberg, M. D., & Katz, N. 2002, ApJ, 580, 627
- Weiner et al. (2001) Weiner, B. J., Williams, T. B., van Gorkom, J. H., & Sellwood, J. A. 2001, ApJ, 546, 916
- Weiner, Sellwood, & Williams (2001) Weiner, B. J., Sellwood, J. A., & Williams, T. B. 2001, ApJ, 546, 931
- Welch et al. (1996) Welch, W. J., et al. 1996, PASP, 108, 93
- Weldrake, de Blok, & Walter (2003) Weldrake, D. T. W., de Blok, W. J. G., & Walter, F. 2003, MNRAS, 340, 12
- Wong (2000) Wong, T. H. 2000, Ph.D. thesis, University of California at Berkeley
- Worthey (1994) Worthey, G. 1994, ApJS, 95, 107
- Young et al. (1995) Young, J. S., et al. 1995, ApJS, 98, 219
- Yun, Ho, & Lo (1994) Yun, M. S., Ho, P. T. P., & Lo, K. Y. 1994, Nature, 372, 530
- Yun, Ho, & Lo (2000) ——. 2000, ASP Conf. Ser. 217: Imaging at Radio through Submillimeter Wavelengths, ed. J. G. Mangum, & S. J. E. Radford (San Francisco: ASP), 374
| Filter | Integrated | Central Surface BrightnessbbCentral surface brightnesses and inner scale lengths were calculated from the light distribution between 10″ and 70″. | Inner Disk | Outer Disk | |
|---|---|---|---|---|---|
| MagnitudeaaThese magnitudes are measured within an elliptical aperture with a semimajor axis of 172″ on our Lowell and 2MASS images. The galaxy does extend to somewhat larger radii on the Keck images, so we have certainly underestimated the flux here. The Keck data suggest that the Lowell magnitudes should be made % brighter, although if the galaxy is more extended even than those images reveal, the true correction could be slightly larger. | [mag arcsecond-2] | Scale LengthbbCentral surface brightnesses and inner scale lengths were calculated from the light distribution between 10″ and 70″.[″] | Scale LengthccOuter scale lengths were calculated from the light distribution outside 100″ for B, V, and R (where there was a visible transition region between the inner and outer disks), and outside 70″ for the near-infrared bands (where there was no transition region).[″] | [mag arcsecond-2] | |
| B | 10.71 | 22.10 | |||
| V | 10.14 | 21.28 | |||
| R | 9.66 | 20.71 | |||
| I | 9.19 | 19.68 | |||
| J | 8.29 | 16.01 | |||
| H | 7.71 | 13.98 | |||
| K | 7.48 | 13.47 |
Note. — We have applied Galactic extinction corrections to these data. Internal extinction corrections have not been applied, but our adopted values for the internal extinction are given in the text (§2.5) if the reader wishes to use them.
| RadiusaaTo convert to pc, multiply by 16.7. | bbFitted velocities are given as value statistical error systematic error. | b,cb,cfootnotemark: | b,cb,cfootnotemark: | ddStellar velocities are given for the case of . To get the stellar velocities for a different stellar mass-to-light ratio, multiply the tabulated values by . The listed uncertainties include only statistical errors. | eeThe uncertainties on the H I rotation velocities are not known because we do not have access to the original data, but are probably about 10 - 20 %. | ffThe uncertainties on the CO rotation velocities are quite high because the CO-H2 conversion factor is not known accurately. Since the CO rotation velocities are so small, this uncertainty is unimportant. | ggThis column gives the asymmetric drift correction to the rotation curve (see §6.2.7). To correct for asymmetric drift, add the values in this column to the observed rotation velocities in column 2. |
|---|---|---|---|---|---|---|---|
| [″] | [km s-1] | [km s-1] | [km s-1] | [km s-1] | [km s-1] | [km s-1] | [km s-1] |
| 6.2 | 0.9 | 2.4 | |||||
| 10.0 | 1.5 | 4.1 | |||||
| 14.0 | 2.1 | 5.0 | |||||
| 18.1 | 2.5 | 5.0 | |||||
| 22.1 | 2.8 | 5.1 | |||||
| 26.0 | 3.4 | 5.0 | |||||
| 30.0 | 3.8 | 4.9 | |||||
| 34.0 | 4.2 | 4.8 | |||||
| 38.0 | 5.0 | 4.7 | |||||
| 42.0 | 5.9 | 5.1 | |||||
| 46.0 | 6.4 | 4.9 | |||||
| 50.0 | 7.2 | 4.6 | |||||
| 54.0 | 7.9 | 5.2 | |||||
| 58.1 | 8.6 | 5.0 | |||||
| 62.1 | 9.6 | 5.1 | |||||
| 66.0 | 11.1 | 5.9 | |||||
| 69.9 | 13.2 | 5.9 | |||||
| 73.9 | 15.0 | 6.0 | |||||
| 77.9 | 16.7 | 6.2 | |||||
| 81.9 | 18.5 | 6.4 | |||||
| 85.9 | 20.2 | 6.5 | |||||
| 89.9 | 6.7 | ||||||
| 94.0 | 6.9 | ||||||
| 100.6 | 0 | 0 | 7.1 | ||||
| 111.1 | 0 | 0 | 7.5 | ||||
| 120.7 | 0 | 0 | 7.8 | ||||
| 131.2 | 0 | 0 | 8.1 |
| Color | Mean Inner | Predicted ccRadial velocities and systemic velocities were fixed at zero for the outer four rings, where a lack of velocity field information away from the major axis limited our ability to constrain them. | Predicted | Mean Outer |
|---|---|---|---|---|
| Disk Colora,ba,bfootnotemark: | [] | [] | Disk Colorb,db,dfootnotemark: | |
| 0.53 | 0.45 | 0.97 | 0.60 | |
| 0.98 | 0.46 | 1.03 | 1.10 | |
| 0.87 | 0.47 | 1.04 | 0.93 | |
| 1.72 | 0.49 | 1.11 | 1.85 | |
| 2.31 | 0.50 | 1.16 | 2.33 | |
| 2.48 | 0.49 | 1.13 | 2.53 |
| Method of | (J2000.0) | (J2000.0) | Distance From | Reference |
|---|---|---|---|---|
| Determining Center | Nucleus [″] | |||
| nucleusaaCalculated for . | 08h19m20.4s | 50°00′33″ | 0.0 | 1 |
| outer isophotesbbNote that these colors have been corrected for Galactic extinction and internal extinction. The Galactic extinction is taken from Schlegel et al. (1998) and the internal extinction corrections are given in the text. | 08h19m20.4s | 50°00′36″ | 2.7 | 2 |
| outer isophotesccWe use the predictions for the formation epoch with bursts of star formation model, assuming a scaled Salpeter initial mass function, as described in Bell & de Jong (2001). | 08h19m19.7s | 50°00′32″ | 6.8 | 3 |
| NED | 08h19m20.1s | 50°00′25″ | 8.5 | 4 |
| SIMBAD | 08h19m19.6s | 50°00′28″ | 9.2 | 5 |