Identifying Compact Symmetric Objects in the Southern Sky
Abstract
We present results of multifrequency polarimetric VLBA observations of 20 compact radio sources. The observations represent the northern and southern extensions of a large survey undertaken to identify Compact Symmetric Objects (CSOs) Observed in the Northern Sky (COINS). CSOs are young radio galaxies whose jet axes lie close to the plane of the sky, and whose appearance is therefore not dominated by relativistic beaming effects. The small linear sizes of CSOs make them valuable for studies of both the evolution of radio galaxies and testing unified schemes for active galactic nuclei (AGN). In this paper we report on observations made of 20 new CSO candidates discovered in the northern and southern extremities of the VLBA Calibrator Survey. We identify 4 new CSOs, and discard 12 core-jet sources. The remaining 4 sources remain candidates pending further investigation. We present continuum images at 5 GHz and 15 GHz and, where relevant, images of the polarized flux density and spectral index distributions for the 8 new CSOs and CSO candidates.
1 Introduction
Compact Symmetric Objects (CSOs) are a recently identified class of radio source which are less than 1 kpc in size, and are thought to be very young objects (104 yr, Readhead et al. (1996a); Owsianik & Conway (1998)). These sources are uniquely well suited to investigations into the physics of the central engines and the evolution of radio galaxies. CSOs have proved useful for testing the unified scheme of active galactic nuclei, which requires an obscuring region of atomic or molecular gas surrounding the central engine and effectively shielding the inner few parsecs of the source from view if the radio axis lies at a large angle to the line of sight (Antonucci, 1993). This model is supported by observations of a few symmetric radio sources which exhibit very broad HI absorption lines (Taylor et al., 1999; Peck & Taylor, 2001), and free-free absorption (e. g. Peck et al. (1999)). It is reasonable to assume that if CSOs are young, this circumnuclear material is accreting onto, and “feeding”, the central engine, and that this process will lead to their eventual evolution into much larger FR II sources (Readhead et al., 1996b; Fanti et al., 1995).
Measurements of the hotspot advance speeds can provide a kinematic age estimate for CSOs. To date, hotspot advance speeds have been reported for fewer than 10 sources (see Polatidis & Conway (2003) for a review). The velocities reported are all of order 0.2 c (where = H0/100 km s-1 Mpc-1), yielding kinematic age estimates of between 200 and 2000 years.
Considerably larger velocities have been seen for the jet components of CSOs, and may provide a means of constraining H0. The symmetry axes of CSOs are known to be at moderate to large angles, , to the line-of-sight (Readhead et al., 1996a), such that counterjet components are frequently visible. If the jets have bulk velocities, , then the separation velocity between oppositely directed components, together with their velocity ratios, distance ratios, and flux density ratios, constrain the allowed values for , , and H0 (Taylor & Vermeulen, 1997). Once the velocities of jet/counterjet pairs in enough CSOs are measured, then it may also be possible to constrain cosmological parameters since CSOs are found at a wide range of redshifts.
In addition to their scientific appeal, CSOs can also be quite useful calibrators. CSOs have been shown to be remarkably stable in flux density (Fassnacht & Taylor, 2001), making them ideal sources to use as amplitude calibrators in monitoring experiments, such as measuring the time delay between components of gravitational lens systems. CSOs to date have been observed to have very low fractional polarization (Peck & Taylor, 2000), making them useful to solve for leakage terms, or as an independent check on the quality of the polarization calibration.
Here we report on efforts to identify CSOs in the Northern cap (dec 75∘) and in the Southern sky (∘ dec 30∘). This will complete our survey to identify valuable sources (CSOs in the Northern Sky (COINS), Peck & Taylor (2000)) which can be searched for HI and free-free absorption, used as calibrators, and are promising candidates to be added to our sample for proper motion studies.
We assume H km s-1 Mpc-1, =0.27, and a flat cosmology throughout.
2 Sample Selection
We have been working on identifying a substantial sample of CSOs starting from a number of VLBI surveys including the Pearson-Readhead (1988) sample, Caltech-Jodrell Surveys (CJ1 – Polatidis et al. (1995); CJ2 – Taylor et al. (1994); CJF - Taylor et al. (1996)), and the VLBA Calibrator Survey (VCS - Beasley et al. (2002)). The initial sample concentrated on CSOs Observed in the Northern Sky (COINS). With the extension of the VCS to southern declinations (0∘ to 30∘) and also the northern cap (dec 75∘) we have been able to extend the COINS sample.
Some 425 sources were examined from the VCS at both the 8.4 and 2.2 GHz bands. Sources were selected according to the criteria used by Peck & Taylor (2000). Namely these are objects having (1) a nearly equal double structure (intensity ratio less than 10) at either 2.2 or 8.4 GHz or (2) a strong central component with extended emission on both sides at one or both frequencies. Sources exhibiting edge-brightening of one or more components were given priority. These selection criteria are not among the defining characteristics of CSO’s, but are used to eliminate the more obvious “core-jet” sources which comprise the majority of sources in this flat spectrum survey. These selection criteria applied to the northern and southern extremities of the VCS yielded 20 CSO candidates for further study.
3 Observations and Analysis
The observations, performed on 2002 April 26, were carried out at 5 and 15.2 GHz using the VLBA111The National Radio Astronomy Observatory is operated by Associated Universities, Inc., under cooperative agreement with the National Science Foundation.. Due to problems with the site computer, the VLBA element at North Liberty did not observe, thus reducing the VLBA to 9 stations for this experiment. Amplitude calibration was performed in the standard way using measurements of the system temperatures and antenna gains. Fringe-fitting was performed on the strong calibrator 3C279 and a moderately strong target source, J0240-2309. The delays determined from J02402309 were used for all target sources. Feed polarizations of the antennas were determined at 5 GHz only using the AIPS task LPCAL. This calibration was performed twice, first using J02402309 with an accompanying CLEAN model for this polarized source. After this calibration was performed J19358130 was found to be unpolarized, and although somewhat weaker, it had the benefit of better parallactic angle coverage. The D-terms were solved for again using J19358130 as an unpolarized calibrator. Both sources produced nearly identical corrections for the D-terms, and J19358130 was used as the final D-term calibrator. No polarimetry was attempted for the 15 GHz observations, primarily because the sources are all considerably weaker at this frequency.
Absolute electric vector position angle (EVPA) calibration was determined by using the EVPA’s of 3C279 listed in the VLA Monitoring Program222http://www.aoc.nrao.edu/smyers/calibration/ (Taylor & Myers, 2000). A total of 1.15 Jy of polarized flux was seen in the VLBA observations compared to 1.11 Jy seen by the VLA monitoring observation on 25 April 2002. For the current experiment the absolute EVPA is of secondary importance to detecting, or placing limits on, the linearly polarized flux density. No attempt has been made to correct the electric vector polarization angles for Faraday rotation, which is often significant on the parsec scale for AGN (Zavala & Taylor, 2003).
For each source we tapered the 15 GHz data to produce an image at comparable resolution to the full resolution 5 GHz image. We then combined the two images to generate a spectral index image. It is important to note that spectral index maps made from two datasets with substantially different () coverages (such as we present here) may suffer from significant systematic errors, especially in regions of extended emission.
4 Identified CSOs
In the following section we display results confirming 4 sources as bona-fide CSOs from our initial 20 candidates identified from the extremities of the VCS. We also present 4 sources we still regard as CSO candidates. CSOs are defined by linear size and symmetry rather than assumed youth of the object based on spectrum and compactness. Thus it is important to remember that not all gigahertz-peaked-spectrum (GPS) sources are CSOs. Ideally, a core component with a flatter spectrum than the hotspots on either side must be identified before sources can be confirmed as CSOs. For some CSOs with a jet axis very close to the plane of the sky the core may be so weak as to be undetectable yet a CSO identification can still be secured if there are symmetric edge-brightened hot spots and/or extended lobes. On the basis of morphology and spectral index (defined ), we reject 12 sources as core-jets. Although not used as a defining characteristic, the polarimetry results for the sources identified as CSOs are consistent with previous observations of CSOs. Identifications and redshifts are given for each target source in Table 1. In Table 2 properties of the images are given, along with the current classification of each source as CSO or Candidate CSO. And in Table 3 we present estimates of the properties (flux densities, spectral index, and polarized intensity) of dominant components within each source.
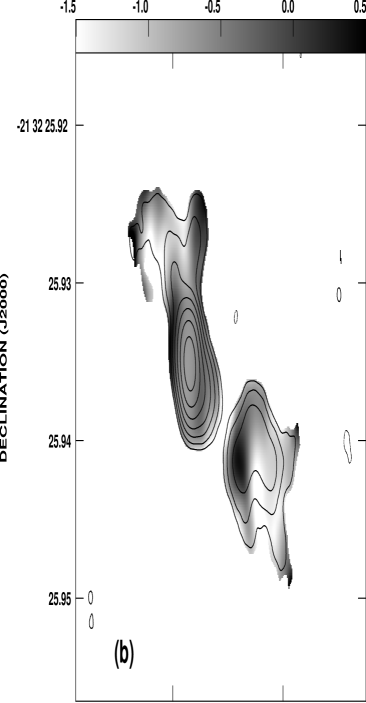
4.1 J0242-2132 (Candidate)
This source has been identified with a type “N” galaxy at a redshift of 0.314 (Wright & Otrupcek, 1990). The 5 GHz VLBA image (Fig. 1) shows a compact feature (labeled ’B’) with extended emission on either side. While it is tempting to identify component ’B’ with the center of activity, this component has a steep spectral index of 0.67 0.05. The 5 GHz polarimetry indicates that component ’B’ is polarized at the 1-3% level, with the maximum in polarization occurring on the eastern edge of the source. Generally the cores of radio galaxies are much less polarized (Pollack, Taylor & Zavala, 2003). Some flat-spectrum () emission is seen to the southwest of the peak, but there is no compact feature that can be unambiguously identified as the core. We conclude that this source is a good CSO candidate as the core is unlikely to be located at either extremity, but the exact nature of the source remains a mystery. If it is confirmed as a CSO it will be the first to be detected with polarized flux.
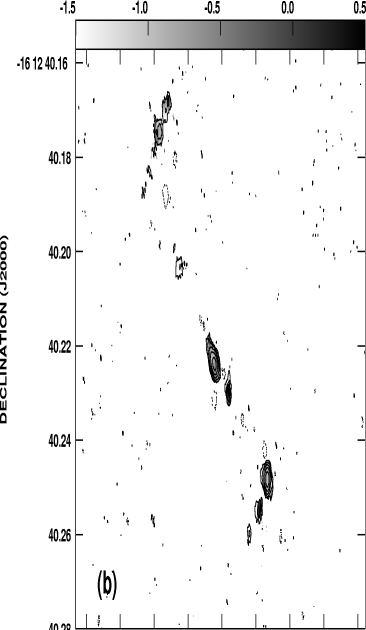
4.2 J0425-1612 (CSO)
Very little is known about this radio source at optical wavelengths. At 5 GHz (Fig. 2a) the source consists of a bright, slightly extended component to the southwest (’D’). It then extends in a linear series of components to the northeast extending over 80 mas, before bending by 90 degrees (component ’A’). A spectral index image (Fig. 2b) shows that the three strongest components are all fairly steep (between 0.6 and 1.0). There is a faint, compact, and inverted spectrum () component (’C’) that we identify with the center of activity. There is no detected polarized flux stronger than 0.72 mJy. We confirm this source as a CSO.
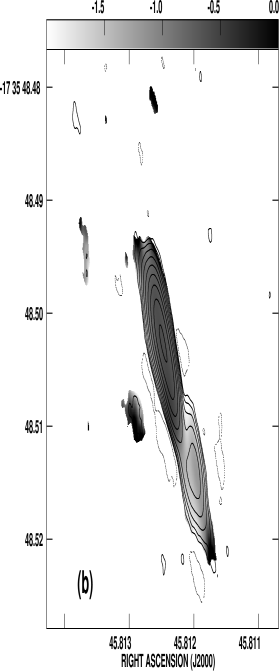
4.3 J0735-1735 (CSO)
This radio source has been used as a calibrator for the Radio Reference Frame (Johnston et al., 1995). At 5 GHz (Fig. 3a) the source appears to have the shape of a boomerang with the brightest component in the center. The entire source is steep spectrum with the center component marginally flatter () than the edge components. In the full resolution 15 GHz image (Fig. 3c), we see a compact component at the base of a predominantly one-sided jet. Some extended emission is visible on the counterjet side. We identify the compact component at the base of the jet with the center of activity. The core appears unpolarized, but there is a marginal detection of polarization at the level of 0.2% in the unresolved northern jet seen at 5 GHz. The polarization at the edge of the source reaches nearly 10% but given the noise in the image this is unlikely to be significant. We confirm this source as a CSO.
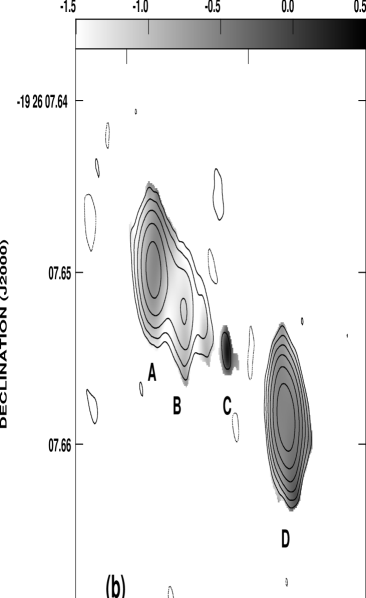
4.4 J1211-1926 (CSO)
No optical counterpart has been identified for this source. At 5 GHz (Fig. 4) the source has a classic CSO morphology with a compact inverted-spectrum core flanked by extended, steep-spectrum emission. The spectral index of component A on the east side (0.59) is marginally steeper than that of component D on the west end (0.53). No polarized flux density is detected to a limit of 1 mJy. We confirm this source as a CSO.
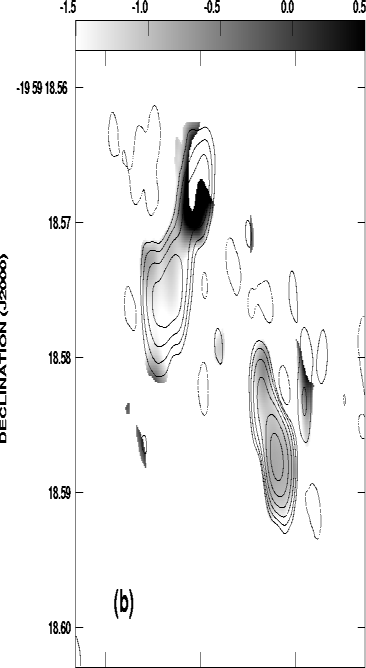
4.5 J1248-1959 (Candidate)
This source is identified with a 20.5 magnitude quasar at a redshift of 1.275 (O’Dea, Baum, & Stanghellini, 1991). Both the 5 and 15 GHz images have rather high noise owing to the orientation of the source combined with the poor () coverage obtained. The fidelity of the images is also probably quite low. In Fig. 5a. we identify two steep-spectrum components embedded and connected by diffuse emission. The more compact of these two components, B, has a marginally flatter spectrum (0.74 vs 0.92). A possibly inverted spectrum at the north end of the source is the result of essentially no emission at 5 GHz. Further observations are needed to confirm the existence of this feature. There is less than 1.5 mJy of polarized flux.
Based on the rather inconclusive data presented here, we cannot exclude the possibility that this source is a CSO, though that seems unlikely. Further observations will be needed to identify the location of the core.
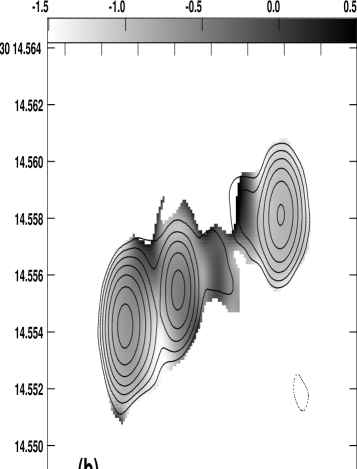
4.6 J1419-1928 (Candidate)
This source is associated with a magnitude 17.5 Seyfert 1 host galaxy at a redshift of z=0.12000+/-0.0005 (Hunstead, Murdoch, & Shobbrook, 1978). At 5 GHz (Fig. 6a), the source consists of a few roughly colinear components. Since we only obtained 4 scans, the sensitivity and (,) coverage is relatively poor. Some polarized flux is detected from the stronger components. At 15 GHz (Fig. 6b) the full resolution image shown in Fig. 6b resolves the source into a narrow jet. The location of the core component is not known. The spectral index is poorly determined due to the low quality of the 5 GHz data, but overall the source has a steep spectrum (). This source remains a CSO candidate.
4.7 J1935+8130 (Candidate)
This source, identified with a magnitude 21.1 galaxy, is the only candidate found among the northern cap sources. Fig. 7a shows a fairly classical CSO structure with two strong components connected by some fainter emission. The eastern component, A, is approximately twice as bright as the western one, C, and has a flatter spectrum (0.66 vs 0.94). Given this difference between the spectra it is possible that component A is the core. No polarized flux stronger than 1.5 mJy was detected. This source remains a CSO candidate pending further observations.
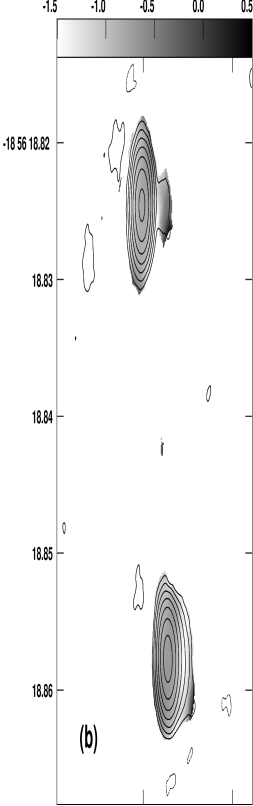
4.8 J2347-1856 (CSO)
Yet another little-studied source, there is a very faint object on the DSS, but as yet no identification or redshift. Fig. 8a shows a double radio source with components of very nearly equal flux density and spectra. No polarized flux stronger than 1.5 mJy was detected. Both components exhibit some faint extensions to the west, and are resolved at 15 GHz, but unresolved at 5 GHz. This structure is reminiscent of 1031+567 (Taylor et al., 2000), a well-studied CSO which is also lacking a detectable core. Given the extended, edge-brightened character of the lobes in J2347-1856, it seems reasonable to assume that a weak core must be located somewhere between them. We confirm this source as a CSO.
5 Current Status of the COINS Survey
Starting from VCS images of 425 sources we have selected 20 sources for followup VLBA observations at 5 and 15 GHz. From these, we have identified 4 CSOs and 4 CSO candidates. This detection rate of 2% is quite similar to that obtained for the northern part of the VCS (Peck & Taylor, 2000). As pointed out by Peck & Taylor (2000), this detection rate is much lower than that found in the PR sample of 7/65 (11%), or 18/411 (4.4%) found in the combined PR and CJ samples. We expect a slightly lower detection rate because the parent sample is comprised predominantly of flat spectrum sources. Nonetheless, this significantly lower detection rate may be a result of the reduced sensitivity and () coverage compared to the PR and CJ surveys, or it may be a real effect of looking at the fainter end of the luminosity function. To eliminate the possibility of missed sources due to observational restrictions, will require a large survey with observations of comparable quality to the follow-up study presented here. Simulations might also be useful, but would be hampered by the wide range of morphologies possible for CSOs.
Additional followup observations of CSOs and candidates identified in (Peck & Taylor, 2000) are currently ongoing and will be presented, along with a comprehensive list of all CSOs discovered in the COINS survey to date, in a future paper. Deep 15 GHz observations, as well as spectral line VLBI observations to search for neutral hydrogen and polarization studies, can help to confirm or reject sources still classified as CSO candidates. Proper motion studies to pinpoint the center of activity are also underway. Additional redshift data and flux densities at a wider range of frequencies will be presented as well. At that time, it will be possible to undertake statistical analyses of many CSO properties based on our complete sample, including range of redshifts and linear sizes, polarization levels, and flux densities.
References
- Antonucci (1993) Antonucci, R. 1993, ARA&A, 31, 473
- Beasley et al. (2002) Beasley, A. J., Gordon, D., Peck, A. B., Petrov, L., MacMillan, D. S., Fomalont, E. B., & Ma, C. 2002, ApJS, 141, 13
- Fanti et al. (1995) Fanti, C., Fanti, R., Dallacasa, D., Schilizzi, R. T., Spencer, R. E. & Stanghellini, C. 1995, A & A, 302, 317
- Fassnacht & Taylor (2001) Fassnacht, C. D. & Taylor, G. B. 2001, AJ, 122, 1661
- Hunstead, Murdoch, & Shobbrook (1978) Hunstead, R. W., Murdoch, H. S., & Shobbrook, R. R. 1978, MNRAS, 185, 149
- Johnston et al. (1995) Johnston, K. J. et al. 1995, AJ, 110, 880
- O’Dea, Baum, & Stanghellini (1991) O’Dea, C. P., Baum, S. A., & Stanghellini, C. 1991, ApJ, 380, 66
- Owsianik & Conway (1998) Owsianik, I. & Conway, J. E. 1998, A & A, 337, 690
- Pearson & Readhead (1988) Pearson, T. J., & Readhead, A. C. S. 1988, ApJ, 328, 114
- Peck et al. (1999) Peck, A. B., Taylor, G. B., & Conway, J. E. 1999, ApJ, 521, 103
- Peck & Taylor (2000) Peck, A. B. & Taylor, G. B. 2000, ApJ, 534, 90
- Peck & Taylor (2001) Peck, A. B. & Taylor, G. B. 2001, ApJ, 554, L147
- Polatidis et al. (1995) Polatidis, A. G., Wilkinson, P. N., Xu, W., Readhead, A. C. S., Pearson, T. J., Taylor, G. B., & Vermeulen, R. C. 1995, ApJS, 98, 1
- Polatidis & Conway (2003) Polatidis, A. G. & Conway, J. E. 2003, Publications of the Astronomical Society of Australia, 20, 69
- Pollack, Taylor & Zavala (2003) Pollack, L. K., Taylor, G. B., & Zavala, R. T. 2003, ApJ, in press, astro-ph/0302211
- Readhead et al. (1996a) Readhead, A. C. S., Taylor, G. B., Xu, W., Pearson, T. J., Wilkinson, P. N., & Polatidis, A. G. 1996a, ApJ, 460, 612
- Readhead et al. (1996b) Readhead, A. C. S., Taylor, G. B., Pearson, T. J., & Wilkinson, P. N. 1996b, ApJ, 460, 634
- Taylor et al. (1994) Taylor, G. B., Vermeulen, R. C., Pearson, T. J., Readhead, A. C. S., Henstock, D. R., Browne, I. W. A., & Wilkinson, P. N. 1994, ApJS, 95, 345
- Taylor et al. (1996) Taylor, G. B., Vermeulen, R. C., Readhead, A. C. S., Pearson, T. J., Henstock, D. R., & Wilkinson, P. N. 1996, ApJS, 107, 37
- Taylor & Vermeulen (1997) Taylor, G. B., & Vermeulen, R. C. 1997, ApJ, 485, L9
- Taylor et al. (1999) Taylor, G. B., O’Dea, C. P., Peck, A. B. & Koekemoer, A. M. 1999, ApJ, 512, L27
- Taylor et al. (2000) Taylor, G. B., Marr, J. M., Pearson, T. J. & Readhead, A.C.S. 2000 ApJ, 541, 112
- Taylor & Myers (2000) Taylor, G. B. & Myers, S. T. 2000 VLBA Scientific Memo 26, National Radio Astronomy Observatory
- Wright & Otrupcek (1990) Wright, A., & Otrupcek, R. 1990, Parkes Catalogue, Australia Telescope National Facility
- Zavala & Taylor (2003) Zavala, R. T. & Taylor, G. B. 2003, ApJ, in press, astro-ph/0302367


| Source | Alternate | |||||
|---|---|---|---|---|---|---|
| Name | Name | RA | Dec | ID | ||
| (1) | (2) | (3) | (4) | (5) | (6) | (7) |
| J0242-2132 | OD-267 | 02 42 35.909852 | 21 32 25.93498 | G | 17.0 | 0.314 |
| J0425-1612 | 04 25 53.572659 | 16 12 40.24837 | … | … | … | |
| J0735-1735 | IERS B0733-174 | 07 35 45.812484 | 17 35 48.50230 | … | … | … |
| J1211-1926 | 12 11 57.738693 | 19 26 07.65844 | … | … | … | |
| J1248-1959 | ON-176.2 | 12 48 23.898196 | 19 59 18.58763 | Q | 20.5 | 1.275 |
| J1419-1928 | CTS 0105 | 14 19 49.738769 | 19 28 25.26705 | G | 17.5 | 0.1200 |
| J1935+8130 | S5 1939+81 | 19 35 22.722370 | 81 30 14.55415 | G | 21.1 | … |
| J2347-1856 | OZ-174 | 23 47 08.626730 | 18 56 18.85778 | … | … | … |
Notes – (1) J2000 source name; (2) alternate source name; (3) Right
Ascension and (4) declination in J2000 coordinates from the VLBA
Calibrator Survey astrometric determination by Beasley et al. 2001;
(5) Optical host galaxy identification; (6) Optical Magnitude;
(7) redshift (see discussion of individual sources for references).
| Peak Flux | rms | Lowest | |||||
|---|---|---|---|---|---|---|---|
| Source | Freq. | Beam | (mJy | (mJy | Contour | Status | |
| Name | (GHz) | (mas) | beam-1) | beam-1) | (mJy) | ||
| J0242-2132 | 5.0 | 4.01.5 | 0 | 330 | 0.28 | 0.83 | CAND |
| 15.2 | 4.01.5 | 0 | 151 | 0.49 | 1.5 | ||
| J0425-1612 | 5.0 | 3.61.4 | 0 | 57.2 | 0.22 | 0.7 | CSO |
| 15.2 | 3.61.4 | 0 | 19.3 | 0.25 | 0.8 | ||
| J0735-1735 | 5.0 | 6.01.8 | 17 | 538 | 0.53 | 1.6 | CSO |
| 15.2 | 6.01.8 | 17 | 274 | 0.32 | 1.0 | ||
| J1211-1926 | 5.0 | 4.01.6 | 0 | 85.1 | 0.23 | 0.7 | CSO |
| 15.2 | 4.01.6 | 0 | 47.7 | 0.29 | 0.9 | ||
| J1248-1959 | 5.0 | 4.31.5 | 0 | 245 | 0.90 | 2.7 | CAND |
| 15.2 | 4.31.5 | 0 | 95.9 | 0.69 | 2.3 | ||
| J1419-1928 | 5.0 | 4.81.1 | 0 | 94.9 | 1.30 | 3.9 | CAND |
| 15.2 | 1.440.53 | 1.4 | 45.3 | 0.56 | 1.7 | ||
| J1935+8130 | 5.0 | 2.21.2 | 0 | 175 | 0.38 | 1.1 | CAND |
| 15.2 | 2.21.2 | 0 | 80.3 | 0.30 | 0.9 | ||
| J2347-1856 | 5.0 | 4.61.7 | 0 | 176 | 0.29 | 0.9 | CSO |
| 15.2 | 4.61.7 | 0 | 80.1 | 0.29 | 0.9 |
| Source | Comp. | P5 | m5 | |||
|---|---|---|---|---|---|---|
| (1) | (2) | (3) | (4) | (5) | (6) | (7) |
| J0242-2132 | A | 133.3 | 100.6 | 0.25 | 0.89 | 0.055 |
| B | 358.9 | 168.7 | 0.66 | 1.32 | 0.004 | |
| C | 190.0 | 59.2 | 1.02 | 0.89 | 0.026 | |
| J0425-1612 | A | 50.8 | 29.0 | 0.49 | 0.72 | 0.113 |
| B | 83.2 | 38.7 | 0.67 | 0.72 | 0.019 | |
| C | 4.2 | 5.3 | 0.20 | 0.72 | 0.350 | |
| D | 107.1 | 34.0 | 1.00 | 0.72 | 0.013 | |
| J0735-1735 | A | 673.4 | 340.1 | 0.60 | 1.21 | 0.042 |
| B | 300.2 | 161.4 | 0.54 | 1.10 | 0.002 | |
| C | 234.2 | 62.2 | 1.16 | 1.21 | 0.012 | |
| J1211-1926 | A | 39.4 | 20.4 | 0.59 | 0.83 | 0.021 |
| B | 28.2 | 8.6 | 1.06 | 0.83 | 0.030 | |
| C | 1.0 | 1.3 | 0.23 | … | … | |
| D | 135.1 | 73.9 | 0.53 | 0.83 | 0.009 | |
| J1248-1959 | A | 712.4 | 248.7 | 0.92 | 0.91 | 0.021 |
| B | 465.9 | 200.3 | 0.74 | 0.91 | 0.021 | |
| J1419-1928 | A | 164.1 | 121.1 | 0.27 | 2.28 | 0.025 |
| B | 83.2 | 55.2 | 0.36 | 2.16 | 0.048 | |
| J1935+8130 | A | 213.2 | 99.9 | 0.66 | 1.13 | 0.006 |
| B | 76.2 | 31.9 | 0.76 | 1.13 | 0.034 | |
| C | 118.9 | 40.7 | 0.94 | 1.13 | 0.013 | |
| J2347-1856 | A | 213.1 | 80.2 | 0.85 | 1.09 | 0.007 |
| B | 247.4 | 104.4 | 0.75 | 1.09 | 0.006 |
Notes – (1) J2000 source name; (2) component (see individual figures);
(3) integrated flux density of the component at 4.98 GHz as derived from
Gaussian model-fitting to the visibility data;
(4) integrated flux density of the component at 15.2 GHz as derived from
Gaussian modelfitting to the visibility data; (5) spectral index
between 4.98 and 15.2 GHz; (6) peak polarized intensity
of the component at 5 GHz, or
3 limit; (7) fractional polarization at the peak or 3 limit.