Optical Photometry and Spectroscopy of the SN 1998bw-like Type Ic Supernova 2002ap
Abstract
We present optical photometric and spectral data of the peculiar Type Ic SN 2002ap. Photometric coverage includes bands from 2002 January 30, the day after discovery, through 2002 December 12. There are 5 early-time spectra and 8 in the nebular phase. We determine that SN 2002ap is similar to SN 1997ef and the GRB-associated SN 1998bw with respect to spectral and photometric characteristics. The nebular spectra of SN 2002ap present the largest Mg I] to [O I] , 6364 ratio of any supernova spectra yet published, suggesting that the progenitor of SN 2002ap was a highly stripped star. Comparing the nebular spectra of SN 1985F and SN 2002ap, we notice several similar features, casting the classification of SN 1985F as a normal Type Ib supernova in doubt. We also present nebular modeling of SN 2002ap and find that the object ejected of material within the outer velocity shell of the nebula ( km s-1) and synthesized of 56Ni.
1 INTRODUCTION
Core-collapse supernovae (SNe) are classified by their spectral (e.g., Filippenko 1997) and photometric properties (e.g., Patat et al. 1993). There are overwhelming indications that the observational differences in these objects result from differences in their progenitor stars. Red supergiants with a full, massive hydrogen envelope collapse to form SNe of Type II plateau; the “plateau” refers to a period of relatively unchanged optical brightness after maximum brightness. SNe of Type Ib occur through the same core-collapse process as Type II, except the progenitors are stripped of their outer hydrogen layer by either stellar winds or transfer to a companion; thus, the resulting spectra lack hydrogen. If further stripping occurs to the point of removing the deeper helium layer, the SN is considered to be of Type Ic.
Recently, a subclass of SNe Ic has been identified as having unusually high-velocity early-time ejecta reaching velocities of 30,000 km s-1(Galama et al., 1998). Models indicate that these objects can have up to 10 times the kinetic energy per unit mass of normal core-collapse SNe (Iwamoto et al. 1998; see, however, Höflich et al. 1999 for a model in which this type of event is caused by an aspherical explosion with normal SN Ic energetics). Besides being among the most energetic events in the Universe, one particular example of this subclass, SN 1998bw, has been associated with a long-duration gamma-ray burst (GRB 980425; Galama et al. 1998). This discovery strongly supports the hypothesis that the physical process associated with long-duration GRBs (at least those of low gamma-ray luminosity, like GRB 980425) is linked to the core collapse of stripped stars. Very recently, the optical afterglow of another, more luminous GRB (GRB 030329) also exhibited weak spectral features closely resembling those of SN 1998bw; accordingly, it has been given a supernova designation (SN 2003dh; Garnavich et al. 2003; Chornock et al. 2003; Stanek et al. 2003).
SN 2002ap was discovered on 2002 January 29.4 (UT dates will be used throughout this paper) in the nearby spiral galaxy M74 by Y. Hirose (Nakano et al., 2002). Reaching a peak brightness of mag, SN 2002ap was well observed. Spectra were quickly obtained, and SN 2002ap was identified as a SN Ic similar to SN 1998bw (Kinugasa et al., 2002; Meikle et al., 2002; Gal-Yam, Shemmer, & Dann, 2002; Filippenko & Chornock, 2002).
SN 2002ap has been closely followed in X-ray, radio, and optical bands. Specifically, Berger, Kulkarni, & Chevalier (2002) discovered synchrotron self-absorption at radio wavelengths and Sutaria et al. (2003) found inverse-Compton scattering in X-rays. At early times, SN 2002ap had an inferred intrinsic continuum polarization of . When modeled in terms of the oblate, electron-scattering atmospheres of Höflich (1991) this implies an asymmetry of at least 20% (Leonard et al. 2002; see also Kawabata et al. 2002 and Wang et al. 2003).
Mazzali et al. (2002) modeled the light curve and spectrum of SN 2002ap using early-time data. This model predicts a kinetic energy of ergs, an ejected mass of , and a synthesized 56Ni mass of 0.07 . The model also predicts that the progenitor of SN 2002ap had a main-sequence mass of . Maeda et al. (2003) fit a two-component model to a bolometric light curve of SN 2002ap constructed from several optical and infrared data sets.
In this paper, we present both early and late-time optical photometry and spectroscopy of SN 2002ap. (Some preliminary results were discussed by Filippenko 2003.) Along with an analysis of these data and comparisons with other stripped core-collapse SNe, we calculate a model of the nebular spectra, complementing the early-time modeling of Mazzali et al. (2002). In Section 2, we present photometry in bands from the day after discovery and lasting for 10 months. In Section 3, we show 13 spectra ranging from 5 d to 386 d after maximum. Section 4 contains the results of our nebular modeling. We summarize our conclusions in Section 5.
2 Photometry
2.1 Photometric Observations and Data Reductions
On 2002 January 30, one day after the discovery of SN 2002ap, the Katzman Automatic Imaging Telescope (KAIT; Filippenko et al., 2001) at Lick Observatory began a monitoring program that lasted until 2002 March 9 when solar conjunction prevented further observations. After the SN became visible again in the morning skies, we obtained additional photometry using the 1.0-m Nickel telescope at Lick Observatory and the 1.5-m Oscar Meyer telescope at Palomar Observatory.
KAIT obtained images of SN 2002ap (600 s in the band and 300 s in bands) using an Apogee AP7 CCD camera, which has a back-illuminated SITe pixel CCD. At the Cassegrain focus of KAIT, the 24 m pixel of the chip yields a scale of pixel-1, making the total field of view of the camera . The typical seeing at KAIT is 3 full width at half maximum (FWHM), so the CCD images are well sampled.
For late-time observations, the camera at the Nickel telescope with a back-illuminated pixel Loral CCD was used in a 22 binned mode, yielding a scale of pixel-1 and a total field of view of (Li et al., 2001). The typical images from the Nickel telescope have FWHM , so once again the images are well sampled.
Late-time observations with the Palomar 1.5-m telescope were made with the thinned pixel “CCD 13” in the unbinned mode. Each pixel is 24 m in size for a scale of pixel-1. Observations were made near an airmass of 1.06 with exposure times 600 s and 300 s in Johnson and Cousins filters, respectively. The typical seeing for these data was , yielding well-sampled images.
For the KAIT images, dark-current subtraction and twilight-sky flatfielding were done automatically at the telescope. Since the KAIT camera is thermoelectrically cooled, the camera temperature is somewhat unstable, and thus the dark current is not always cleanly subtracted from each image. Consequently, there is a small dark-current residual which varies from night to night that must be removed manually by adding or subtracting fractions of a long-exposure dark image. Negligible uncertainties in the photometry are introduced by the manual removal of the dark-current residuals since the SN and comparison stars are rather bright (Li et al., 2001). Cosmic-ray removal was accomplished with the IRAF111IRAF (Image Reduction and Analysis Facility) is distributed by the National Optical Astronomy Observatories, which are operated by the Association of Universities for Research in Astronomy, Inc., under a cooperative agreement with the National Science Foundation. cosmicray procedure in the DAOPHOT package (Stetson, 1987). Reductions of the Lick Nickel and Palomar observations were routine, not necessitating manual adjustment of the dark-current image because the CCDs are cooled with liquid nitrogen.
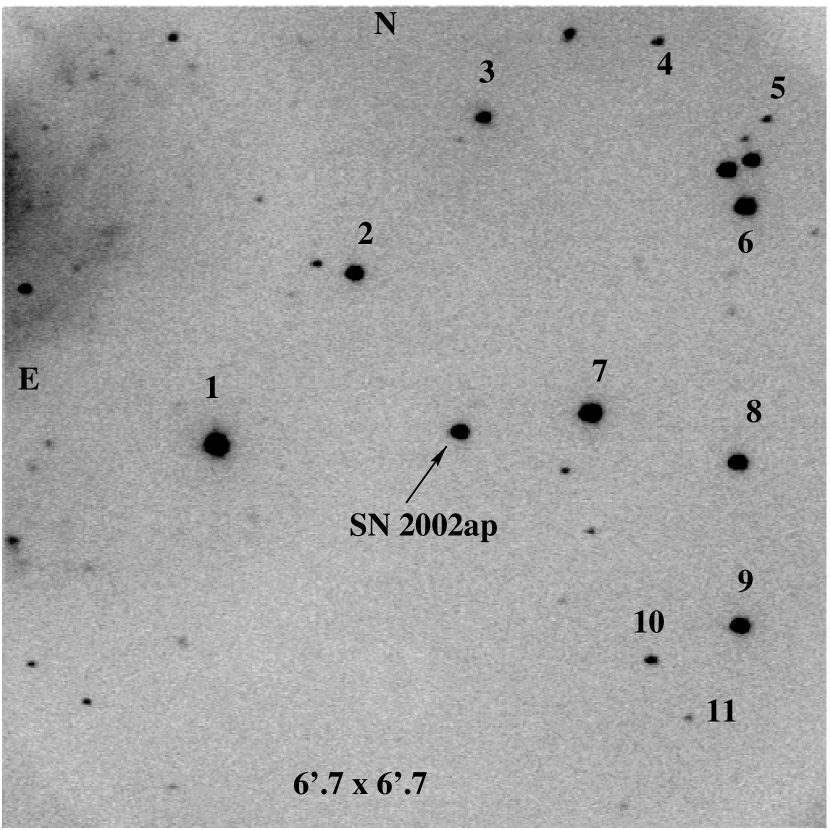
Figure 1 shows a KAIT -band image of SN 2002ap and 11 local standard stars taken on 2002 February 2.1. Absolute calibration of the field in was accomplished with the Nickel telescope on 2002 June 11, June 12, and July 9 under photometric conditions. Calibrations for were obtained from Henden (2002). Table 1 shows photometry of the local standard stars acquired from those observations. Henden (2002) also provides calibrations for the same stars which agree with our calibrations very well (within 0.02 mag of each other).
| Star ID | |||||
|---|---|---|---|---|---|
| 1 | 12.955 (0.009) | 1.195 (0.032) | 1.175 (0.025) | 0.803 (0.020) | 1.443 (0.006) |
| 2 | 13.824 (0.014) | 0.203 (0.023) | 0.715 (0.013) | 0.430 (0.010) | 0.830 (0.012) |
| 3 | 14.624 (0.006) | 0.001 (0.015) | 0.577 (0.008) | 0.344 (0.005) | 0.689 (0.012) |
| 4 | 17.221 (0.015) | 0.515 (0.047) | 0.815 (0.084) | 0.557 (0.047) | 0.984 (0.037) |
| 5 | 18.044 (0.032) | 0.920 (0.151) | 1.060 (0.084) | 0.734 (0.030) | 1.258 (0.035) |
| 6 | 13.248 (0.008) | 0.302 (0.020) | 0.759 (0.009) | 0.453 (0.009) | 0.877 (0.006) |
| 7 | 13.111 (0.007) | 0.276 (0.013) | 0.741 (0.007) | 0.458 (0.009) | 0.867 (0.001) |
| 8 | 13.713 (0.010) | 0.061 (0.016) | 0.613 (0.006) | 0.383 (0.005) | 0.751 (0.006) |
| 9 | 13.944 (0.016) | 0.509 (0.014) | 0.862 (0.008) | 0.532 (0.019) | 1.002 (0.016) |
| 10 | 16.851 (0.011) | 0.165 (0.157) | 0.497 (0.033) | 0.320 (0.027) | 0.687 (0.028) |
| 11 | 18.492 (0.023) | 0.188 (0.087) | 0.654 (0.069) | 0.429 (0.100) | 0.841 (0.068) |
Note. — Units are magnitudes. Uncertainties are indicated in parentheses.
Since SN 2002ap is located about from the nucleus of M74 and far from any bright spiral arms, we used simple aperture photometry to measure the instrumental magnitudes for SN 2002ap and the local standard stars in the KAIT images, when the SN was still bright. All local standard stars were measured except Stars 5 and 11, which usually had poor signal to noise ratio in the KAIT images. For the , , and observations of 2002 January 30, Stars 2, 3, and 6 were not included in the images and thus were not measured.
For the Lick 1.0-m Nickel and Palomar 1.5-m observations, we applied the point-spread-function (PSF) fitting technique to measure the instrumental magnitudes of SN 2002ap and the local standard stars, as the SN had already become quite faint in these images. The brightest stars (e.g., Stars 1, 6, 7, 8, and 9) are often saturated in these relatively deep images, and we used all the other unsaturated local standard stars to construct a PSF for each image. During the PSF-fitting process we also found that Stars 1 and 7 have nonstellar PSFs when they are not saturated, especially in the and bands, which are probably caused by the superimposition of some faint red background stars.
The instrumental magnitudes thus measured are converted to the standard Johnson-Cousins system using the following transformation equations:
Here, as in Modjaz et al. (2000), the lower-case bandpass letters signify our instrumental magnitudes and the upper-case bandpass letters denote magnitudes in the Johnson-Cousins system. The constants indicate differences between the zero points of the instrumental and standard systems, and the color-term coefficients for each telescope and setup are summarized in Table 2. Stars 1 and 7 were not used in the transformation due to their nonstellar profile as noted above.
During the transformation process, we found some peculiarities for the local standard Stars 2 and 3. When differential photometry was performed between SN 2002ap and these two stars for the KAIT images, the resulting magnitudes for SN 2002ap were systematically different (brighter by and , respectively) from these derived from the other comparison stars. Yet, for the Lick 1.0-m and the Palomar 1.5-m images, both stars yielded measurements consistent with the other stars. We initially suspected that these were two variable stars, but their brightness remained the same during all the Nickel observations that spanned nearly 200 days. Another possible cause is that these two stars have peculiar colors, and when observed with CCD cameras of different quantum efficiency curves, their brightness may be systematically overestimated or underestimated, but the two stars seem to have quite normal colors compared to the other local standard stars. We were thus unable to find the cause of this inconsistency, and were forced to not use these two stars in the transformation. Fortunately, there are still enough local standard stars in the field that provide consistent measurements for the magnitudes of SN 2002ap, so we expect that our final photometry is not affected by this inconsistency.
| Telescope | |||||
|---|---|---|---|---|---|
| KAIT | 0.085 | 0.043 | 0.035 | 0.070 | 0.01 |
| Nickel 1.0-m | 0.080 | 0.060 | 0.100 | 0.035 | |
| Palomar 1.5-m | 0.080 | 0.015 | 0.120 | 0.115 |
Table 3 lists the final results from all of our observations of SN 2002ap, showing the early-time KAIT data and the late-time Nickel and Palomar data. Uncertainties, given in parentheses, were determined by combining in quadrature the errors given by the photometry routines in DAOPHOT with those introduced by the transformation of instrumental magnitudes onto the standard system. The uncertainties are dominated by the transformation errors at all times except for the very latest Nickel observations when SN 2002ap became fainter than 19 mag.
To double check our calibration of the SN 2002ap field and the final photometry of SN 2002ap, we compared our results with those reported in the literature. Our calibration of the SN 2002ap field is consistent (to within 0.02 mag) with those reported by Henden (2002), Gal-Yam, Ofek, & Shemmer (2002), and Yoshii et al. (2003), including Stars 2 and 3. Our photometry of SN 2002ap is also generally consistent with that reported by Yoshii et al. (2003) to within 0.03 mag, although the difference in the band can be as large as 0.15 to 0.2 mag. Notice that Yoshii et al. (2003) used only one local standard star (Star 7 in Figure 1) which is probably contaminated by other stars as discussed above, but they adopted an aperture that is sufficiently large to include light in the whole system at all times.
2.2 Distance and Reddening
Schlegel, Finkbeiner, & Davis (1998) estimate the Galactic interstellar reddening in the direction of M74 to be mag. As shown in Section 3, this value is in agreement with the color excess derived from the narrow Na I D lines in our spectra. Reddening of SN 2002ap from the gas in M74 is estimated by Klose, Guenther, & Woitas (2002) to be mag based on the Na I D1 absorption feature at the redshift of that galaxy in a spectrum of SN 2002ap. The total extinction of mag is clearly dominated by Galactic sources, which is to be expected in light of the projected distance of SN 2002ap from the nucleus of M74. The Galactic and host extinction in each band were then calculated using conversion factors in O’Donnell (1994), assuming a Galactic dust model for M74. The results of this procedure are summarized in Table 4.
Currently, there is no Cepheid distance to M74. Using photometry of the brightest red and blue stars in the system, Sharina, Karachentsev, & Tikhonov (1996) and Sohn & Davidge (1996) found distance moduli of 29.32 mag and 29.3 mag, respectively. This distance modulus corresponds to a distance of 7.3 Mpc. Earlier studies of M74 give distance moduli which span a range of about 5 mag, but the values from Sharina et al. and Sohn & Davidge are both in the middle of this range and very consistent with each other. The internal error given by Sharina et al. is 0.11 mag. Sharina et al. also determined that the mean distance modulus for the M74 group is 29.46 mag differing by 0.14 mag from their distance modulus for M74, resulting in a distance of 7.8 Mpc to the M74 group. We will adopt the difference between the distance modulus of M74 and its group (which is larger than the internal error reported by Sharina et al.) as the uncertainty in the distance modulus. The error in the distance modulus of 0.14 mag clearly overwhelms the uncertainty in the reddening ( 0.01 mag) in any discussion of the absolute magnitude of SN 2002ap. The absolute magnitude of SN 2002ap derived from a distance modulus of 29.32 mag is presented in Table 4.
2.3 Optical Light Curves
Figure 2 displays our light curves of SN 2002ap. The maximum brightness and time of maximum brightness in each band were estimated by fitting polynomials to the data points. Since the light curves are well sampled near maximum, there is little uncertainty in our results. Table 4 lists the date and magnitude of peak brightness in each band as determined by the fits. All relative dates are normalized such that corresponds to maximum on 2002 Feb . Mazzali et al. (2002) indicate that the explosion occurred on Jan , 8 d before maximum and 0.5 d before discovery.
| JD - | |||||
|---|---|---|---|---|---|
| 2452300 | (mag) | (mag) | (mag) | (mag) | (mag) |
| 04.67 | 14.014 (0.074) | 14.417 (0.023) | 13.841 (0.026) | 13.596 (0.024) | 13.699 (0.015) |
| 05.63 | 13.200 (0.031) | 13.451 (0.015) | 13.130 (0.021) | 13.136 (0.020) | 13.281 (0.018) |
| 06.62 | 13.029 (0.031) | 13.172 (0.018) | 12.803 (0.021) | 12.845 (0.024) | 13.019 (0.029) |
| 07.62 | 12.933 (0.037) | 12.978 (0.021) | 12.575 (0.020) | 12.651 (0.017) | 12.837 (0.024) |
| 08.62 | 12.859 (0.039) | 12.857 (0.017) | 12.410 (0.016) | 12.490 (0.016) | 12.718 (0.023) |
| 09.63 | 12.834 (0.033) | 12.786 (0.019) | 12.318 (0.028) | 12.397 (0.021) | 12.604 (0.017) |
| 10.62 | 12.878 (0.039) | 12.728 (0.019) | 12.228 (0.024) | 12.280 (0.015) | 12.483 (0.023) |
| 11.63 | 12.921 (0.039) | 12.726 (0.028) | 12.158 (0.017) | 12.194 (0.018) | 12.384 (0.026) |
| 14.63 | 13.350 (0.034) | 12.885 (0.013) | 12.143 (0.018) | 12.079 (0.023) | 12.240 (0.019) |
| 15.63 | 13.504 (0.045) | 12.964 (0.018) | 12.155 (0.020) | 12.068 (0.019) | 12.207 (0.020) |
| 16.63 | 13.683 (0.050) | 13.064 (0.015) | 12.231 (0.021) | 12.089 (0.016) | 12.217 (0.018) |
| 17.63 | 13.866 (0.058) | 13.152 (0.023) | 12.241 (0.024) | 12.092 (0.016) | 12.177 (0.027) |
| 18.63 | 14.013 (0.041) | 13.278 (0.016) | 12.331 (0.020) | 12.130 (0.018) | 12.222 (0.026) |
| 20.63 | 14.287 (0.041) | 13.482 (0.017) | 12.470 (0.022) | 12.209 (0.018) | 12.245 (0.023) |
| 21.63 | 14.417 (0.047) | 13.560 (0.026) | 12.528 (0.026) | 12.253 (0.024) | 12.271 (0.022) |
| 26.64 | 14.923 (0.057) | 14.027 (0.021) | 12.870 (0.024) | 12.505 (0.021) | 12.411 (0.022) |
| 27.63 | 15.092 (0.040) | 14.070 (0.024) | 12.942 (0.023) | 12.574 (0.023) | 12.451 (0.020) |
| 29.63 | 15.116 (0.051) | 14.237 (0.029) | 13.093 (0.023) | 12.687 (0.019) | 12.527 (0.024) |
| 30.63 | 15.106 (0.066) | 14.311 (0.023) | 13.179 (0.025) | 12.751 (0.018) | 12.561 (0.027) |
| 33.64 | 15.470 (0.037) | 14.499 (0.040) | 13.421 (0.026) | 12.940 (0.018) | 12.658 (0.025) |
| 34.64 | 15.518 (0.059) | 14.604 (0.023) | 13.495 (0.022) | 13.033 (0.022) | 12.744 (0.022) |
| 35.64 | 15.543 (0.066) | 14.650 (0.026) | 13.591 (0.027) | 13.095 (0.031) | 12.789 (0.026) |
| 37.64 | 15.691 (0.075) | 14.778 (0.023) | 13.728 (0.029) | 13.241 (0.023) | 12.886 (0.015) |
| 38.64 | 15.647 (0.087) | 14.837 (0.023) | 13.808 (0.033) | 13.307 (0.024) | 12.933 (0.020) |
| 42.64 | 15.003 (0.030) | 14.041 (0.047) | |||
| 137.00aaLick Observatory, Nickel 1-m telescope. | 16.364 (0.016) | 15.870 (0.021) | 15.195 (0.023) | 14.945 (0.027) | |
| 137.99aaLick Observatory, Nickel 1-m telescope. | 16.353 (0.020) | 15.903 (0.017) | 15.203 (0.020) | 15.001 (0.017) | |
| 164.99aaLick Observatory, Nickel 1-m telescope. | 16.778 (0.026) | 16.457 (0.017) | 15.576 (0.020) | 15.494 (0.026) | |
| 165.99aaLick Observatory, Nickel 1-m telescope. | 16.802 (0.024) | 16.481 (0.015) | 15.604 (0.025) | 15.538 (0.029) | |
| 192.98aaLick Observatory, Nickel 1-m telescope. | 17.302 (0.020) | 17.135 (0.023) | 16.077 (0.020) | 16.042 (0.017) | |
| 224.96aaLick Observatory, Nickel 1-m telescope. | 17.802 (0.023) | 17.797 (0.017) | 16.525 (0.018) | 16.672 (0.019) | |
| 226.00aaLick Observatory, Nickel 1-m telescope. | 17.868 (0.023) | 17.781 (0.034) | 16.524 (0.026) | 16.640 (0.038) | |
| 251.85bbPalomar Observatory, Oscar Meyer 1.5-m telescope. | 18.284 (0.032) | 18.217 (0.027) | 17.011 (0.030) | 17.133 (0.064) | |
| 251.87bbPalomar Observatory, Oscar Meyer 1.5-m telescope. | 18.316 (0.032) | 18.317 (0.027) | 16.906 (0.030) | 17.169 (0.064) | |
| 252.82bbPalomar Observatory, Oscar Meyer 1.5-m telescope. | 18.316 (0.029) | 18.285 (0.041) | 16.970 (0.037) | 17.098 (0.064) | |
| 282.75aaLick Observatory, Nickel 1-m telescope. | 18.614 (0.096) | 18.751 (0.043) | 17.460 (0.038) | 17.628 (0.053) | |
| 283.80aaLick Observatory, Nickel 1-m telescope. | 18.785 (0.073) | 18.814 (0.037) | 17.456 (0.037) | 17.664 (0.047) | |
| 313.74aaLick Observatory, Nickel 1-m telescope. | 19.281 (0.095) | 19.201 (0.050) | 17.927 (0.062) | 18.156 (0.063) | |
| 320.69aaLick Observatory, Nickel 1-m telescope. | 19.256 (0.091) | 19.328 (0.083) | 18.053 (0.050) | 18.307 (0.071) |
Note. — Uncertainties are indicated in parentheses. Corrected for the reddening indicated in Table 4.
| Filter | |||||
|---|---|---|---|---|---|
| UT Date (2002) | Feb 4.1 | Feb 5.8 | Feb 7.8 | Feb 10.1 | Feb 11.5 |
| JD – 2452300 | 9.61 (0.08) | 11.43 (0.22) | 13.42 (0.16) | 15.74 (0.18) | 17.02 (0.20) |
| Days past ExplosionaaDate of explosion is 2002 Jan. 28.9 (JD =2452303.4) as calculated by Mazzali et al. (2002). | 6.2 | 7.9 | 9.9 | 12.2 | 13.6 |
| App. Mag | 13.245 (0.005) | 13.059 (0.005) | 12.387 (0.006) | 12.267 (0.003) | 12.323 (0.005) |
| Adopted Extinction | 0.413 | 0.348 | 0.263 | 0.199 | 0.127 |
| Abs. Mag | (0.2) | (0.2) | (0.2) | (0.2) | (0.2) |
Note. — Uncertainties are indicated in parentheses.

In the following sections, we discuss the behavior of SN 2002ap in each bandpass relative to the stripped core-collapse SNe 1994I (Richmond et al., 1996; Richmond, 2003), 1999ex (Stritzinger et al., 2002), 1998bw (Galama et al., 1998; Sollerman et al., 2002), 1997ef (Garnavich, 2003), and 1985F (Tsvetkov, 1986), when the data are available in that bandpass. In each of the comparison plots (Figures 3 through 7) the light curves have been normalized to the time of maximum for each supernova and to the same peak magnitude in the plotted band.
Since SN 2002ap exhibits unusually high expansion velocities in its spectra at early times similar to those of the GRB-associated SN 1998bw, we include the light curves of SN 1998bw for comparison in . We also compare SN 2002ap to the prototypical SN Ic 1994I and the SN Ib/c 1999ex in . Because of limited available data, we display only the -band light curve of the high-velocity SN Ic 1997ef, another peculiarly energetic event like SN 1998bw. Because of a lack of data in other bands, we only examine the -band light curve of SN 1985F, which has a similar nebular-phase spectrum to that of SN 2002ap.
2.3.1 Band

Figure 3 shows the -band light curve of SN 2002ap with the light curves of SNe 1994I, 1999ex, and 1998bw. Before maximum at d, SN 2002ap rose more quickly than SN 1999ex. After maximum brightness, SN 1998bw declined slower than any of these, while SN 2002ap declined slightly faster than SN 1999ex until d when observations of SN 1999ex ceased. SN 1994I declined more quickly than all other SNe.
2.3.2 Band

Figure 4 shows the -band light curve of SN 2002ap with the light curves of SNe 1994I, 1999ex, 1998bw, and 1985F. Before maximum, SN 2002ap rises faster than SN Ib/c 1999ex and the high-velocity SN Ic 1998bw. It appears that SN 2002ap rises at the same rate as (or slower than) SN Ic 1994I, but this conclusion is not definitive because of a relatively late discovery of SN 1994I.
¿From maximum brightness until d, SN 2002ap declines similarly to SN 1994I, and SNe 1998bw and 1999ex decline more slowly. After d, the decline rate of SN 2002ap is relatively stable, while SN 1994I starts declining more rapidly. SN 2002ap follows SN 1998bw until around d (at a slightly fainter magnitude relative to the peak) when SN 1998bw begins its slower late-time decline phase. SN 1999ex closely follows SN 1998bw until d, after which it begins fading more rapidly to follow the light curve of SN 2002ap.
Notice that SN 1985F has an extremely wide light curve relative to even the energetic SNe 1998bw and 2002ap. The slow rise and decline of the light curve suggest high energetics and a large 56Ni mass as in SN 1997ef (Iwamoto et al. 2000; cf. the light curve of SN 1997ef in Section 2.3.3).
At late times, SN 2002ap declines at a mean rate of and mag day-1 at d and d, respectively. Data are only available at late times for SN 1998bw in until d ( mag day-1) and after d ( mag day-1). SN 2002ap seems to have faded more quickly than SN 1998bw at late times. We cannot conclude that SN 2002ap faded more quickly than SN 1998bw during the interval d because of a lack of data. In addition, SN 1985F declines at a rate of about mag day-1 at late times, much slower than SNe 1998bw and 2002ap, and at d is still about 1.5 mag brighter than either of these SNe. However, the early data for SN 1985F are sparse, which may have resulted in a poor calculation of its peak magnitude.
2.3.3 Band

We present the SN 2002ap -band light curve along with other comparison curves in Figure 5. Before maximum at d, SNe 2002ap and 1994I rise much more quickly than SNe 1999ex and 1999bw; as in , however, SN 2002ap rises slightly more slowly than SN 1994I.
After maximum brightness ( d), SNe 2002ap, 1999ex, and 1998bw decline in a similar manner. The decline occurs at a significantly slower rate than the rise, unlike for SN 1994I, which fades precipitously after maximum. At d, SN 1998bw fades at a slower rate as it enters its late-time decline phase; meanwhile SN 2002ap continues its rapid decline.
SNe 2002ap, 1998bw, and 1997ef also have similar peaks, being noticeably broader than that of SN 1994I. Such broad peaks seem to be a characteristic of the high-velocity SN Ic “hypernovae,” as noted for SN 1997ef by Iwamoto et al. (2000). However, as discussed by Clocchiatti & Wheeler (1997), SN Ib/c light curves are heterogeneous, consisting of both fast and slow decliners. Clocchiatti & Wheeler (1997) determined SN 1994I to be a fast decliner, while Stritzinger et al. (2002) established that SN 1999ex is a slow decliner. Most SNe Ic tend to be fast decliners, but SN 1990B is an example of a slow-declining SN Ic (Clocchiatti et al., 2001). This heterogeneity is apparent from the light curves presented here.
During times d and d, SN 2002ap fades at a mean rate of and mag day-1 (respectively) in the band. SN 1998bw, on the other hand, fades at a nearly constant rate of mag day-1 during the interval d, so SNe 2002ap and 1998bw decline at nearly the same rate here during the nebular phase. In the early nebular phase, d, SN 1997ef declines at a mean rate of mag day-1, much slower than either of the other two SNe.
2.3.4 Band

-band light curves of SNe 2002ap, 1999ex, 1998bw, and 1994I are presented in Figure 6. For the first 6 days, to d, SNe 2002ap and 1994I rise very quickly compared with SNe 1998bw and 1999ex, although SN 2002ap rises at a rate somewhat intermediate to SNe 1994I and 1998bw. SN 1994I reaches maximum at d past maximum, while SNe 2002ap, 1999ex, and 1998bw each reach maximum at d.
After maximum, SNe 1998bw, 1999ex, and 2002ap decline together for 16 d ( d). Thereafter, SN 1998bw declines more slowly, while SNe 2002ap and 1999ex continue their earlier decline. Compared with the other SNe, SN 1994I fades precipitously after maximum.
In the late phase, SN 2002ap ( mag day-1, d) fades at a mean rate slightly faster than SN 1998bw ( mag day-1, d).
2.3.5 Band

The -band light curves of SNe 2002ap, 1998bw, 1999ex, and 1994I are presented in Figure 7. As with the other bands, SNe 2002ap and 1994I rise quickly relative to SNe 1998bw and 1999ex before maximum, with SN 2002ap intermediate between the rest. SN 2002ap then reaches maximum later than all the other SNe, but is most nearly coincident with the maximum of SN 1999ex.
In the post-maximum decline, SN 2002ap behaves like SN 1998bw until d, after which SN 1998bw begins declining slightly faster. This is the opposite of what is observed in , where after this time, SN 2002ap begins to decline slightly faster than SN 1998bw. The light curve of SN 1999ex also exhibits a behavior similar to SNe 2002ap and 1998bw in its post-maximum decline, but at a slightly lower magnitude relative to the peak. After this epoch, the light curves of SNe 2002ap, 1998bw, and 1999ex begin to converge toward their late-time decline phases. As in the other bands, SN 1994I declines very quickly after maximum and is not similar to any of the other SNe during this time.
At late times, SNe 2002ap and 1998bw decline at mean rates of and mag day-1 during the intervals d and d, respectively. Again, as in the other bands, SN 2002ap fades slightly more quickly than SN 1998bw in the nebular phase.
2.4 Optical Color Curves
In Figures 8, 9, and 10 we respectively present (), (), and () color curves of SN 2002ap and two comparisons, SNe 1998bw and 1994I. Since the reddenings for the comparison SNe are not well known, we present all the curves uncorrected for reddening.
The color curves in Figure 8 show that the color evolution of SN 2002ap is similar to that of SN 1998bw, but significantly different from that of SN 1994I in the early post-maximum epoch. However, a lack of late-time data for SN 1994I prevents a late-time comparison with SN 2002ap.

All three SNe show an approximately linear increase in color at d, although their slopes differ somewhat. At later times, SN 2002ap and SN 1998bw both exhibit a linear decrease in color after d, until for SN 2002ap and until d for SN 1998bw. The late-time () data for SN 2002ap are sparse, but after d SN 2002ap appears to reach a plateau phase of nearly constant color.
The () color evolution of SN 2002ap differs dramatically from the () evolution. SN 2002ap and SN 1998bw appear to show similarities in early decline rate from d to d and in a linear increase in color between d and d. SN 1994I also displays somewhat similar behavior during these days. After d, SN 2002ap exhibits a dramatic change, by becoming increasingly redder to a maximum at d, after which it appears to enter another plateau phase. This behavior is mimicked by SN 1998bw at these late times. This epoch is similar to the plateau phase in ().

Figure 10 shows the () color evolution of the SNe. At early times, SN 2002ap shows more similarities to SN 1994I, increasing in a similar, linear way. Both SNe rise quite dramatically from d to d, while SN 1998bw has entered a plateau phase at this time. Both SNe 2002ap and 1994I have a larger change in () color than SN 1998bw. At late times ( d), SN 2002ap becomes redder at a minimal rate, slightly reversing this trend only in the last few days. SN 1998bw displays similar behavior, only decreasing d later.

2.5 Overall Photometric Results
In , SN 2002ap rises quickly like the normal SN Ic 1994I, while it declines slowly like the high-velocity SN Ic 1998bw and the SN Ib/c 1999ex, making its light curves distinctly broader than those of a “normal,” SN 1994-like SN Ic. At late times, SN 2002ap is again more photometrically similar to SN 1998bw than to a normal SN Ic.
Our photometric parameters listed in Table 4 agree reasonably well with those found by Pandey et al. (2003) and Yoshii et al. (2003). Pandey et al. report that there is a “flattening” of the optical light curves, where after d the flux decline rates are 0.02 mag day-1 in all passbands until solar conjunction. However, we did not observe this flattening because our observations ceased approximately when Pandey et al. began to see this effect. Also, Yoshii et al. (2003) state that the rise rate before peak is almost independent of bandpass, while the post-maximum decline rate is steepest in and is progressively shallower through . Our data show wavelength-dependent photometric evolution not only after maximum, but also before (Figure 2).
The color evolution of SN 2002ap is quite similar to the evolution of SN 1998bw and dissimilar from the evolution of SN 1994I. However, the () colors of SNe 2002ap and 1994I are relatively similar.
3 SPECTROSCOPY
Our spectroscopic observations of SN 2002ap began on 2002 February 11.2, 5.4 d after maximum and 13.3 d after the time of explosion found by Mazzali et al. (2002). They were halted 2002 March 11 when the supernova was in solar conjunction, but resumed on 2002 June 8.5 on a semi-regular basis.
Data were obtained with the Kast double spectrograph (Miller & Stone, 1993) mounted on the Lick Observatory 3-m Shane telescope, the Low Resolution Imaging Spectrometer (LRIS; Oke et al. 1995) mounted on the 10-m Keck I telescope, and the Echellette Spectrograph and Imager (ESI; Sheinis et al. 2002) mounted on the 10-m Keck II telescope. The position angle of the slit was generally aligned along the parallactic angle to reduce differential light losses (Filippenko, 1982). Table 5 lists the journal of observations.
| ResolutionccApproximate spectral resolution derived from night-sky lines. | Range | Air | SeeingeeAverage value of the full width at half maximum (FWHM) of the spatial profile for each set of observations, rounded to the nearest 05. | Exposure | ||||
|---|---|---|---|---|---|---|---|---|
| DayaaDay since -band maximum, 2002 Feb 5.8 (HJD 2,452,311.3). To calculate the day since estimated date of explosion, add 7.9 (Mazzali et al., 2002). | UT Date | TelescopebbKast = Lick 3-m/Kast double spectrograph (Miller & Stone, 1993); LRIS(p) = Keck-I 10-m/Low Resolution Imaging Spectrometer (Oke et al. 1995; LRIS, “p” denotes polarimeter mounted); ESI = Keck-II 10-m/Echellette Spectrograph and Imager (Sheinis et al. 2002; ESI). | (Å) | (Å) | MassddBeginning airmass for each set of observations. | (arcsec) | (s) | ObserverffAB = Aaron Barth, AF = Alex Filippenko, BS = Brandon Swift, DL = Doug Leonard, EM = Ed Moran, MP = Marina Papenkova, RC = Ryan Chornock, RF = Ryan Foley, SJ = Saurabh Jha, WL = Weidong Li. |
| 5.4 | 2002 Feb 11.2 | Kast | 12 | 3300-10400 | 1.7 | 3.0 | 400 | AF, RC |
| 8.4 | 2002 Feb 14.2 | LRISp | 12 | 3800-10100 | 1.6 | 2.0 | 900 | AF, AB |
| 8.5 | 2002 Feb 14.3 | LRISp | 12 | 3930-8830 | 2.2 | 2.5 | 2400 | AF, AB |
| 8.5 | 2002 Feb 14.3 | LRISp | 12 | 3800-10100 | 3.3 | 4.5 | 1100 | AF, AB |
| 15.4 | 2002 Feb 21.2 | Kast | 6 | 3300-10400 | 3.9 | 3.5 | 1200 | WL, RC |
| 29.4 | 2002 Mar 7.2 | LRISp | 12 | 3900-8800 | 2.7 | 1.5 | 1200 | AF, DL, EM |
| 29.5 | 2002 Mar 7.3 | LRISp | 12 | 3900-8800 | 3.7 | 2.0 | 940 | AF, DL, EM |
| 33.3 | 2002 Mar 11.1 | Kast | 7 | 3300-10400 | 3.0 | 2.5 | 1200 | WL, RC |
| 122.7 | 2002 Jun 8.5 | Kast | 6 | 3290-10275 | 3.5 | 7.0 | 1200 | AF, RC, RF |
| 131.7 | 2002 Jun 17.5 | Kast | 8 | 4280-7040 | 2.3 | 4.0 | 500 | AF, RC, RF |
| 155.7 | 2002 Jul 11.5 | Kast | 6 | 3150-10400 | 1.4 | 1.5 | 1400 | AF, RC, RF |
| 184.6 | 2002 Aug 9.4 | Kast | 7 | 3160-10400 | 1.2 | 2.5 | 1200 | AF, RF, MP, BS |
| 237.3 | 2002 Oct 1.1 | Kast | 7 | 3240-10400 | 1.4 | 2.0 | 1800 | AF, RF |
| 241.7 | 2002 Oct 8.5 | LRIS | 6 | 3200-9300 | 1.2 | 1.0 | 600 | AF, RC |
| 273.6 | 2002 Nov 6.4 | ESI | 1.5ggResolution at 6000 Å. ESI resolution is 75 km s-1 across the entire wavelength range. | 4000-10100 | 1.0 | 1.5 | 600 | AF, SJ, RC |
| 335.6 | 2003 Jan 7.4 | LRIS | 6 | 3215-9280 | 2.6 | 2.0 | 600 | AF, RC |
| 386.4 | 2003 Feb 27.2 | LRIS | 6 | 3200-9390 | 1.9 | 1.0 | 700 | AF, RC |
Note. — LRISp observations were performed in dual-beam mode with a 15 slit and a D680 dichroic separating the blue and red parts of the spectrum; an OG570 order-blocking filter was also inserted on the red side. LRIS observations used a D560 dichroic and a 10 slit. ESI observations used a 10 slit. A D550 dichroic and either a 30 or 20 slit were used for all Lick observations.
All data were reduced using standard techniques as described by Li et al. (2001) and references therein. Flatfields for the red CCD were taken at the position of the object to reduce near-IR fringing effects. The spectra were corrected for atmospheric extinction and telluric bands (Bessell, 1999; Matheson et al., 2000c), and then flux calibrated using standard stars observed at similar airmass on the same night as the SN. All spectra in this paper have been deredshifted by the NED222The NASA/IPAC Extragalactic Database (NED) is operated by the Jet Propulsion Laboratory, California Institute of Technology, under contract with the National Aeronautics and Space Administration. redshift of each SN’s host galaxy ( for SN 2002ap). The SN 2002ap spectra were dereddened by the overall reddening of mag as determined in Section 2.2. The zero-velocity Na I D lines in our ESI spectrum have an equivalent width of 0.4 Å. By the relationship proposed in Barbon et al. (1990), this corresponds to a Galactic reddening of mag, which is consistent with the value we have determined. All other spectra were also dereddened by the appropriate Galactic value from Schlegel, Finkbeiner, & Davis (1998).
We display our early-time SN 2002ap spectra in Figure 11. Line identifications for the early-time and late-time spectra are shown in Figure 12. With a lack of hydrogen, helium, and strong Å Si II features, SN 2002ap is classified as a SN Ic (Kinugasa et al., 2002; Meikle et al., 2002; Gal-Yam, Shemmer, & Dann, 2002). The high velocities present at early times indicate that the object produced an especially large energy per unit mass of the ejecta. The broad features at 4500 and 5400 Å resemble those in the spectra of SN 1998bw, the prototypical “hypernova” associated with GRB 980425 (Galama et al., 1998). The type Ic classification, large velocities, and spectral similarity to SN 1998bw caused many to classify SN 2002ap as a “hypernova.”

Mazzali et al. (2002) attributed the feature at 3800 Å in the early-time spectra of SN 2002ap (see Figure 12) to Ca II H & K. The broad feature from 4700 to 5400 Å is caused by an iron blend. The small feature at 5700 Å was attributed to either Na I or He I. However, for reasons discussed below, the progenitor of SN 2002ap probably had very little helium; hence, the feature is most likely Na I. The features from 6000 to 6400 Å, from 7400 to 8000 Å, and from 8100 to 8700 Å are Si II, O I, and Ca II, respectively.


In Figure 13, we present an early-time spectral comparison of SN 2002ap with the “hypernovae” SNe 1998bw and 1997ef as well as the normal SN Ic 1994I at early times. SN 2002ap is very similar to SN 1998bw, somewhat similar to SN 1997ef (over the very limited available wavelength range), and less similar to SN 1994I. Specifically, SN 1994I has narrower lines and much better-developed P-Cygni profiles for the Na I D and Ca II near-IR triplet lines, with very strong absorption components. The size of the Ca II triplet relative to other features can be used to identify the age of a SN Ic (Matheson et al., 2000c). This suggests that SN 2002ap evolved more slowly than SN 1994I.
Figure 13 also shows that certain spectral features are washed out with higher velocity. Specifically, SN 1994I has a significant dip in the spectra around 5400 Å. This feature is also present in the SN 2002ap spectrum, although not as prominent, but is not visible in the SN 1998bw spectrum. This washing out is indicative of higher energy per unit mass.

Comparisons of velocity widths of the O I line and the Ca II IR triplet for SNe 2002ap, 1998bw, and 1994I are shown in Figure 14. For SN 2002ap, Filippenko & Chornock (2002) measured a photospheric velocity from O I of 9000 km s-1 at 5 d after maximum. This is consistent with measurements from Gal-Yam, Ofek, & Shemmer (2002) and similar to SN 1998bw at the same epoch. The figure shows that SN 1998bw has a slightly lower photospheric velocity at 9 d after maximum than SN 2002ap at 5 d past maximum. Photospheric velocity decreases rapidly at early times, but slows about a week after maximum. The large photospheric velocity seen in SN 2002ap suggests that SN 2002ap is more energetic per unit mass of ejecta than normal SNe Ic such as SN 1994I.
¿From both the photometric light curves and the spectral comparisons, it is evident that SN 2002ap ages more quickly than SN 1998bw or SN 1997ef. The faster aging and the lower velocities derived from the line widths indicate that SN 2002ap is less energetic than SN 1998bw (Kinugasa et al., 2002). Likewise, the slower aging relative to SN 1994I suggests that SN 2002ap is more energetic than normal SN Ic (for energetic comparisons, see Table 7).

The nebular spectra of SN 2002ap shown in Figures 12 and 15 have incredibly strong [O I] , 6364 and Mg I] emission. The Mg I] line grows over time with respect to the [Ca II] , 7324 doublet and the [O I] doublet. In our latest spectrum (taken on 2003 February 27, 386 d past maximum), the Mg I] integrated flux is 40% the [O I] integrated flux. Since we see farther into the core of the progenitor with time, we are probably peering directly into the Mg-O layer. It is expected that observations at later times will show an even larger Mg I] to [O I] ratio.
As seen in Figure 16, the features of SNe 2002ap, 1998bw, 1997ef, 1985F, and 1994I are all similar, but the relative strengths of some emission lines differ. Relative to [Ca II] , 7324, the Mg I] emission is strongest in SN 2002ap, with the other SNe having about the same line strength. The other striking difference is the very strong O I and Ca IR triplet in the spectrum of SN 1997ef. In contrast, the [O I] , 6364 and [Ca II] , 7324 have about the same strength in SN 1997ef as in the other SNe. The stronger permitted lines relative to forbidden lines is likely due to denser radiating material in SN 1997ef. Indeed, the excess emission near 5400 Å may be Fe II emitted by dense clouds, as in SN 1987F (Filippenko, 1989).
Another prominent feature is the near-IR Ca II triplet. This blend decreases in strength over time relative to [Ca II]. Matheson et al. (2000b, c) found that the strength of the Ca II triplet depends heavily on age for SNe Ib/c, and should decrease in strength over time, consistent with our spectra.
The feature covering 5200 to 5600 Å is probably a mixture of Mg and Fe lines. From modeling, we have seen that the shoulder of the feature may be [Fe II], whereas the emission at 5190 Å is probably Mg I]. In some SNe with very dense ejecta, however, Filippenko (1989, SN 1987F) suggests that Fe II lines dominate.
The line profiles of Mg I] and [O I] , 6364 seen in Figures 12 and 15 are very sharp. Figure 17 shows these lines in detail. The lines have a narrow component at 555 km s-1 relative to the systemic velocity of M74 on top of a slightly broader base, as first seen by Leonard et al. (2002). Our ESI spectrum has a high resolution of 75 km s-1, confirming the results of Leonard et al. (2002). These profiles can be caused either by low-velocity gas clouds near the center of the forming nebula or from material lost earlier or expelled by the progenitor that is now in the circumstellar environment of SN 2002ap (for example, SN 1999cq; Matheson et al., 2000a). The other strong emission lines ([Ca II] , 7329; Ca II IR triplet) might weakly show this profile; however, this is uncertain due to line blending.


Table 6 lists the relative line strengths for each nebular epoch of SN 2002ap. To compute these values, first we fit a cubic spline to a local continuum around each line. After subtracting the continuum, we integrated the flux in the lines. Since the examined lines are rather broad, other lines may add significant flux to the wings (especially for the Ca II IR triplet; Filippenko & Sargent 1986 showed that [C I] contributes to this feature). Furthermore, to avoid obvious adjacent, close lines, we made somewhat arbitrary determinations of the endpoints of each line. Changing these boundaries by a few Å will change the integrated flux slightly. Although this method is somewhat inaccurate, it does show that the Mg I] increases in strength and the near-IR Ca triplet decreases in strength over time relative to [Ca II]. SN 2002ap had a Mg/O ratio comparable to that of SN 1994I, but larger than that of SN 1998bw.
| Days Past | Mg I] | [O I] | [Ca II] | Near-IR Ca II | Mg/O | |
|---|---|---|---|---|---|---|
| Supernova | Maximum | (4571 Å) | (6300, 6364 Å) | (7291, 7324 Å) | (8498, 8542, 8662 Å) | Ratio |
| SN 2002ap | 0.66 | 2.75 | 1 | 1.85 | 0.24 | |
| SN 2002ap | 155.7 | 0.66 | 2.53 | 1 | 1.43 | 0.26 |
| SN 2002ap | 184.6 | 0.74 | 2.35 | 1 | 1.01 | 0.32 |
| SN 2002ap | 237.3 | 0.80 | 2.29 | 1 | 0.63 | 0.35 |
| SN 2002ap | 241.7 | 0.72 | 2.17 | 1 | 0.91 | 0.33 |
| SN 2002ap | 273.6 | 0.63 | 2.01 | 1 | 0.66 | 0.31 |
| SN 2002ap | 335.6 | 1.00 | 2.29 | 1 | 0.45 | 0.43 |
| SN 2002ap | 386.4 | 0.87 | 2.19 | 1 | 0.46 | 0.40 |
| SN 1998bw | 215 | 0.23 | 1.47 | 1 | 0.41 | 0.15 |
| SN 1994I | 146 | 0.26 | 0.97 | 1 | 0.84 | 0.26 |
| SN 1985F | 240 | 0.26 | 3.15 | 1 | 0.56 | 0.08 |
Note. — All values given relative to the integrated flux of the [Ca II] , 7324 emission of each spectrum. The blue-side shutter of LRIS was not functional when the 336 d spectrum was obtained, and thus the scaling between features redward of 5500 Å and blueward of 5500 Å may be somewhat erroneous. The calibration of the 242 d spectrum may be faulty at the longest wavelengths, making the relative flux of the Ca II near-IR triplet especially uncertain.
Comparisons to other SNe Ic at late times confirm that SN 2002ap has the strongest oxygen and magnesium lines of any SN yet published. The best comparison is to SN 1998bw, which has strong [O I] emission, but its Mg I] line is much weaker relative to either [O I] or Ca II than in SN 2002ap.
4 MODELING
We modeled the nebular spectra of SN 2002ap using a non-LTE nebular code (Mazzali et al., 2001). (Preliminary results in agreement with those presented here are given by Mazzali et al. 2003.) The code computes -ray deposition in a nebula of constant density and homogeneous composition, and produces a synthetic spectrum by balancing the collisional heating resulting from the -ray deposition and the cooling via line emission. Emission is mostly in forbidden lines, but some permitted transitions (e.g., Ca II) are also strong if the conditions are favorable. The model is characterized by the outer velocity of the nebula, which is derived essentially by fitting the width of the emission lines; the mass of 56Ni, which provides the heating; and the masses of the various elements required to reproduce the observed emission lines. The mass of 56Fe is derived from the decay of 56Ni. Since Fe lines are observed, all masses can be determined uniquely for a given distance and reddening.
The nebular spectra of SN 2002ap are similar to those of SN 1998bw. The strongest feature is [O I] , 6364. However, the blend of [Fe II] lines observed at 5200 Å is much weaker in SN 2002ap than in SN 1998bw. Qualitatively, this is a confirmation of the suggestion that SN 2002ap synthesized much less 56Ni than SN 1998bw. Unfortunately, this makes it difficult to determine the mass of 56Ni with high precision, as the [Fe II] feature is typically observed with a small signal-to-noise ratio and blends with other lines may affect the measured flux. Also, as noted above, the Mg I] line is much stronger, relative to the [O I] line, in SN 2002ap.
In order to increase the accuracy of our diagnostics, we therefore modeled three spectra, observed at different epochs. For all spectra we find that the outer velocity of the nebula is 5500 km s-1, and the 56Ni mass is . The ejecta mass contained within the outer velocity is . This mass is consistent with the corresponding value derived from the explosion model used by Mazzali et al. (2002). The model ejecta extend to much larger velocities. However, material at the highest velocities is too thin to contribute to net emission. Hence, the estimated mass here is a lower limit to the total ejecta mass.
Approximately of the ejecta mass is O, while Si and S contribute a combined mass of , and the mass of C is . The Mg mass is relatively small, , which is, however, sufficient to form a strong line, and the same holds for Ca.
The value of the 56Ni mass derived from these nebular models is slightly larger than that derived from fitting the peak of the light curve. This is required mainly to fit the peak of the emission lines of [O I] and Mg I]. However, these peaks are distinctly narrower than the rest of the lines, as was the case for SN 1998bw. This may indicate the presence of an inner concentration of matter (O, Mg), a possible signature of an asymmetric explosion (Maeda & Nomoto, 2003).

Figure 18 shows a comparison of the nebular spectrum of SN 2002ap observed on 2002 July 11, and a synthetic spectrum computed with a NLTE, 1-zone code. The fiducial epoch of the spectrum is 163 days after explosion.
5 DISCUSSION AND CONCLUSIONS
The strong O and Mg emission, along with the lack of H and He, suggest that SN 2002ap is a core-collapse event, where the hydrogen, helium, and perhaps most of the carbon/oxygen layers are stripped. The high velocities in the early spectra further support this hypothesis since more massive outer layers generally decelerate the ejected material more than less massive outer layers. In addition, stripping the outer layers decreases the amount of ejecta, which in turn causes the kinetic energy per unit of ejecta mass to increase.
The photometric and spectroscopic data suggest that SNe 2002ap, 1998bw, 1997ef, and 1994I are all related events. However, SN 1994I is distinctly different photometrically and spectroscopically from the other three SNe. The results of modeling of the spectra of these SNe are presented in Table 7. These models suggest that SNe 2002ap, 1998bw, and 1997ef may be unusually energetic SNe Ic. Because of their higher 56Ni mass, the gamma-ray trapping for SNe 1998bw and 1997ef was greater, resulting in broad light curves, while the light curves of the normal SN Ic 1994I are narrower and fade more rapidly. However, the 56Ni mass of SN 2002ap is not significantly higher than that of SN 1994I, yet SN 2002ap has much broader light curves. In addition, SN 1999ex has broad light curves without showing the high-velocity ejecta characteristic of SNe 1998bw and 2002ap (for a discussion of fast and slow-declining SNe Ib/c, see Clocchiatti & Wheeler 1997). SNe 2002ap and 1994I produced a similar 56Ni mass, despite the slightly larger energy of the former. Therefore, 56Ni mass is not a sufficient indicator of a peculiar SN Ic event similar to SN 1998bw.
| Kinetic Energy | ||||
|---|---|---|---|---|
| Supernova | 56Ni () | Ejecta Mass () | ( ergs) | Reference |
| SN 2002ap | 0.09 | 1.5 | Mazzali et al. (2002) | |
| SN 1998bw | 0.7 | 10.9 | Iwamoto et al. (1998) | |
| SN 1997ef | 0.13 | 9.6 | 17.5 | Mazzali et al. (2000) |
| SN 1994I | 0.07 | 0.88 | 1 | Nomoto et al. (1994) |
Note. — As noted by Höflich et al. (1999), an asymmetric explosion can reduce the energetics of these events.
The lack of hydrogen and helium, along with the strong [O I] and Mg I] lines in the nebular spectrum of SN 2002ap, suggest that the progenitor’s outermost layers were stripped.
The stripped nature of the progenitor of SN 2002ap can be further investigated by examining the levels of magnesium and oxygen in its nebular spectra. A more heavily stripped star should reveal more of the oxygen/magnesium/neon shell, and therefore less of the carbon/oxygen shell, resulting in more magnesium (relative to oxygen) present in the nebular spectrum. The large Mg/O ratio of SN 2002ap relative to other SNe Ic indicates that we are seeing deep into the core of the progenitor of SN 2002ap, suggesting that the progenitor’s carbon/oxygen layer was more stripped than the progenitors of most SNe Ic including SN 1998bw. However, since no strong neon transitions are seen in the nebular spectrum, it is inconclusive whether the carbon/oxygen layer of the progenitor was completely stripped, revealing the oxygen/neon/magnesium layer. Modeling suggests that no realistic star can contain enough neon to show a strong, unblended neon line in the nebular phase. In addition, mixing and excitation effects may play a significant role in nebular [O I] and Mg I] lines. Perhaps if there were a strong unblended optical carbon line, one could see Mg I] increase and the carbon line decrease with increased stripping.
It has been suggested that SN 1985F was of type SN Ib (Matheson, 2000). However, there are only late-time spectra of SN 1985F, starting 160 d past maximum. The similarity of the SN 1985F spectrum in Figure 16 to that of SN 2002ap (specifically the [O I]/[Ca II] ratio), coupled with the very broad -band peak, suggests that SN 1985F was not a SN Ib and was probably a high-velocity SN Ic.
Currently, there is a debate over how SNe 1998bw, 1997ef, 2002ap, and their spectrally similar cousins should be classified (see Gal-Yam, Ofek, & Shemmer 2002 for a discussion). Many researchers have called SN 2002ap a “hypernova.” However, the explosion energy of SN 2002ap was probably only slightly higher than that of a normal SN Ic, unlike the case for the more powerful SN 1998bw. Also, SN 2002ap showed no evidence of relativistic ejecta at radio wavelengths (Berger, Kulkarni, & Chevalier, 2002). Moreover, the “hypernova” classification distracts casual readers of the literature from the physical process involved in an event like SN 2002ap. Since “hypernovae” are probably the result of the core-collapse of a massive star, we feel these events should still be classified as supernovae.
The second portion of the classification discussion centers around calling these events Type Ic, Ic-peculiar, or Id. Since the spectra of SN 2002ap-like events are quite different from prototypical SN Ic spectra (such as SN 1994I), these events should not be classified as normal Type Ic. However, the spectra of these events are not drastically different from those of normal SNe Ic.
This degree of similarity and heterogeneity is seen with peculiar SNe Ia. In particular, despite the fact that the premaximum spectrum of SN 1991T contained no Si II or Ca II, which are defining characteristics of a SN Ia, SN 1991T is considered a SN Ia and was not given its own classification of “Ix.” Furthermore, the spectrum of SN 1991bg contained strong Ti II features, deviating from a typical SN Ia spectrum, but SN 1991bg is still considered to be a SN Ia (see Filippenko 1997 for a review of these objects). To distinguish an object similar to the prototype SN 1991T (or SN 1991bg) from “normal” SNe Ia, we classify it as a SN 1991T-like (or a SN 1991bg-like) SN Ia.
Since SNe 2002ap, 1998bw, and 1997ef all have spectra similar to that of SN 1994I (a typical SN Ic), with the presence of high-velocity lines being the largest difference, we feel it is unnecessary to use the “SN Id” designation for these objects. Instead, by continuing the syntax established with peculiar SNe Ia, we propose that a SN with a spectrum similar to that of SN 1998bw be classified as a SN 1998bw-like SN Ic. Under this naming scheme, the correct classification for SN 2002ap is that of a “SN 1998bw-like SN Ic.”
References
- Barbon et al. (1990) Barbon, R., Benetti, S., Rosino, L., Cappellaro, E., & Turatto, M. 1990, A&A, 237, 79
- Berger, Kulkarni, & Chevalier (2002) Berger, E., Kulkarni, S. R., & Chevalier, R. A. 2002, ApJ, 577, L5
- Bessell (1999) Bessell, M. S. 1999, PASP, 111, 1426
- Chornock et al. (2003) Chornock, R., Foley, R. J., Filippenko, A. V., Papenkova, M., & Weisz, D. 2003, IAU Circ. 8114
- Clocchiatti & Wheeler (1997) Clocchiatti, A., & Wheeler, J. C. 1997, ApJ, 491, 375
- Clocchiatti et al. (2001) Clocchiatti, A., et al. 2001, ApJ, 553, 886
- Filippenko (1982) Filippenko, A. V. 1982, PASP, 94, 715
- Filippenko (1989) Filippenko, A. V. 1989, AJ, 97, 726
- Filippenko (1997) Filippenko, A. V. 1997, ARA&A, 35, 309
- Filippenko (2003) Filippenko, A. V. 2003, in ¿From Twilight to Highlight: The Physics of Supernovae, ed. W. Hillebrandt & B. Leibundgut (Berlin: Springer-Verlag), 171
- Filippenko & Chornock (2002) Filippenko, A. V., & Chornock, R. 2002, IAU Circ. 7825
- Filippenko et al. (2001) Filippenko, A. V., Li, W. D., Treffers, R. R., & Modjaz, M. 2001, in Small-Telescope Astronomy on Global Scales, ed. W. P. Chen, C. Lemme, & B. Paczyński (San Francisco: Astron. Soc. Pacific, Conf. Ser. Vol. 246), 121
- Filippenko & Sargent (1986) Filippenko, A. V., & Sargent, W. L. W. 1986, AJ, 91, 691
- Filippenko et al. (1995) Filippenko, A. V., et al. 1995, ApJ, 450, L11
- Galama et al. (1998) Galama, T. J., et al. 1998, Nature, 395, 670-672
- Gal-Yam, Ofek, & Shemmer (2002) Gal-Yam, A., Ofek, E. O., & Shemmer, O. 2002, MNRAS, 332, L73
- Gal-Yam, Shemmer, & Dann (2002) Gal-Yam, A., Shemmer, O., & Dann, J. 2002, IAU Circ. 7811
- Garnavich et al. (2003) Garnavich, P., Matheson, T., Olszewski, E. W., Harding, P., & Stanek, K. Z. 2003, IAU Circ. 8114
- Garnavich (2003) Garnavich, P. 2003, private communication
- Henden (2002) Henden, A. 2002, GCN Circ. 1242
- Höflich (1991) Höflich, P. 1991, A&A, 246, 481
- Höflich et al. (1999) Höflich, P., Wheeler, J. C., & Wang, L. 1999, ApJ, 521, 179
- Iwamoto et al. (1998) Iwamoto, K., et al. 1998, Nature, 395, 672
- Iwamoto et al. (2000) Iwamoto, K., et al. 2000, ApJ, 534, 660
- Kawabata et al. (2002) Kawabata, K. S., et al. 2002, ApJ, 580, L39
- Kinugasa et al. (2002) Kinugasa, K., Kawakita, H., Ayani, K., Kawabata, T., & Yamaoka, H. 2002, IAU Circ. 7811
- Klose, Guenther, & Woitas (2002) Klose, S., Guenther, E., & Woitas, J. 2002, GRB Circular Network, 1248
- Leonard et al. (2002) Leonard, D. C., Filippenko, A. V., Chornock, R., & Foley, R. J. 2002, PASP, 114, 1333
- Li et al. (2001) Li, W. D., et al. 2001, PASP, 113, 1178
- Maeda & Nomoto (2003) Maeda, K., & Nomoto, K. 2003, ApJ, submitted (astro-ph/0304172)
- Maeda et al. (2003) Maeda, K., Mazzali, P. A., Deng, J., Nomoto, K., Yoshii, Y., Tomita, H., & Kobayashi, Y. 2003, ApJ, in press (astro-ph/0305182)
- Matheson (2000) Matheson, T. 2000, Ph.D. thesis, University of California, Berkeley
- Matheson et al. (2000a) Matheson, T., Filippenko, A. V., Chornock, R., Leonard, D. C., & Li, W. 2000a, AJ, 119, 2303
- Matheson et al. (2000b) Matheson, T., Filippenko, A. V., Ho, L. C., Barth, A. J., & Leonard, D. C. 2000b, AJ, 120, 1499
- Matheson et al. (2001) Matheson, T., Filippenko, A. V., Li, W., & Leonard, D. C. 2001, AJ, 121, 1648
- Matheson et al. (2000c) Matheson, T., et al. 2000c, AJ, 120, 1487
- Mazzali et al. (2000) Mazzali, P. A., Iwamoto, K., & Nomoto, K. 2000, ApJ, 545, 407
- Mazzali et al. (2001) Mazzali, P. A., Nomoto, K., Patat, F., & Maeda, K. 2001, ApJ, 559, 1047
- Mazzali et al. (2002) Mazzali, P. A., et al. 2002, ApJ, 572, L61
- Mazzali et al. (2003) Mazzali, P. A., Nomoto, K., Deng, J., Maeda, K., & Qiu, Y. 2003, in From Twilight to Highlight: The Physics of Supernovae, ed. W. Hillebrandt & B. Leibundgut (Berlin: Springer-Verlag), 246
- Meikle et al. (2002) Meikle, P., Lucy, L., Smartt, S., Leibundgut, B., Lundqvist, P., & Ostensen, R. 2002, IAU Circ. 7811
- Miller & Stone (1993) Miller, J. S., & Stone, R. P. S. 1993, Lick Obs. Tech. Rep. No. 66 (Santa Cruz, CA: Lick Obs.)
- Modjaz et al. (2000) Modjaz, M., Li, W. D., Filippenko, A. V., King, J. Y., Leonard, D. C., Matheson, T., Treffers, R. R., & Riess, A. G. 2000, PASP, 113, 308
- Nakano et al. (2002) Nakano, S., Kushida, R., Kushida, Y., & Li, W. 2002, IAU Circ. 7810
- Nomoto et al. (1994) Nomoto, K., Yamaoka, H., Pols, O. R., van den Heuvel, E. P. J., Iwamoto, K., Kumagai, S., & Shigeyama, T. 1994, Nature, 371, 227
- O’Donnell (1994) O’Donnell, J. E. 1994, ApJ, 422, 158
- Oke et al. (1995) Oke, J. B., et al. 1995, PASP, 107, 375
- Pandey et al. (2003) Pandey, S. B., Anupama, G. C., Sagar, R., Bhattacharya, D., Sahu, D. K., & Pandey, J. C. 2003, MNRAS, submitted (astro-ph/0209507)
- Patat et al. (1993) Patat, F., Barbon, R., Cappellaro, E., & Turatto, M. 1993, A&AS, 98, 443
- Richmond (2003) Richmond, M. W. 2003, private communication
- Richmond et al. (1996) Richmond, M. W., Treffers, R. R., Filippenko, A. V., & Paik, Y. 1996, AJ, 112, 732
- Schlegel, Finkbeiner, & Davis (1998) Schlegel, D. J., Finkbeiner, D. P., & Davis, M. 1998, ApJ, 500, 525
- Sharina, Karachentsev, & Tikhonov (1996) Sharina, M. E., Karachentsev, I. D., & Tikhonov, N. A. 1996, A&AS, 119, 499
- Sheinis et al. (2002) Sheinis, A. I., Bolte, M., Epps, H. W., Kibrick, R. I., Miller, J. S., Radovan, M. V., Bigelow, B. C., & Sutin, B. M. 2002, PASP, 114, 851
- Sohn & Davidge (1996) Sohn, Y., & Davidge, T. J. 1996, AJ, 111, 2280
- Sollerman et al. (2000) Sollerman, J., Kozma, C., Fransson, C., Leibundgut, B., Lundqvist, P., Ryde, F., & Woudt, P. 2000, ApJ, 537, L127
- Sollerman et al. (2002) Sollerman, J., et al. 2002, A&A, 386, 944
- Stanek et al. (2003) Stanek, K. Z., et al. 2003, ApJ, in press (astro-ph/0304173)
- Stathakis et al. (2000) Stathakis, R. A., et al. 2000, MNRAS, 314, 807
- Stetson (1987) Stetson, P. B. 1987, PASP, 99, 191
- Stritzinger et al. (2002) Stritzinger, M., et al. 2002, AJ, 124, 2100
- Sutaria et al. (2003) Sutaria, F. K., Chandra, P., Bhatnagar, S., & Ray, A. 2003, A&A, 397, 1011
- Thomas et al. (2003) Thomas, R. C., Branch, D., Baron, E., Nomoto, K., Li, W., & Filippenko, A. V. 2003, ApJ, submitted (astro-ph/0302260)
- Tsvetkov (1986) Tsvetkov, D. Y. 1986, SvAL, 12, 328
- Wang et al. (2003) Wang, L., Baade, D., Höflich, P., Wheeler, J. C., Fransson, C., & Lundqvist, P. 2003, ApJ, submitted (astro-ph/0206386)
- Yoshii et al. (2003) Yoshii, Y., et al. 2003, ApJ, accepted (astro-ph/0304010)