The nuclear SED of NGC 6251: a BL Lac in the center of an FR I radio galaxy††thanks: Based on observations obtained at the Space Telescope Science Institute, which is operated by the Association of Universities for Research in Astronomy, Incorporated, under NASA contract NAS 5-26555.
Abstract
We determine the nuclear spectral energy distribution (SED) from the radio to the gamma–ray band for the FR I radio galaxy NGC 6251, by using both data from the literature and analyzing HST and X-ray archival data. In the representation, the SED has two broad peaks, and it is remarkably similar to those of blazars. We show that the low-energy peak can be explained in terms of synchrotron radiation, while the high energy peak is most plausibly produced by inverse Compton scattering. This brings direct support to the FR I–BL Lacs unification model. We model the overall emission in the frame of a synchrotron self-Compton scenario, which well describes the SED of BL Lacs. The model parameters we obtain confirm also quantitatively the FR I–BL Lac unification model and imply a rather small viewing angle to this source (). NGC 6251 is the second radio galaxy, in addition to Centaurus A, for which a similar analysis has been performed. A significant improvement with respect to the case of Cen A is the absence of obscuration in NGC 6251, which strengthens the overall result.
1 Introduction
The basic scheme for unification of low-luminosity radio-loud active galactic nuclei (AGN) assume that radio galaxies of the Fanaroff-Riley class I (FR I, Fanaroff & Riley 1974) and BL Lac objects differ only because of a different viewing angle to the relativistic jet (Urry & Padovani 1995 for a review). In BL Lacs, the jet is seen at small angles to the line-of-sight, and the non-thermal emission produced at its very innermost base, on the scale of cm, dominates the observed radiation. In FR I radio galaxies the jet points at larger angles, and the “BL Lac” component should be beamed away from the observer.
Clearly, the most direct implication of the unified models is that the extended properties (e.g. radio and optical emission, environment) of the beamed sources and their putative parent population should appear the same. Therefore, in the absence of any direct detection of the nuclear emission in FR I, the usual way these models are tested involves the comparison of such extended components (e.g Urry et al. 2000, Antonucci & Ulvestad 1985, Kollgaard et al. 1996).
However, faint unresolved optical nuclei have been discovered in FR I radio galaxies through HST observations of a complete sample of 3CR sources (Chiaberge et al., 1999). The presence of a strong correlation between these optical nuclei and the radio cores argues for a common non-thermal synchrotron origin of both components. Therefore, this discovery provides qualitative support for the low-luminosity radio loud AGN unification models.
A more quantitative analysis showed that cores of radio galaxies are overluminous with respect to what is expected from mis-oriented BL Lac jets, for typical values of the bulk Lorentz factor (Chiaberge et al., 2000). It is therefore plausible that the optical cores of radio galaxies and the radiation observed in BL Lacs are not produced in the same region of the relativistic jets: in BL Lacs, a “fast jet spine” with Lorentz factors of dominates, while in FR I we might be observing emission from a slower (but still relativistic) shear layer.
Modeling of the overall nuclear SED could provide an even more stringent test for the unified scheme, as it represents a fundamental tool for obtaining information on the physical conditions of the emitting region, as it is usually done for blazars (e.g. Ghisellini et al. 1998). Unfortunately, the nuclear SED of radio-galaxies are in general not sufficiently well sampled to follow directly this approach and radio galaxies are generally not detected in the gamma-ray band.
The first radio galaxy (and, to the best of our knowledge, the only case to date) for which a detailed modeling of the overall nuclear SED, from the radio to the gamma ray-band, has been undertaken is Centaurus A, the closest radio galaxy (Chiaberge et al., 2001). The result of such work is that, when considered in the comoving frame of the source, the nuclear SED of Cen A can be reproduced adopting the same emission model and physical parameters typical of BL Lacs of the same total power, strongly supporting the unification scheme.
In this paper we focus on NGC 6251, which is a well studied FR I radio galaxy with a well collimated one–sided radio jet and a large scale emission. Its total radio power is erg s-1 (Waggett et al. 1977), i.e. close to the FR I/FR II transition. However, its radio morphology is well representative of the FR I class. The projected linear size of the extended radio structure is 1.7 Mpc (for Km s-1 Mpc-1), which makes NGC 6251 one of the largest known radio galaxies Perley, Bridle, & Willis (1984). The radio source is associated with a giant elliptical galaxy, which hosts a black hole Ferrarese & Ford (1999).
By taking advantage of the recent discovery that the EGRET gamma-ray source J1621+8203 is associated with NGC 6251 (Mukherjee et al., 2002), we perform a detailed analysis of its overall SED as we did for Centaurus A. Our result is that the nucleus of this low-power radio galaxy can also be interpreted as a misoriented BL Lac.
The paper is organized as follows: in Sect. 2 we describe the HST, BeppoSAX and Chandra data and the analysis procedures. In Sect. 3 we determine the SED; in Sect. 4 we discuss the nature of the IR-to-UV nuclear source, which is crucial in order to model the overall SED. In Sect. 5 we model the SED in the frame of a synchrotron self-Compton scenario, and we discuss the resulting model parameters, while in Sect. 6 we draw conclusions.
A redshift of for NGC 6251 (NED) is adopted throughout this paper.
2 Optical and X-ray data
In order to determine the SED, we first focus on the analysis of the IR-to-UV band and X-ray band observations. These spectral regions are crucial in order to model the observed radiation, since the data allow us to set the position of the emission peaks, i.e. the frequencies at which most of the energy is released by the source, and thus constrain the model.
2.1 HST data
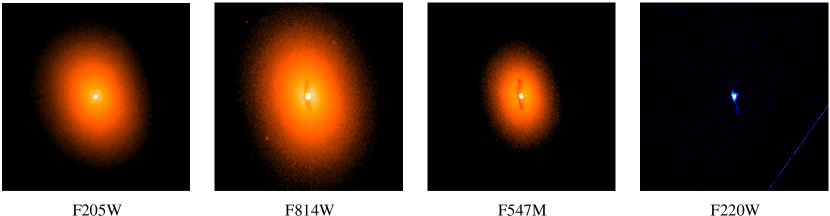
We have measured the flux of the central compact source in archival HST images, from the IR to the UV. In Table 1 we report the details of the observations, and in Fig. 1 we show a picture gallery of the nuclear regions of NGC 6251 as they appear in the images. The F205W and F555W filters might have contribution from emission lines which is however expected to be small (a few %), due to their small equivalent width compared with the width of the filters passband. The other filters are centered in spectral regions relatively free of strong emission lines. Therefore (with the possible exception of F205W and F555W) the flux we measure is continuum emission.
The procedure is as follows. We perform aperture photometry, evaluating the total counts in a circular region centered on the point source, with different radii for the different filters. This is important in order to have a reliable determination of the total flux for the point source allowing for slightly different shapes of the point spread function. For the FOC UV data both the determination of the background and the choice of the aperture radius is straightforward, since the nucleus is by far the dominant component in the image. For the WFPC2 images, due to the presence of the host galaxy stellar component and an extended dusty disk which surrounds the unresolved nucleus, the largest source of error is the determination of the background. Thus we have adopted the rather well tested procedure of measuring the flux in a radius of 5 pixels (corresponding to arcsec), measuring the background in the surrounding annulus (1 pixel width). This is essentially the same procedure as we used for the analysis of the complete samples of 3CR radio galaxies (Chiaberge et al., 1999; Chiaberge, et al., 2002a).
Due to the different shape of the PSF in the different filters, the lower resolution at IR wavelengths and the larger pixel size of the detector, the NICMOS data have to be corrected for PSF loss. We have produced synthetic PSFs with the TINYTIM software (Krist, 1995) for the different instrument configurations. We compared the observed shape of the nuclear PSF in NGC 6251 with the respective synthetic PSF and we selected an appropriate aperture radius for the photometry ( pixels, pixels, pixels for the F205W, F160W and F110W filters, respectively). This procedure ensures that we measure the background as close as possible to the nucleus without suffering contamination from the nucleus itself. However, we have determined that in this case the aperture photometry radius includes only a fraction of the total counts. Therefore, in order to estimate the total flux of the point source, we have derived the renormalization factors from the analysis of the synthetic PSFs (, , for the F205W, F160W and F110W filters, respectively) and we have corrected the measured flux accordingly.
The effective frequencies of the observations have been calculated using SYNPHOT, by taking into consideration the observed slope of the continuum emission. The count rates have been multiplied by the value of the header parameter PHOTFLAM, which represents the inverse sensitivity on the filters in the case of a flat continuum (, , which corresponds to , ). We have tested that the observed slope does not affect the values of PHOTFLAM significantly (less than ). The fluxes measured in the HST observations are reported in Table 2. We estimate that the typical error on the nuclear flux measurements is . The IR-to-UV slope is , calculated between 16000 Å and 2200 Å.
| Instrument | camera/config | Filter | HST Prop. ID | Obs. Date |
|---|---|---|---|---|
| NICMOS | NIC2 | F205W | GO7862 | 1998 Jul 06 |
| NICMOS | NIC2 | F160W | GO7862 | 1998 Jul 06 |
| NICMOS | NIC2 | F110W | GO7862 | 1998 Jul 06 |
| WFPC2 | PC | F814W | GO6276 | 1995 Jun 28 |
| WFPC2 | PC | F555W | GO6276 | 1995 Jun 28 |
| WFPC2 | PC | F547M | GO6653 | 1996 Sep 13 |
| FOC | f/96 | F342W | GO6246 | 1996 Feb 19 |
| FOC | f/96 | F220W | GO6891 | 1997 Jul 07 |
| Filter | Eff. Wav. | Flux |
|---|---|---|
| Å | erg cm-2 s-1 Å-1 | |
| F205W | 21063 | |
| F160W | 16250 | |
| F110W | 11777 | |
| F814W | 8124 | |
| F555W | 5558 | |
| F547M | 5501 | |
| F342W | 3435 | |
| F220W | 2414 |
2.2 X-ray observations and results
We have analyzed unpublished recent BeppoSAX and Chandra X-ray data. These observations are available in the respective public archives. We focus in particular on the BeppoSAX observations, since NGC 6251 is known to be a bright X-ray source (2-10 keV flux of ; Sambruna, et al. 1999) and therefore the Chandra data are significantly affected by pileup. However, it is extremely useful to compare the two observations. Given its arcsec spatial resolution, which is times sharper than that of BeppoSAX, Chandra is indeed the ideal experiment to pinpoint the nuclear emission. In Sect. 2.2.2 we show that the two observations have consistent results, once that the pileup effects in Chandra data are taken into account.
2.2.1 BeppoSAX data
NGC 6251 was observed in July 2001 by the LECS, MECS and PDS instruments on board BeppoSAX (with exposure times of 30.2, 80.9 and 36.2 ksec, respectively), as part of an AO5 GO observation (code 51322001, P.I. M. Guainazzi). The LECS and MECS proportional counters are operating in the 0.1-10 keV and 1-10 keV bands, respectively, while the PDS instrument is a scintillation detector operating in the high energy band 15-300 keV. In our spectral analysis we consider only the range of energies in which the instruments are best calibrated (i.e. 0.12-4 keV for the LECS, 1.6-10 keV for the MECS and 15-220 keV for the PDS).
We perform data analysis by using standard procedures. We extract the source spectrum from an aperture of 8 and 4 arcmin radius in the LECS and MECS images, respectively, and we evaluate the background from blank sky fields. The PDS data reduction is as performed by the archive pipeline. We perform the spectral analysis of MECS and LECS data by using XSPEC v11.0 on rebinned spectra with at least 20 counts per bin to use the -statistics in the fitting process. Errors are given at the 90% confidence level for one interesting parameter. The cross-calibration constant between LECS and MECS, obtained by fitting simultaneously the LECS and MECS data in the common band 1.6-4.0 keV, is found to be 0.67. The cross-calibration constant between the MECS and the PDS, constrained to be in the fiducial range111see the BeppoSAX handbook (Fiore, Guainazzi & Grandi, 1999, Cookbook for BeppoSAX NFI Spectral Analysis) http://www.asdc.asi.it/bepposax/software/index.html 0.77-0.93, is found to be 0.88. Given the PDS large field of view (78 arcmin HWZI) and lack of spatial resolution, other sources of high energy photons might in principle contaminate the PDS data. We search for X-ray sources in the MECS image (25 arcmin radius FOV) and, at larger offsets, in the ROSAT source catalogs222http://www.xray.mpe.mpg.de/cgi-bin/rosat/src-browser. Based on the fluxes and spectra of the X-ray sources within the PDS FOV, we estimate that more than of the PDS photons are produced by NGC 6251.
The 0.1–200 keV spectrum is well described () by a power law with a photon index mildly absorbed by a column density cm-2 in excess of the Galactic value ( cm-2; Dickey & Lockman 1990). Similar results have also been found by Guainazzi et al. (2003). Since the nuclear source is embedded in a diffuse gas halo (e.g. Birkinshaw & Worrall 1993), we add in the spectral fit a thermal component using the mekal model of XSPEC. In this case, we obtain a comparably good fit (), although the estimate of the nuclear absorption rises to cm-2, while the power-law spectral index remains unchanged (). The thermal component is found to have a temperature keV, with a metal abundance . The latter estimate of the nuclear absorption, the power–law spectral index, as well as the halo temperature and metal abundance, are in good agreement with the 1994 ASCA observation (Sambruna et al., 1999)333Sambruna et al. (1999) obtained: cm-2, , keV, , while a somewhat steeper powerlaw and lower absorption have been found by Turner et al. (1997) in the same ASCA dataset. However, we point out that the 2-10 keV BeppoSAX flux () is significantly higher than the flux measured in the ASCA observation (), suggesting that the source flux is variable in the X-rays.
2.2.2 Chandra data
NGC 6251 was observed by Chandra (37.4 ksec with ACIS-I) in September 2000, as part of an AO1 GO project (Obs. ID 847, P.I. Kerp). The source is 3 arcmin away from the telescope aimpoint and falls in the gap among the 4 ACIS-I CCDs, where the exposure map is low. This reduces the number of detected photons, but does not mitigate the pileup effects. Based on the BeppoSAX spectrum and flux, we estimated that in the Chandra observation (with a frametime of 3.24 sec) the pileup fraction is above 60% (the pileup fraction decreases to if the ASCA flux is used). We used CIAO v2.2 to perform a standard data reduction and XSPEC v11.0 for the spectral analysis. As expected, due to the high pileup fraction, the ACIS-I spectrum of NGC 6251 is much harder than that observed by BeppoSAX, having a photon index . By using the MARX 4.0 simulator444Wise M.W. Davis, J.E., Huenemoerder D.P., Houck J.C., Dewey, D., 2003, MARX 4.0 Technical Manual: http://space.mit.edu/CXC/MARX we verified that both the spectral slope and the flux are in excellent agreement with the Chandra observation, under the assumption that the input spectrum is that observed by BeppoSAX. We point out that it is appropriate to compare such observations, since the BeppoSAX spectrum was obtained much closer in time to the Chandra data than the ASCA observation.
3 The nuclear Spectral Energy Distribution of NGC 6251
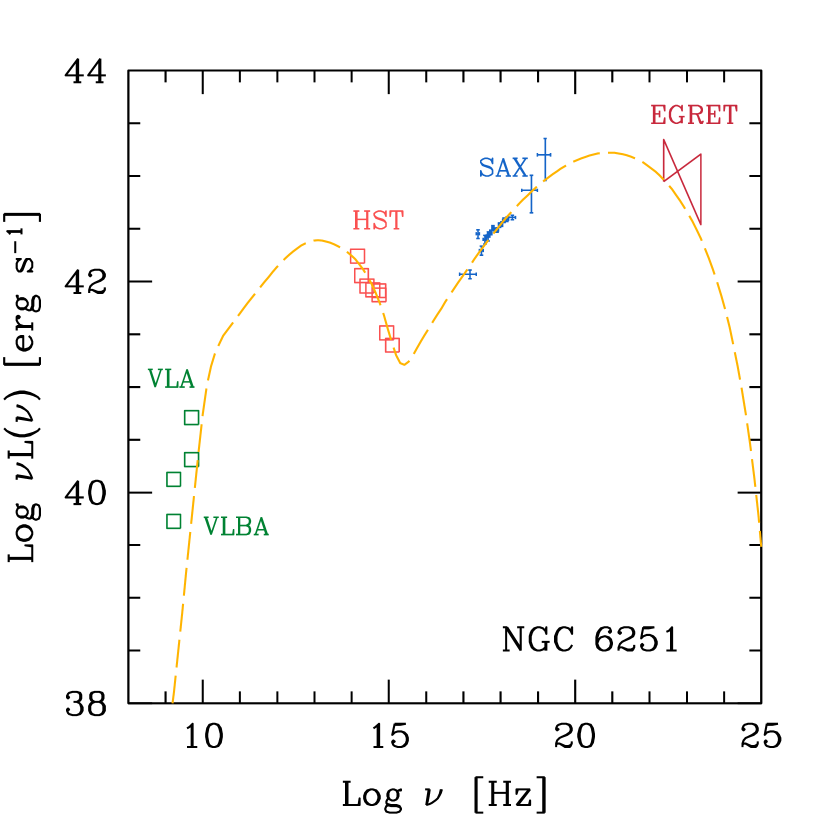
In Fig. 2 we show the overall nuclear SED of NGC 6251. The radio data are taken from Jones et al. (1986). The VLBA fluxes of the unresolved radio core are a factor of 2.5 lower than the VLA both at 6cm and 18cm. The IR-through-UV HST data and the BeppoSAX X–ray observations and data analysis have been discussed in Sect.2.1 and Section 2.2, respectively. The EGRET spectrum is the fit to the spectrum of the source, as taken from Mukherjee et al. (2002). The SED in a representation has two broad peaks and, although the peak frequencies are not well constrained, they are clearly located in the far IR-mm region and between the X-rays and gamma-rays.
As in the case of Centaurus A (Chiaberge et al., 2001), the SED appears remarkably similar to the typical “blazar–like” SED. In such objects, the low and high energy peaks are believed to be produced by non-thermal synchrotron and inverse-Compton radiation, respectively. In the following we discuss in detail the origin of the optical emission and we show that the SSC emission model can also account for the nuclear radiation of NGC 6251.
4 The nature of the active nucleus in NGC 6251 and the origin of the optical nuclear emission
There is growing evidence that the nuclei of FR I radio galaxies are basically unobscured, and the compact nuclei observed in the majority of FR I are non-thermal radiation produced at the base of the relativistic jet. The main evidence for this is the presence of a strong linear correlation between FR I’s optical and the radio nuclear radiation, the latter being definitely of non-thermal origin (Chiaberge et al., 1999; Verdoes Kleijn et al., 2002; Capetti et al., 2002). Although the general behavior of the FR I class as a whole seems to be understood, for “single sources” a certain ambiguity on the nature of the optical nuclei might still be present. Since the IR through UV radiation is crucial for constraining the frequency of the synchrotron peak, it is very important to assess its nature. On the other hand, for the hard X–ray and gamma ray emission the interpretation as inverse-Compton emission appears to be the only viable possibility.
The origin of the bright optical core of NGC 6251 has been discussed by Ferrarese & Ford (1999). There are two scenarios proposed by these authors: a non–thermal process (most plausibly synchrotron emission), or thermal radiation from an optically thick accretion disk.
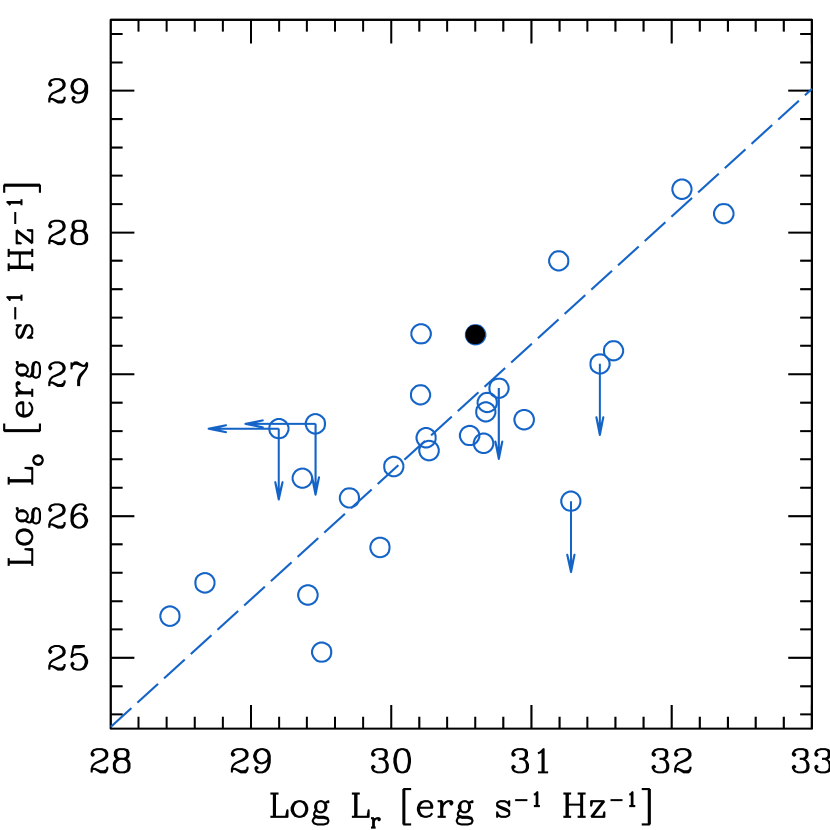
Let us consider the position of NGC 6251 in diagnostic diagrams for the nuclei of radio galaxies. In Fig. 3 we plot NGC 6251 in the plane formed by the luminosity of the optical nucleus of versus the radio core. The open circles are the nuclei of FR I radio galaxies from the 3CR catalog, as taken from Chiaberge et al. (1999). The dashed line is the regression line between the two quantities. The black point, representative of NGC 6251, lies just above the correlation. This is a strong clue that NGC 6251 behaves exactly as other FR I. We stress that the comparison with the 3CR sample is extremely appropriate, since Laing et al. (1983), have included NGC 6251 in their complete revised 3CR sample (the 3CRR).
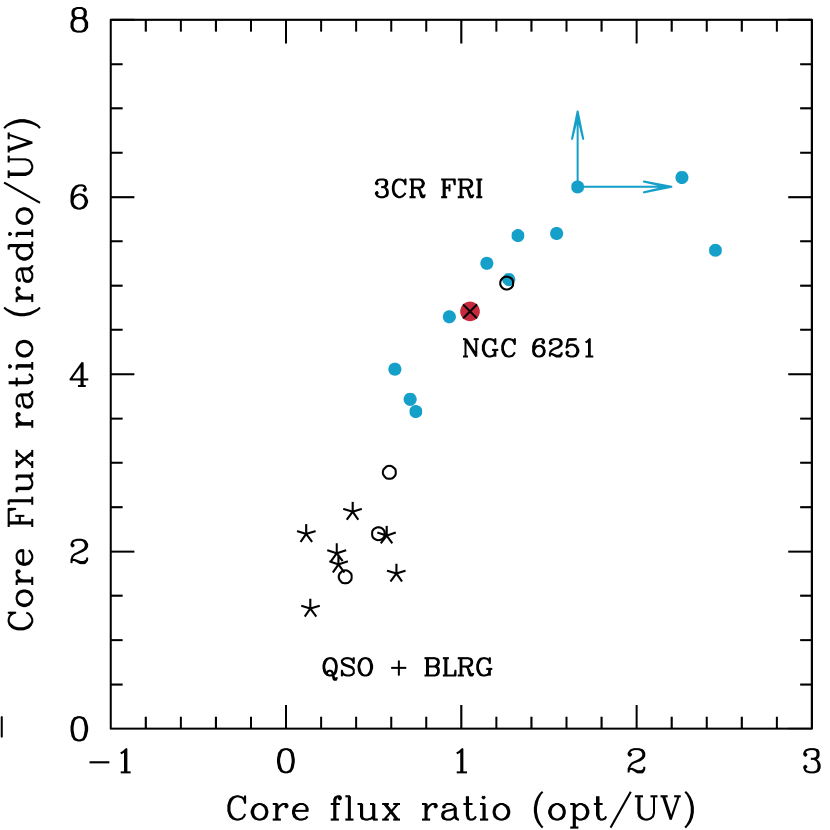
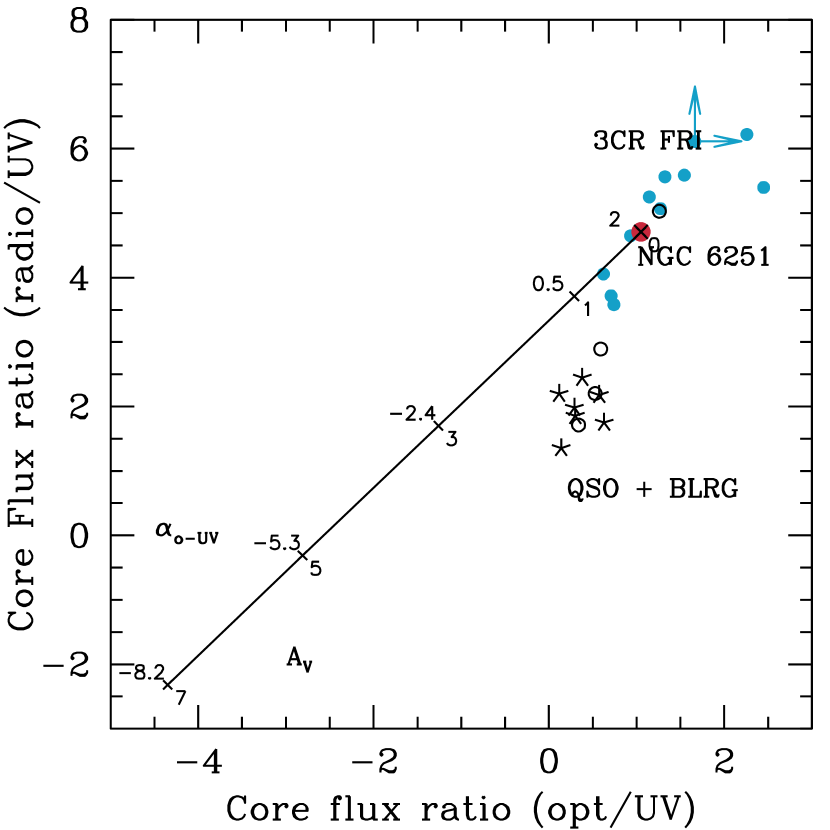
In Fig. 4a we show the position of the nucleus of NGC 6251 in the plane formed by the radio-to-UV vs. the optical-to-UV flux ratios. As discussed in Chiaberge et al. (2002b), the position of the objects in this plane is sensitive both to absorption and to the different intrinsic spectral properties of the nuclei. Steep spectrum radio quasars (plotted as stars) and broad lined radio galaxies (empty circles) occupy the same region of the plane, and clearly differentiate from FR I mainly because of the presence of the thermal blue bump in the optical-to-UV spectral range. NGC 6251 again lies in the region of FR I.
However, as already pointed out above, for “single objects” we cannot exclude on the basis of the radio-optical properties that the optical emission could be scattered light produced by an accretion disk obscured to our line-of-sight. In this case, we know from Chiaberge, et al. (2002a) that its representative point would lie on the radio-optical correlation of Fig. 3 by chance. This has been indeed found to be rather common among FR II in which strong narrow emission lines are observed.
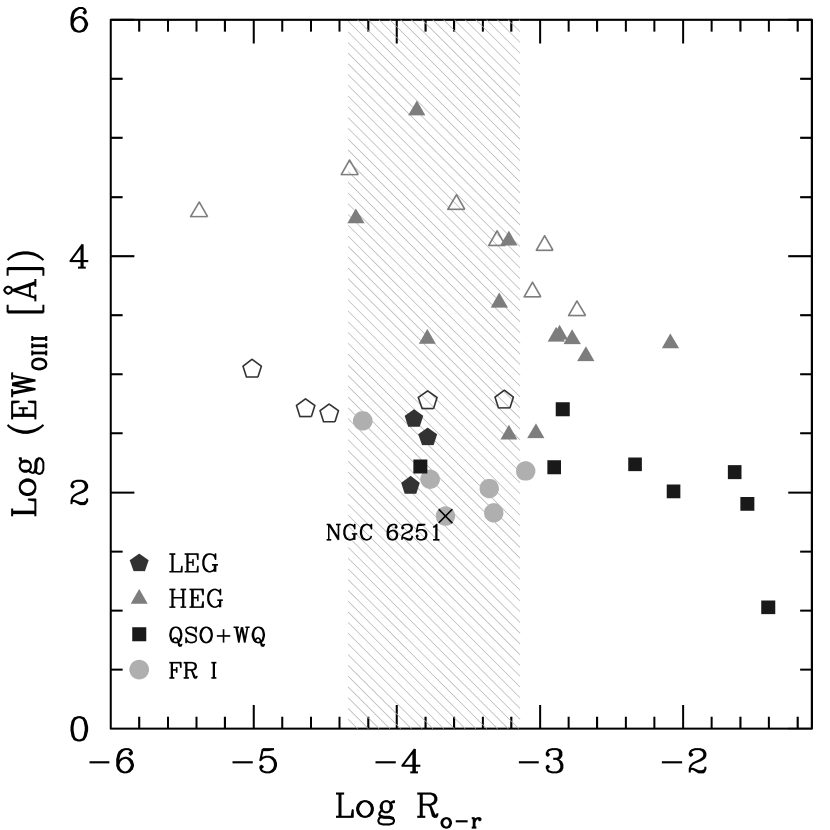
In order to remove the degeneracy in the interpretation of the optical emission, we use the [OIII]5007 emission line, which is indeed a good indicator of the intrinsic ionizing radiation field. From ground based observations ( aperture, centered on the galaxy nucleus) the luminosity of the [OIII]5007 line is erg s-1 (Shuder & Osterbrock, 1981). A useful diagnostic is the ratio between the flux of the emission line and the observed nuclear continuum emission (i.e. the “nuclear” equivalent width). This has been used to discriminate between objects in which the nuclear source is seen directly and objects in which the ionizing radiation field is obscured to our line-of-sight and observed only through scattered radiation (Chiaberge, et al., 2002a). In the latter case, high values of the equivalent width are expected, since only a few percent of the intrinsic nuclear source is observed. In Fig. 4b we show the position of the source in the plane formed by the [OIII] EW plotted against the ratio of the optical nuclear flux to radio core flux . The shaded area corresponds to the dispersion () of the correlation between these two quantities for FR I galaxies. The equivalent width of the [OIII]5007 emission line for NGC 6251 is typical of the other unobscured FR I nuclei. As already known from Fig 3, the value of is also in the same region as the other FR I.
In the light of the above analysis, we conclude that the dominant physical origin for the optical nucleus is non–thermal synchrotron emission produced at the base of the jet. Any other thermal contribution to the observed flux should then be considered lower than (or equal to) the observed synchrotron radiation.
4.1 What is the role of absorption in NGC 6251?
Before modeling the nuclear emission, we must briefly consider the possible presence of absorption on the line-of-sight to the nucleus, since one of the two models for the X-ray emission includes a certain amount of in excess of the Galactic value. Absorption would indeed naturally steepen the IR-to-UV slope of the continuum emission, and could in principle “artificially” produce a two-peak SED. This is an issue for objects like Cen A, because of the presence of the extended dust lane which certainly absorbs the nuclear radiation (Marconi et al., 2000). However, in NGC 6251 there is no apparent reason for absorption in the optical. Firstly, the dusty disk does not appear to hide the nucleus. Although the extinction from the disk is only mag (in the external regions), this would significantly affect the UV emission (, Cardelli et al. 1989). If the disk were to cover the nucleus we would expect to see a progressive steepening of the spectral slope as frequency increases, which is not observed. Furthermore, the typical optical-to-UV spectral slope of FR I from the 3CR catalog lies somewhere between (Chiaberge et al., 2002b), while only those objects in which absorption features are apparent have steeper slopes. The value of that we derive for NGC 6251 appears to be consistent with other unobscured FR Is.
In Fig. 5 we show the effects of a small amount of optical extinction on the broad–band spectral properties of NGC 6251 when compared with other radio galaxies. We have overplotted the de-reddening line for NGC 6251 on the plane of Fig. 4a, assuming a range of from 0 to 7. This confirms that only an mag is allowed. For higher values of extinction, the broad band spectral properties of NGC 6251 would be incompatible with any of the other sources in the same range of redshift and total power. In particular, it appears that it is not possible to “drag” the source into the region occupied by quasars if we only consider the effects of obscuration. Note that since the typical error for each single flux measurement is , the resulting error on the data plotted here is of the order of the size of the symbols. Therefore, we exclude that the nuclear emission is thermal radiation from an accretion disk seen directly.
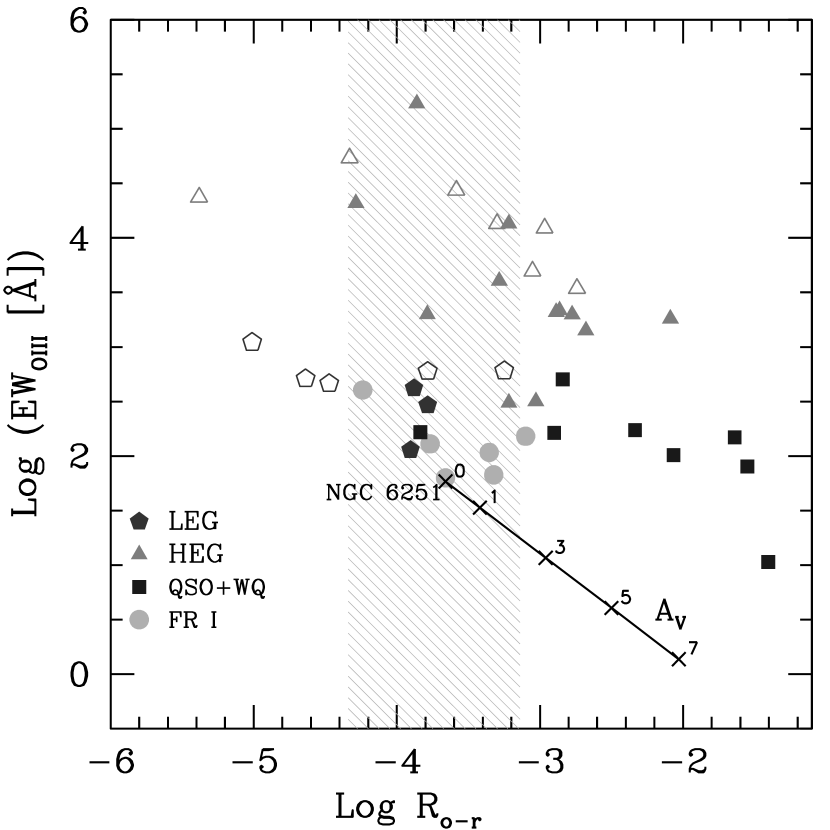
Similarly to Fig. 5 we have overplotted the de-reddening curve on the EW([OIII]) vs. diagnostic plane (Fig. 6). An mag would again move the point representative of NGC 6251 in a region of the plane where no sources are found.
The fact that the X-ray data can be modeled with absorption in excess of the galactic value, while in the optical there is no evidence for significant extinction is not surprising. In fact, the standard conversion between and , adopting local Galactic dust to gas ratio (which in our case would imply mag) generally does not hold in AGNs. Maiolino et al. (2001) have found that in AGNs is always lower than the Galactic value by a factor of 3 to 100. Several different explanations for such a discrepancy have been proposed by various authors, e.g. non–standard values for the dust-to-gas ratio in the “absorbing” structures, a different location for the optical and X-ray sources and/or for the absorbing structures, or the presence of large dust grains which would flatten the extinction curve and significantly lower the ratio (Maiolino, Marconi, & Oliva, 2001).
As noted above, from the analysis of the X-ray data we cannot discriminate between the two models that fit the data. However, for our purpose, the most important parameter we derive from the X-ray data is the slope of the (non-thermal) power–law component, which remains unchanged in either models.
In the following we discuss the nature of the optical emission through various diagnostics. Then we proceed to model the overall SED in the synchrotron self-Compton scenario, with the same method as usually done for blazars.
5 SSC modeling of the SED
| Model parameters | |
|---|---|
| cm | G |
| erg s-1 | |
We model the SED of NGC 6251 in the frame of a homogeneous synchrotron self-Compton scenario (SSC), which is successfully used to account for the overall emission of blazars (e.g. Ghisellini et al. 1998). Details of the model are given in Chiaberge & Ghisellini (1999) and a short summary is reported for clarity in Appendix A. The model is particularly appropriate for low-power objects (BL Lacs), in which the external radiation field is probably low, and the dominant source of seed photons for inverse-Compton scattering is the synchrotron radiation field itself. Since the total radio power of NGC 6251, ( erg s-1, Waggett et al. 1977) is in the range spanned by BL Lacs, and close to its median value (see e.g. Perlman et al. 1996, Kollgaard et al. 1996, Cassaro et al. 1999), the use of the SSC model appears to be appropriate.
In Table 3 we show the parameters of the model which best reproduce the SED. All of them are typical of BL Lacs, except for the value of , the relativistic beaming factor555 is defined as , where is the bulk Lorentz factor of the jet and is the viewing angle.. In order to perform a more detailed analysis, we compare our model parameters with the large BL Lac sample modeled by Ghisellini et al. (1998). We use for comparison the compactness parameter , which represents the ratio of the injected power to the size of the source. For NGC 6251 we obtain , which lies at the higher end of the distribution of for BL Lacs. Both the magnetic field and the size of the source are well inside the range spanned by BL Lacs (G and cm).
As already noted above, is lower than in BL Lacs, where and the median value is 16. In the analysis of the SED of Centaurus A, we obtained an even lower value, (Chiaberge et al., 2001). In that case, we showed that this could be explained by the presence of a low velocity component in the jet, e.g. a shear layer, which could be the origin of the observed nuclear radiation. This has been interpreted as a further evidence that relativistic jets have at least two velocity components: a fast “spine”, with plasma Lorentz factors which dominates the BL Lac emission, and a slower, mildly relativistic layer, which accounts for the emission of the nuclei of FR I radio galaxies. Considering all possible intrinsic jet velocities, the maximum viewing angle for is obtained for . In NGC 6251, is still compatible with “typical” BL Lac Lorentz factors but, in this case, the viewing angle to the jet axis would be even smaller (for and the viewing angle is ).
The value for the angle of the line-of-sight to the jet axis we derive is rather small, but still compatible with the constraint obtained from VLBI observations of the jet-counterjet ratio (Jones & Wehrle, 2002). In absence of a firm determination of the viewing angle to the radio jet axis, we cannot distinguish between the two scenarios proposed above for the location of the emitting region, i.e. the fast “BL Lac” component or a slower (but still relativistic) region of the jet.
Our estimate of is substantially lower than both the orientation of the external dusty disk () and the inner gas disk (), as modeled by Ferrarese & Ford (1999). These authors showed that the structure is warped and tilted , and the axis of the inner disk is significantly twisted with respect to the outer dusty disk. Therefore, our upper limit on the jet direction confirms and extends their picture. The jet axis is not perpendicular to any of the observed disks: the warping of the accretion structure around the central black holes would continue towards the innermost regions, where the inner accretion disk and the jet are likely to be perpendicular.
The small viewing angle we find would imply a deprojected total size of the source Mpc, which would make NGC 6251 by far the largest known radiogalaxy. However, we point out that the morphology of its jets, on the largest scales, is complex and presents significant bending. Therefore, our determination of , which refers to the inner jet, is probably not appropriate to estimate the overall deprojected size of this radio source.
6 Conclusions
We have determined the overall spectral energy distribution of the nucleus of NGC 6251, from the radio to the gamma ray band, by collecting data from the literature and analyzing HST and X-ray data taken with BeppoSAX and Chandra. A significant improvement with respect to previous work is the homogeneous analysis of HST data, which span the range of wavelengths from the IR (m) to the UV ( Å) and allows us to define a broad peak in the SED at low energies, and the analysis of previously unpublished X-ray data. The X-ray data, together with the gamma-ray EGRET detection recently published by Mukherjee et al. (2002), define a further peak at high energies. The SED is therefore similar to that of BL Lac objects, in agreement with the AGN unification model.
Before proceeding to model the SED, a key point to be addressed is the nature of the optical source. We have shown that in diagnostic planes for the nuclear emission of radio galaxies, NGC 6251 follows the general behavior of FR I. Therefore, as for the large majority of 3CR FR I radiogalaxies, the unresolved nucleus seen in HST images at all wavelengths can be interpreted as synchrotron emission. At high energies, the BeppoSAX hard () power-law spectrum and the gamma ray radiation are most plausibly produced by the inverse-Compton process.
In light of the above results, we have modeled the SED in the framework of a synchrotron self-Compton scenario, which well accounts for the emission of blazars in general, and especially of BL Lac objects. The parameters of the model are very similar to those found in BL Lacs, except for the beaming factor, as qualitatively expected by the unification models. More quantitatively, implies that the viewing angle to the jet axis cannot be wider than , in agreement with the radio information which claims for a small viewing angle.
In summary, our analysis of the overall SED of NGC 6251 directly supports the FR I–BL Lac unification scheme and strengthens the results we have obtained for the closest FR I, Centaurus A. However, it is still possible that the radiation which dominates BL Lacs emission is not produced co-spatially with the nuclear radiation observed in radio-galaxies. Because of the larger viewing angle to these latter sources, it is plausible that the “blazar” component is beamed away from the observer’s line of sight, and the observed radiation is produced in a slower region of the jet, possibly a shear layer, as proposed for other sources (Chiaberge et al., 2000, 2001).
Appendix A SSC model
The model is described in detail in Chiaberge & Ghisellini (1999) and Chiaberge et al. (2001), in which it has been applied for the first time to reproduce the nuclear SED of a radio galaxy, Centaurus A. Here we summarize the main assumptions of the model.
The source is a spherical homogeneous region, embedded in a tangled magnetic field. Relativistic electrons are continuously injected at a rate [cm-3 s-1] between and ( being the Lorentz factor), and they loose their energy radiatively.
The parameters of the model are: the size of the source , the magnetic field , the injected luminosity , the relativistic beaming factor (where is the angle between the jet axis and the line of sight), , and the slope . The resulting electron distribution at equilibrium is a broken power-law. Electrons are also allowed to escape the emitting region (thus reducing the particle density, mimicking source expansion) in a timescale .
We obtain the equilibrium solution of the continuity equation which governs the temporal evolution of the emitting electron distribution .
where is the total (synchrotron + self–Compton) cooling rate. We solve the equation numerically (see Chiaberge & Ghisellini 1999) and we calculate self-consistently the produced equilibrium spectrum. We take into account the effects of the Klein-Nishina decline, using an approximated step function (Zdziarski, 1986).
References
- Antonucci & Ulvestad (1985) Antonucci, R. R. J. & Ulvestad, J. S. 1985, ApJ, 294, 158
- Biretta et al. (2002) Biretta, Lubin., et al. 2002, WFPC2 Instrument Handbook, Version 7.0 (Baltimore: STScI)
- Birkinshaw & Worrall (1993) Birkinshaw, M., & Worrall, D.M. 1993, ApJ, 412, 568
- Capetti et al. (2002) Capetti, A., Celotti, A., Chiaberge, M., de Ruiter, H. R., Fanti, R., Morganti, R., & Parma, P. 2002, A&A, 383, 104
- Cardelli, Clayton, & Mathis (1989) Cardelli, J. A., Clayton, G. C., & Mathis, J. S. 1989, ApJ, 345, 245
- Cassaro et al. (1999) Cassaro, P., Stanghellini, C., Bondi, M., Dallacasa, D., della Ceca, R., & Zappalà, R. A. 1999, A&AS, 139, 601
- Chiaberge, et al. (2002a) Chiaberge, M., Capetti, A., & Celotti, A. 2002, A&A, 394, 791
- Chiaberge et al. (2002b) Chiaberge, M., Macchetto, F. D., Sparks, W. B., Capetti, A., Allen, M. G., & Martel, A. R. 2002, ApJ, 571, 247
- Chiaberge et al. (2001) Chiaberge, M., Capetti, A., & Celotti, A. 2001, MNRAS, 324, L33
- Chiaberge et al. (2000) Chiaberge, M., Celotti, A., Capetti, A., & Ghisellini, G. 2000, A&A, 358, 104
- Chiaberge et al. (1999) Chiaberge, M., Capetti, A., & Celotti, A. 1999, A&A, 349, 77
- Chiaberge & Ghisellini (1999) Chiaberge, M. & Ghisellini, G. 1999, MNRAS, 306, 551
- Dickey & Lockman (1990) Dickey, J. M. & Lockman, F. J. 1990, ARA&A, 28, 215
- Elvis et al. (1994) Elvis, M. et al. 1994, ApJS, 95, 1
- Fanaroff & Riley (1974) Fanaroff, B. L. & Riley, J. M. 1974, MNRAS, 167, 31P.
- Ferrarese & Ford (1999) Ferrarese, L. & Ford, H. C. 1999, ApJ, 515, 583
- Ghisellini et al. (1998) Ghisellini, G., Celotti, A., Fossati, G., Maraschi, L., & Comastri, A. 1998, MNRAS, 301, 451
- Guainazzi et al. (2003) Guainazzi, M., Grandi, P., Comastri, A., Matt, G., A&A in press
- Jones & Wehrle (2002) Jones, D. L. & Wehrle, A. E. 2002, ApJ, 580, 114
- Jones et al. (1986) Jones, D. L. et al. 1986, ApJ, 305, 684
- Kollgaard, Palma, Laurent-Muehleisen, & Feigelson (1996) Kollgaard, R. I., Palma, C., Laurent-Muehleisen, S. A., & Feigelson, E. D. 1996, ApJ, 465, 115
- Krist (1995) Krist, J. 1995, ASP Conf. Ser. 77: Astronomical Data Analysis Software and Systems IV, 4, 349
- Laing et al. (1983) Laing, R. A., Riley, J. M., & Longair, M. S. 1983, MNRAS, 204, 151
- Maiolino et al. (2001) Maiolino, R., Marconi, A., Salvati, M., Risaliti, G., Severgnini, P., Oliva, E., La Franca, F., & Vanzi, L. 2001, A&A, 365, 28
- Maiolino, Marconi, & Oliva (2001) Maiolino, R., Marconi, A., & Oliva, E. 2001, A&A, 365, 37
- Marconi et al. (2000) Marconi, A., Schreier, E. J., Koekemoer, A., Capetti, A., Axon, D., Macchetto, D., & Caon, N. 2000, ApJ, 528, 276
- Mukherjee et al. (2002) Mukherjee, R., Halpern, J., Mirabal, N., & Gotthelf, E. V. 2002, ApJ, 574, 693
- Perley, Bridle, & Willis (1984) Perley, R. A., Bridle, A. H., & Willis, A. G. 1984, ApJS, 54, 291
- Perlman et al. (1996) Perlman, E. S. et al. 1996, ApJS, 104, 251
- Sambruna et al. (1999) Sambruna, R.M., Eracleous, M., & Mushotzky, R.F. 1999, ApJ, 526, 60
- Shuder & Osterbrock (1981) Shuder, J. M. & Osterbrock, D. E. 1981, ApJ, 250, 55
- Turner et al. (1997) Turner, T.J., George, I.M., Nandra, K., Mushotzky, R.F. 1997, ApJS, 113, 23
- Urry et al. (2000) Urry, C. M., Scarpa, R., O’Dowd, M., Falomo, R., Pesce, J. E., & Treves, A. 2000, ApJ, 532, 816
- Urry & Padovani (1995) Urry, C. M. & Padovani, P. 1995, PASP, 107, 803
- Verdoes Kleijn et al. (2002) Verdoes Kleijn, G. A., Baum, S. A., de Zeeuw, P. T., & O’Dea, C. P. 2002, AJ, 123, 1334.
- Waggett et al. (1977) Waggett, P. C., Warner, P. J., & Baldwin, J. E. 1977, MNRAS, 181, 465
- Zdziarski (1986) Zdziarski, A. A. 1986, ApJ, 305, 45