XMM-Newton observation of the brightest X-ray flare detected so far from Sgr A*
We report the high S/N observation on October 3, 2002 with XMM-Newton of the brightest X-ray flare detected so far from Sgr A* with a duration shorter than one hour ( 2.7 ks). The light curve is almost symmetrical with respect to the peak flare, and no significant difference between the soft and hard X-ray range is detected. The overall flare spectrum is well represented by an absorbed power-law with a soft photon spectral index of =2.50.3, and a peak 2–10 keV luminosity of 3.61035 erg s-1, i.e. a factor 160 higher than the Sgr A* quiescent value. No significant spectral change during the flare is observed. This X-ray flare is very different from other bright flares reported so far: it is much brighter and softer. The present accurate determination of the flare characteristics challenge the current interpretation of the physical processes occuring inside the very close environment of Sgr A* by bringing very strong constraints for the theoretical flare models.
Key Words.:
Galaxy: center – X-rays: individuals: Sgr A* – X-rays: general – Radiation mechanisms: general(dporquet@mpe.mpg.de)
1 Introduction
Measurements of star motions in the central part of our Galaxy
demonstrated the presence of
a high concentration of matter within a very compact
region of 0.01 pc at a distance of 8 kpc. These results prove the existence
of a central supermassive black hole of a mass of about 3106 M⊙
at the dynamical center of our Galaxy (e.g., Schödel et al. Schodel2002 (2002)),
coincident with the compact radio source Sgr A*.
Surprisingly this source is much fainter than expected
from accretion onto a super-massive black hole.
In particular in the 2–10 keV energy band its X-ray luminosity
is only about 2.21033 erg s-1
within a radius of 1.5′′
(Baganoff et al. 2003a , hereafter B03).
This value may in fact be considered as an upper limit since
this region contains other components such as stars
(e.g., Eckart & Genzel EG97 (1997)), hot gas, etc.
Thus, Sgr A* radiates in X-rays at about 11 orders
of magnitude less than its corresponding Eddington luminosity.
Its bolometric luminosity is only
about 310-8 LEdd (Melia & Falcke MF2001 (2001),
Zhao et al. Zhao2003 (2003)).
This has motivated the development of various radiatively inefficient
accretion models to explain the dimness of the Galactic Center black hole,
e.g. Advection-Dominated Accretion Flows
(e.g., Narayan et al. Narayan98 (1998)),
jet-disk models (e.g., Falcke & Markoff Falcke2000 (2000)),
Bondi-Hoyle with inner Keplerian flows (e.g., Melia et al. Melia2000 (2000)).
The recent discovery of X-ray flares from Sgr A* has provided new
exciting perspectives for the understanding of the processes at work in the
galactic nucleus.
The first detection of such events was found with Chandra in October 2000.
The flare has a duration of
about 10 ks, with L(2–10 keV)= 1.00.1 1035 erg s-1
for the flare peak, i.e. about 45 times the quiescent state.
(Baganoff et al. Baganoff2001 (2001), hereafter B01).
The photon flare spectral index, obtained from the simultaneous
fitting of the quiescent phases and the flare phase, was =1.3
(at 90 confidence level).
A second significant flare was detected with XMM-Newton
by Goldwurm et al. (Goldwurm2003 (2003)) who found a monotonic
flux rise up to a factor of about 20–30 in the last 900 s of the observation.
They found also a rather hard spectrum with =0.90.5
(at 68.5 confidence level),
with a maximum observed 2-10 keV luminosity
of about 61034 erg s-1.
Baganoff et al. (2003b ) estimated, with the analysis of
several Chandra observations, that
X-ray flares happen at a rate of 1.20.6 per day.
We report here the detection and the analysis
of the up-to-now brightest X-ray flare from SgrA*, observed
in October 2002 with XMM-Newton.
The present data provide the highest signal to noise measurements
of a Sgr A* X-ray flare, reported so far.
2 XMM-Newton observation and results
The Galactic Center was observed on October 3, 2002
with Sgr A* at the center of the XMM-Newton/EPIC field of view
(see Turner et al. T2001 (2001) and Strüder et al. S2001 (2001)
for the description of the EPIC cameras MOS and PN, respectively).
The MOS (exposure time 16.8 ks) and PN (13.9 ks)
cameras were both operated
in the prime full window mode, with the medium
and the thick filter selected, respectively.
The data were processed with the
XMM Science Analysis Software (version 5.4.1).
X-ray events with pattern 0–12 and 0–4 are used
for the MOS and PN, respectively.
We find a strong increase of the count rate during about 3 ks.
To identify the counterpart of this X-ray flare,
we improve the astrometry by cross-correlating the 8 PN sources detected
in the 0.5–1.5 keV energy band during the whole observation
with the 2MASS All-Sky Point Source Catalog using the eposcorr SAS task.
We find a reliable 2MASS counterpart for each of these
serendipitous PN sources, from which three are Tycho sources,
by introducing boresight correction and rotational offset of
(-1.2′′,-0.5′′), and 2.7′, respectively.
The refined position of the X-ray flaring source is then
= 17h45m39.98s,
= 29∘00′28.4′′,
with a 90% confidence level error box of 2.3′′.
The radio counterpart of Sgr A* at
=,
=
(Yusef-Zadeh et al. Yusef99 (1999)), is located
only 0.8′′ away
from the flaring source. Since no other X-ray source was found by Chandra
in our error box, we conclude that the X-ray flare is very likely to be associated with Sgr A*.
For the light curves and spectral analysis, we use an extraction region
of 10′′ radius around Sgr A*, where the solar flare
background is negligible with a maximum count rate of
610-3 cts s-1.
2.1 The EPIC light curve
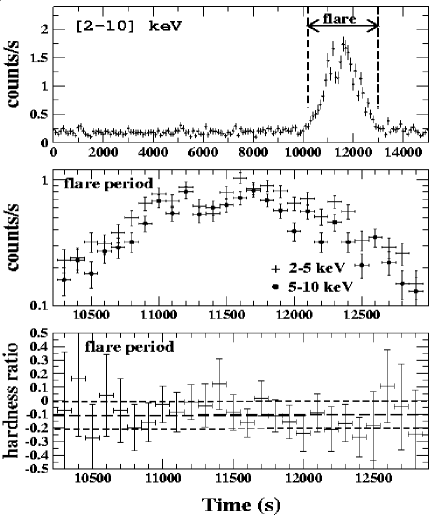
The EPIC light curve in the 2–10 keV energy range shows for the first 10 ks a quiescent period and then a very sharp and intense flare with a duration shorter than one hour (2.7 ks, see Fig. 1 top panel). The flare shape is almost symmetric relative to the peak. Both the rise and decay phases can be fitted by an exponential with characteristic times of 610 s and 770 s, respectively. We also observe a “micro-structure” at about 11,200 s with a significance of at least 3 on a time-scale as short as 200 s, which can further constrain the emitting region to a size of about 7 Schwarzschild radii for the black hole mass of about 3106 M⊙. The 2–10 keV count rate at the flare peak is 1.740.13 cts s-1, i.e. 9.2 times higher than the mean value measured during the quiescent period (0.190.04 cts s-1). B03 using Chandra found that the inner 10′′ radius region around Sgr A* contains six other X-ray point sources as well as a diffuse component, and estimated that the flux from Sgr A* during its quiescent state represents about 10 of the total 2–10 keV flux. Therefore we infer for the present flare a count rate increase of a factor of about 90 between the quiescent state of Sgr A* and the flare peak. The shapes of the light curves in the soft (2–5 keV) and hard (5–10 keV) energy bands are very similar (Fig. 1, middle panel). We report in Fig. 1 (lower panel), the hardness ratio (HR) during the flare period: HR=(hardsoft)/(hardsoft). We removed the quiescent level contribution, assuming that it is constant during the flare: mean count rates of 0.120.03 cts s-1, and of 0.070.03 cts s-1, respectively for the soft and hard energy bands. This corresponds to a HR value for the quiescent period of 0.290.02. We find a flare HR of 0.10.1, indicating a rather soft spectrum. No significant spectral evolution is observed between the [2–5] keV [5–10] keV ranges (a similar result is found for a different energy range, e.g. [2–3.5] keV). We find an indication that the flare presents a higher HR value, compared to the quiescent, in a restricted time period of the rise phase (i.e 11,000 time 11,400 s). However, this does not imply a change in spectrum of the flaring source since the emission within 10′′ during the quiescent period is not dominated by Sgr A*.
2.2 Spectral analysis of the X-ray flare
Fig. 2 shows the extracted spectra for the overall flare period. The overall flare spectra and the rise and decay phase spectra were binned to a minimum of 20 counts and 10 count per bin, respectively. xspec v11.2.0 is used for the spectral analysis. We use the response matrices from the rmfgen and arfgen SAS tasks. The errors and upper limits quoted correspond to 90 confidence level for one interesting parameter. The quiescent spectrum including the contribution of Sgr A* in its quiescent phase and the contribution of the other sources in a radius of 10′′ around Sgr A* is subtracted from the flare spectrum. We fit the data with an absorbed power-law model taking into account the dust scattering effects along the line-of-sight, using the scatter model soon available in xspec (Predehl & Schmitt PS95 (1995)). We fix for the scatter model, a visual extinction value AV of 30 mag, as determined from IR observations of stars close to Sgr A* (e.g., Rieke et al. Rieke89 (1989)). The interstellar medium (ISM) column density is fitted using the model tbabs/xspec (Wilms et al. Wilms2000 (2000)), which includes updated cross-sections for X-ray absorption by the ISM. We also use their revised ISM abundances, which produce changes in ISM cross-sections of up to 30 with respect to solar abundances generally used as reference abundances for the ISM. This means that the absorption column values found here are about 30 higher than the ones obtained assuming solar abundances.
| Model | /kT | Z(b) | F | /d.o.f. | |
|---|---|---|---|---|---|
| pow | 2.00.3 | 2.50.3 | [1.0] | 2.4 | 102.4/123 |
| pow | 1.10.1 | [1.3] | [1.0] | 1.60.2 | 149.0/124 |
| brems | 1.70.2 | 6.1 | [1.0] | 2.0 | 104.3/123 |
| bb | 1.00.2 | 1.47 | [1.0] | 1.30.1 | 113.6/123 |
| mekal | 1.70.2 | 5.7 | 0.17 | 2.0 | 103.8/122 |
| mekal | 1.1 | 27 | [1.0] | 1.60.2 | 147.9/123 |
| mekal | 1.00.1 | 48 | [2.0] | 1.60.2 | 159.7/123 |
The power-law continuum model with a soft photon index gives a good representation of the data (see Fig. 2 and Table 1), and we find at the flare peak a 2–10 keV luminosity of 3.61035 erg s-1, assuming d=8 kpc. Fixing =1.3, as found in B01, we obtain a non satisfactory data fit (Table 1).

The presence of narrow Fe Kα Gaussian emission lines (=10 eV) are not statistically required (1 for one additional parameter). We find at 6.4 keV, 6.6 keV, 6.7 keV, and 7.0 keV upper limits on the equivalent widths of 33 eV, 122 eV, 123 eV, and 65 eV, respectively. Likewise the presence of a broad emission line near 6.7 keV (=250 eV) and an absorption edge at 7.5 keV are not statistically required and we obtain EW173 eV and 0.2, respectively. The data are also well fitted by a bremsstrahlung continuum model with a temperature of about 6.1 keV (Table 1). We also test an optically thin plasma using the mekal model with ISM abundances, letting the metal abundance vary as a free parameter, we find a good fit for a relative metal underabundance of less than 0.17. While fixing the relative metal abundance to be equal or two times higher than the ISM abundances, the data fit is not satisfactory, with very high temperatures and therefore a large over-prediction of a H-like iron line at 7 keV (Table 1). Surprisingly, the spectrum can also be well fitted by a black-body with kT=1.47 keV with no significant change of temperature all over the flare. The apparent size of the emitting area is about 10 km2 at the peak for a distance of 8 kpc. The spectral fits of the rise and decay phases of this flare are statistically consistent with each other with no change of the photon index ( fixed to 21023 cm-2), with =2.40.2 (/d.o.f.=103.0/122), and =2.50.2 (/d.o.f.=131.9/126), respectively. This confirms the lack of significant hardening according to the HR found.
3 Discussion
Several models have been proposed to explain the
first Sgr A* X-ray flare observed with Chandra.
For instance, it could be produced by a sudden
enhancement of accretion through the inner hot
circularized flow predicted by the model of Liu & Melia (Liu2002 (2002)).
When the viscosity increases, synchrotron self-Compton (SSC)
of the millimeter to sub-millimeter photons is the dominant process,
and a soft spectrum is expected.
Such flares would be coupled with a similar increase in the mm
and sub-mm ranges, which have not been yet observed
(e.g., from March 2001 to May 2002, Zhao et al. Zhao2003 (2003)).
If the viscosity decreases then thermal Bremsstrahlung is
the dominant process,
and a hard spectrum would be generated, consistent with the slopes
observed in the two other X-ray (much lower S/N) flares.
Three possible flare mechanisms have been proposed by Markoff et al.
(M2001 (2001)) on the basis of a jet model:
increased jet power or accretion rate, increased heating
of quasi-thermal relativistic particles, or sudden shock acceleration.
The first scenario predicts a steep spectral index,
and a huge radio flare for an accretion rate increase,
and simultaneous flaring at all frequencies for an jet power increase,
but this have never been yet observed.
The second and third scenarii predict harder spectrum and
were compatible with the spectral index of the first Chandra X-ray flare.
The flare luminosity excludes normal stars
as the origin of this event, but compact objects,
although unlikely, cannot be totally excluded
(see discussion in B01).
We rule out the possibility that the symmetrical shape of
the flare light curve
is produced by micro-lensing of a star located behind Sgr A*.
Indeed from Zinnecker (Zinnecker2003 (2003))’s formulae,
we find that hour duration micro-lensing events imply
very high tangential velocities for the lensed star
and unphysical distances from the black hole, less than
one Schwarzschild radius. For instance a velocity as high as
10,000 km s-1 corresponds to a distance of about only 1012 cm.
The duration of the trailing edge of this flare is very short.
If the physical process is thermal,
this could be explained by the very rapid cooling of a plasma
not magnetically confined, as proposed by Merloni & Fabian (Merloni2002 (2002)).
The total column density inferred
from the spectral fit is about 1.7–2.01023 cm-2
for the power-law, bremsstrahlung and mekal models.
The visual extinction A30 mag, inferred from IR observations of
stars very close to Sgr A* (Rieke et al. Rieke89 (1989)),
corresponds to an absorption column density
along the line-of-sight of about 61022 cm-2 (Predehl & Schmitt PS95 (1995)).
This discrepancy between AV and
(also reported by Predehl & Trümper Predehl94 (1994))
may indicate an additional, probably related to the source,
gaseous absorption from nearly neutral gas.
A spectral analysis of other X-ray sources
in the XMM-Newton field of view
will enable to check whether this absorption excess
is peculiar to Sgr A* (Predehl et al., in preparation).
Nayakshin et al. (NCS2003 (2003)) proposed
that such X-ray flares are due to the passage of stars through the accretion
disk around Sgr A*, and that extra absorption may be related to
the neutral accretion disk photosphere
through which the star passes.
The excess absorption could also be explained by an overabundance of heavy
metal elements from a putative Supernova remnant
or He and other heavy elements from
He stars located in the neighbourhood of Sgr A* (e.g., Eckart et al. E95 (1995)).
However, for the blackbody model no extra absorption is required.
We find also a soft X-ray flare spectrum
with =2.50.3,
much softer than for the two other bright flares reported up to now
(with lower S/N):
=1.3 (B01), and
=0.90.5 (Goldwurm et al. Goldwurm2003 (2003)).
The present spectral index is consistent with the ones
found during the quiescent periods of Sgr A* by Chandra:
=2.5 in September 1999 (B03),
and =1.8 in October 2000 (B01).
Such a soft X-ray spectrum is predicted by the scenario
proposed by Liu & Melia (Liu2002 (2002)) in case of an increased viscosity
of the accretion flow, and by the one proposed by Markoff et al.
(M2001 (2001)) in case of an increase of accretion rate or jet power.
However the predictions of these two latter models are not
consistent with observational constraints found at other wavelengths
(e.g, Zhao et al. Zhao2003 (2003), Hornstein et al. Hornstein2002 (2002)).
Although, the Nayakshin et al. (NCS2003 (2003)) star-disk interaction model
predicts a soft X-ray spectral index (2.3) and a moderate
Fe Kα line EW of about 60 eV
the allowed temperature values (kT=1 and 70 keV) are very fine-tuned
(S. Nayakshin, private communication).
Emission from a hot optically thin plasma with kT5.7 keV
and a low relative metal abundance (0.17 compared with the ISM abundances)
is also consistent with the observed spectrum.
But the high metal depletion is difficult to explain
in view of the ambient, diffuse and metal rich emission and the presence
of close supernova remnants such as Sgr A East.
If the flare is related to the accretion disk, the low metallicity could indicate a
less evolved material in the disk.
In conclusion, the present observation
strongly constrains the flare modeling of Sgr A*.
Acknowledgements.
This work is based on observations obtained with XMM-Newton, an ESA science mission with instruments and contributions directly funded by ESA Member States and the USA (NASA). We would like to thank the referee, F.K. Baganoff, for constructive comments and suggestions. D.P. is supported by a MPE fellowship.References
- (1) Baganoff, F. K., Bautz M. W., Brandt W. N., et al. 2001, Nature, 413, 45 (B01)
- (2) Baganoff, F. K., Maeda Y., Morris M., et al. 2003a, ApJ, 591, 891 (B03)
- (3) Baganoff, F. K, Bautz, M. W., Ricker, G. R. et al. 2003b, Astron. Nachr., Vol. 324, in press
- (4) Eckart, A., Genzel, R., Hofmann, R., et al. 1995, ApJ, 445, L23
- (5) Eckart, A. & Genzel, R. 1997, MNRAS, 284, 576
- (6) Falcke, H. & Markoff, S. 2000, A&A, 362, 113
- (7) Goldwurm, A., Brion E., Goldoni P., et al. 2003, ApJ, 584, 751
- (8) Hornstein, S. D., Ghez A. M., Tanner A., et al. 2002, ApJ, 577, L9
- (9) Liu, S. & Melia, F. 2002, ApJ, 566, L77
- (10) Markoff, S., Falcke H., Yuan F., et al. 2001, A&A, 379, L13
- (11) Melia, F. & Falcke, H. 2001, ARAA, 39, 309
- (12) Melia, F., Liu, S. & Coker, R. 2000, ApJ, 545, L117
- (13) Merloni, A. & Fabian, A.C. 2002, MNRAS, 332, 165
- (14) Narayan, R., Mahadevan R., Grindlay J. E., et al. 1998, ApJ, 492, 554
- (15) Nayakshin, S., Cuadra J., & Sunyaev R. 2003, A&A, submitted [astro-ph/0304126]
- (16) Predehl, P. & Trümper, J. 1994, A&A, 290, L29
- (17) Predehl, P. & Schmitt, J.H.M.M. 1995, A&A, 293, 889
- (18) Rieke, G.H., Rieke, M.J. & Paul, A.E. 1989, ApJ, 336, 752
- (19) Schödel, R., Ott, T., Genzel, R., et al. 2002, Nature, 419, 694
- (20) Strüder, L., Briel, U., Dennerl, K., et al. 2001, A&A, 365, L18
- (21) Turner, M. J. L., Abbey, A., Arnaud, M., et al. 2001, A&A, 365, L27
- (22) Wilms, J., Allen, A. & McCray, R. 2000, ApJ, 542, 914
- (23) Yusef-Zadeh, F., Choate, D., & Cotton, W. 1999, ApJ, 518, L33
- (24) Zhao, J. et al., Young, K. H., Herrnstein, R. M., et al. 2003, ApJL, 586, L29
- (25) Zinnecker, H. 2003, IAU, vol. 21, in press [astro-ph/0301074]