Dust in the Early Universe : Dust Formation
in the Ejecta of
Population III Supernovae
Abstract
Dust grains play a crucial role on formation and evolution history of stars and galaxies in the early universe. We investigate the formation of dust grains in the ejecta of population III supernovae including pair–instability supernovae which are expected to occur in the early universe, applying a theory of non–steady state nucleation and grain growth. Dust formation calculations are performed for core collapse supernovae with the progenitor mass ranging from 13 to 30 and for pair–instability supernovae with = 170 and 200 . In the calculations, the time evolution of gas temperature in the ejecta, which strongly affects the number density and size of newly formed grains, is calculated by solving the radiative transfer equation taking account of the energy deposition of radio active elements. Two extreme cases are considered for the elemental composition in the ejecta; unmixed and uniformly mixed cases within the He–core, and formation of CO and SiO molecules is assumed to be complete.
The results of calculations for core collapse supernovae and pair–instability supernovae are summarized as the followings; in the unmixed ejecta, a variety of grain species condense, reflecting the difference of the elemental composition at the formation site in the ejecta, otherwise only oxide grains condense in the uniformly mixed ejecta. The average size of newly formed grains spans the range of three orders of magnitude, depending on the grain species and the formation condition, and the maximum radius is limited to less than 1 m, which does not depend on the progenitor mass. The size distribution function of each grain species is approximately log–normal, except for Mg–silicates, MgO, Si and FeS grains in the unmixed case and Al2O3 grain in the both cases. The size distribution function summed up over all grain species is approximated by a power–law formula whose index is for the larger radius and for the smaller one; the radius at the crossover point ranges from 0.004 to 0.1 m, depending on the model of supernovae. The fraction of mass locked into dust grains increases with increasing the progenitor mass; 2–5 % of the progenitor mass for core collapse supernovae and 15–30 % for pair–instability supernovae whose progenitor mass ranges from 140 to 260 . Thus, if the very massive stars populate the first generation stars (population III stars), a large amount of dust grains would be produced in the early universe. We also discuss the dependence of the explosion energy and the amount of 56Ni in the ejecta as well as the efficiency of formation of CO and SiO molecules on the formation of dust grains in the ejecta of supernovae.
1 Introduction
The recent observations of the reddening of background quasars and the damped Ly systems in the spectra of distant quasars have confirmed the presence of dust grains at high–redshifted universe (e.g., Pettini et al. 1994, 1997; Pei & Fall 1995). Dust grains play a critical role on formation and evolution history of stars and galaxies in the early universe: Dust grains absorb stellar light and re–emit it by thermal radiation, which controls the energy balance in the interstellar space and the evolution of gas clouds. Also the surface of dust grains is an efficient site for formation of H2 molecules which act as an effective coolant at the time of formation of stars from interstellar clouds, and enhance the star formation rate (SFR) and strongly affect the initial mass function (IMF) in the metal–poor universe (Hirashita, Hunt, & Ferrara 2002; Hirashita & Ferrara 2002). In fact, the most iron–poor star HE0107–5240 so far discovered (Christlieb et al. 2002) has raised important questions on the formation of such a metal–poor ([Fe/H]=) but low–mass ( 0.8 ) star. Umeda & Nomoto (2003a) showed that this star can be the second generation star formed from a gas cloud enriched by a population III supernova, which produced very little Fe but large enough C and O for efficient gas cooling. Schneider et al. (2003) also considered this star as the second generation but argued the dust grains produced by population III objects could play an important role in forming low mass stars from such a metal–poor gas cloud as [Fe/H]=. Furthermore, dust grains residing in interstellar space in galaxies and in intergalactic medium cause obscuration and reddening of starlight, and the thermal radiation from the dust grains distorts the cosmic background radiation (see Hauser & Dwek 2001 for details). How much dust grains absorb stellar light and re–emit it by thermal radiation heavily depends on their chemical composition, size and abundance. Therefore, the investigation of dust grains in the early universe is inevitable not only to reveal the structure and evolution of the early universe but also to deduce the SFR and the IMF during the evolution of the universe from the observations of the cosmic microwave background (CMB) and the cosmic infrared background (CIB) which could be one of the main subjects of the planned Atacama Large Millimeter Array (ALMA) and the Next Generation Space Telescope (NGST) (Loeb & Haiman 1997).
In cosmic environments, dust grains form in a cooling gas outflowing from star to interstellar space such as in the stellar winds from AGB stars and in the ejecta of supernovae. The major source of dust grains in our Galaxy is considered to be AGB stars evolving from stars with main–sequence mass 8 . However, the age of AGB stars is too old to contribute to dust grains in the early universe. Thus, supernovae evolving from stars whose main–sequence mass is larger than 8 are considered to be the major source of dust grains in the early universe. Dust formation in the ejecta of supernovae has been suggested from the isotopic anomalies in meteorites, and the microscopic analysis of each dust grains extracted from meteorites has identified SiC, graphite and Si3N4 grains as the supernovae condensates (SUNOCONs) from their isotopic composition (see Zinner 1998 for details). SN 1987A is the first supernova in which the in–situ dust formation in the expanding ejecta was observed (Lucy et al. 1989; Whitelock et al. 1989; Meikle et al. 1993; Wooden et al. 1993; Colgan et al. 1994), and the model of formation of dust grains in the ejecta was investigated by Kozasa, Hasegawa, & Nomoto (1989a,b, 1991). Also the dust formation was confirmed in the ejecta of SN 1999em from the appearance of blue–shifted line emissions as observed in SN 1987A (Elmhamdi et al. 2003).
What kind of and how much dust grains condense in the ejecta have been still on debate. The observations of young supernova remnants (SNRs) with Infrared Space Observatory (ISO) revealed the thermal radiation from dust grains condensed in the ejecta of Cas A (Lagage et al. 1996; Arendt, Dwek, & Moseley 1999), and the observed thermal radiation is well fitted by a mixture of Al2O3, MgSiO3 and SiO2 grains (Douvion, Lagage, & Pantin 2001), otherwise the spectroscopic observation at 2.4–45 m suggested that the pristine dust in Cas A is a peculiar class of silicate material (Arendt, Dwek, & Moseley 1999). However, no thermal radiation originating from dust grains formed in the ejecta was observed towards the Tycho, Kepler and Crab SNRs by ISO (Douvion et al. 2001), despite that the optical observations have suggested the presence of dust grains in the Crab SNR (Fesen & Blair 1990; Hester et al. 1990). The estimated amount of hot dust observed in Cas A SNR by ISO (Arendt, Dwek, & Moseley 1999) is 10 to 100 times smaller than the previous value estimated from IRAS observations (e.g., Mezger et al. 1986; Dwek et al. 1987). However the recent submillimeter observations by SCUBA have revealed the existence of cold dust in the young SNR of Cas A and concluded that the amount of dust condensed in the ejecta is estimated to reach a few (Dunne et al. 2003). These observations strongly support that Type II supernovae could be the major source of dust grains in the early universe.
Of course, the chemical composition, size and amount of dust grains in the early universe are determined by the balance between production in the ejecta of supernovae and destruction by interstellar shock as well as reverse shock penetrating into the ejecta (see, e.g., Dwek 1998 for details), and the investigation of dust formation in the ejecta of population III supernovae is the first step to reveal the nature of dust grains in the early universe. Todini & Ferrara (2001) performed the dust formation calculations in the primordial core collapse supernovae with the progenitor mass ranging from 12 to 35 , adopting the models of supernovae by Woosley & Weaver (1995) and applying the method of dust formation calculation for SN 1987A by Kozasa, Hasegawa, & Nomoto (1989a, 1991) as a template. In the calculations, they considered one–zone model for elemental composition and density in the ejecta, assuming the uniform mixing of elements within the He–core. Taking account of formation and destruction of CO and SiO molecules, they showed that carbon grain condenses first and then Al2O3, Mg–silicates and Fe3O4 grains condense in this order as the gas cools down. Also, they showed that the size of newly formed grains is relatively small ( 300 in radius) and is sensitive to the value of adiabatic index , and that the total mass of produced dust is about 0.08 to 0.3 per supernova.
The recent theoretical investigations of fragmentation of gas clouds in the metal–free early universe have claimed that the stars more massive than some tens–100 populate the first generation stars (Nakamura & Umemura 2001; Bromm, Coppi, & Larson 2002). Such metal–free stars massive as 140 260 may evolve stably to end up their lives as pair–instability supernovae (e.g., Umeda & Nomoto 2002; Heger & Woosley 2002). Also Umeda & Nomoto (2002) have suggested that hypernovae whose explosion energy is more than several to ten times that of the ordinary core collapse supernovae are necessary to reproduce the enhancement of Zn and iron–peak elements observed in metal–poor stars. Therefore, in this paper, we explore the dust formation in the ejecta of population III supernovae including hypernovae and pair–instability supernovae to investigate the dependence of the progenitor mass and the explosion energy on the formation of dust grains in the ejecta. Our main aim is to clarify the dependence of the yield of newly formed grains and their size on the progenitor mass, focusing on the ordinary core collapse supernovae and pair–instability supernovae. We also investigate the effects of the explosion energy and the mass of 56Ni in the ejecta as well as the efficiency of formation of CO and SiO molecules on the formation of dust grains.
As discussed by Kozasa, Hasegawa, & Nomoto (1989a), the elemental composition in the ejecta controls what kind of grain species condenses, and the temporal evolution of gas density and temperature in the ejecta strongly affects the size of newly formed grains in the ejecta. Thus, in the dust formation calculations we employ the hydrodynamical models and the elemental compositions of population III supernovae calculated by Umeda & Nomoto (2002). The time evolution of gas temperature is calculated by the multifrequency radiative transfer code taking account of the energy deposition from radio active elements (Iwamoto et al. 2000). The two extreme cases for the elemental composition in the ejecta are considered; the elemental composition with original onion–like structure (hereafter referred to as unmixed case) and the uniformly mixed case within the He–core. A theory of non–steady state nucleation and grain growth is applied for the calculation of dust grains under the assumption that formation of CO and SiO molecules is complete. Formation of all possible condensates is taken into account simultaneously to clarify what kind of grain species really condenses.
In section 2 we present the models of supernovae used in the calculations, and the method of dust formation calculation is described in section 3. The results of calculations for ordinary core collapse supernovae and pair–instability supernovae are presented and discussed in section 4, and summarized in section 5. The effects of the explosion energy and the amount of 56Ni in the ejecta as well as the efficiency of formation of CO and SiO molecules on the dust formation in the ejecta of supernovae are presented in Appendix A and B, respectively.
2 Model of the population III supernovae
The nature of population III supernovae has been extensively investigated to decipher the chemical evolution of the early universe compared with the observed elemental abundance of metal–poor stars (Umeda & Nomoto 2002, 2003b). Umeda & Nomoto (2002) have suggested that, in addition to ordinary core collapse supernovae with the explosion energy erg, hypernovae whose explosion energy is larger than 5–50 erg (e.g., Nomoto et al. 2001, 2003 for reviews) are necessary to reproduce the enhancement of Zn and iron–peak elements observed in metal–poor stars. Also in the metal–free universe very massive stars with mass ranging from 140 to 260 evolve stably and explode as the pair–instability supernovae for which the star is completely disrupted by nuclear–powered explosion (Umeda & Nomoto 2002; Heger & Woosley 2002).
We apply the hydrodynamical models and the results of nucleosynthesis calculations of population III supernovae by Umeda & Nomoto (2002) for the dust formation calculations. The details of the model used in the present calculations are summarized in Table 1, where the labels C, P and H of the model represent ordinary core collapse supernovae (CCSNe), pair–instability supernovae (PISNe) and hypernovae (HNe), respectively, and the numerical value denotes the mass of progenitor in units of solar mass. The mass cut is the mass coordinate of the boundary between the ejecta and the remnant, and its value specifies the mass of 56Ni in the ejecta; = 0.07 is taken as a typical value for ordinary CCSNe to reproduce the observed behavior of early light curve for CCSNe. The models of HNe (H20A, B and H30A, B) are adopted to investigate the dependence of the explosion energy and the mass of 56Ni in the ejecta on dust formation. The elemental composition and the temporal evolution of gas density and temperature in the ejecta, which are essential to investigate the dust formation, are summarized in the following subsections.
2.1 Elemental composition
The elemental composition in the ejecta determines what kind of grain species condenses. No dust grain condenses in the hydrogen envelope of population III supernovae because the hydrogen envelope is metal–free. Even if heavy elements are intruded into the hydrogen envelope during the evolution of progenitor, the low density and the high expansion velocity prevent dust grains from condensing in the hydrogen envelope as discussed by Kozasa, Hasegawa, & Nomoto (1989a, 1991). Thus, the dust formation region in the ejecta of population III supernovae is confined within the He–core where heavy elements exist.
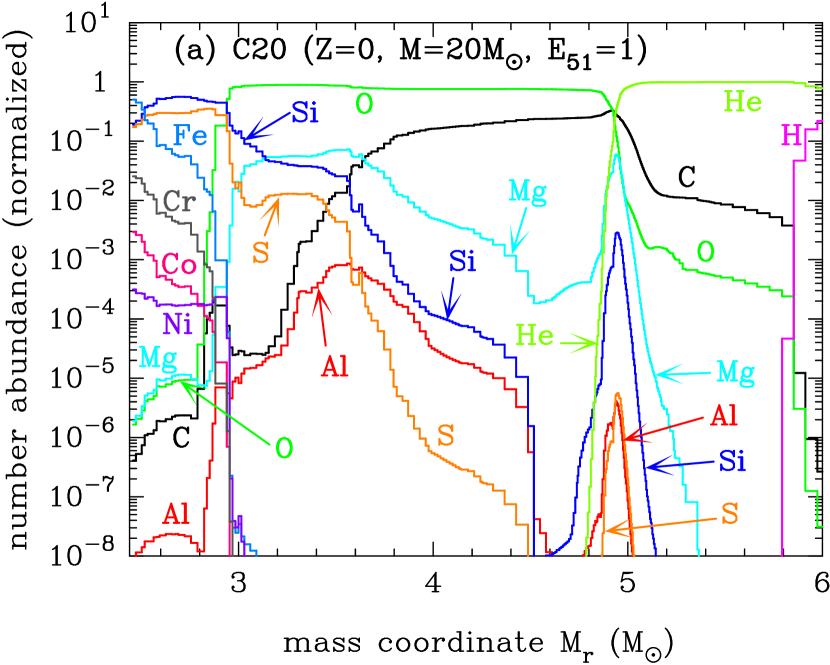
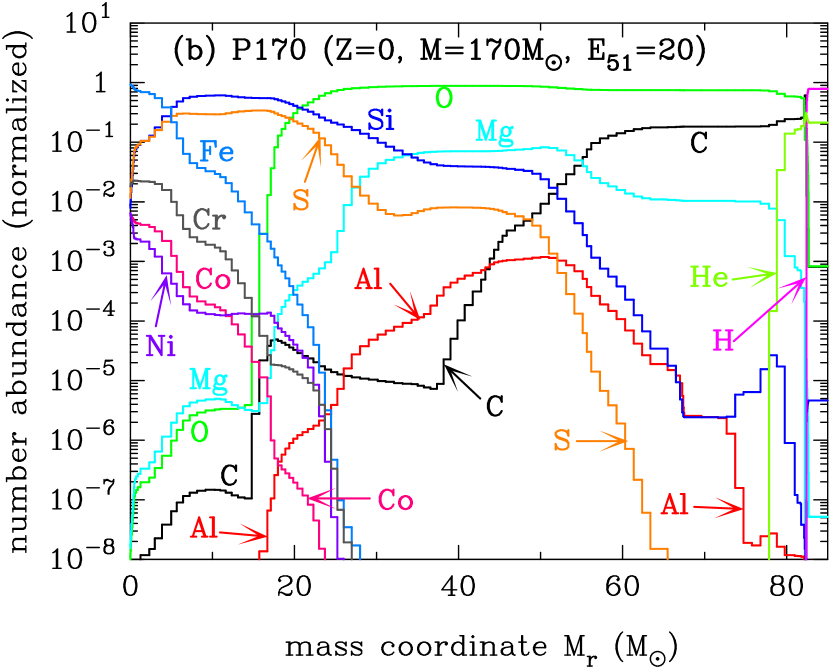
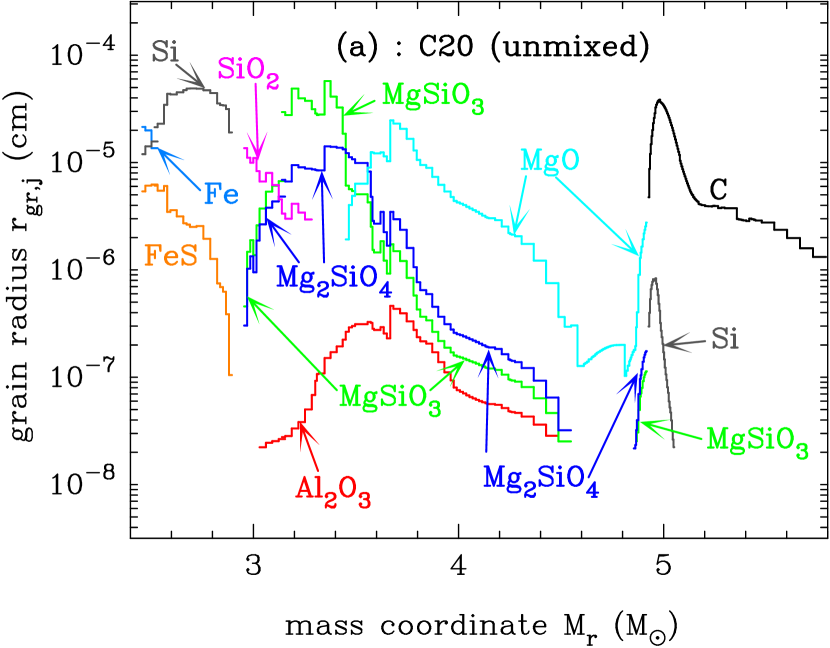
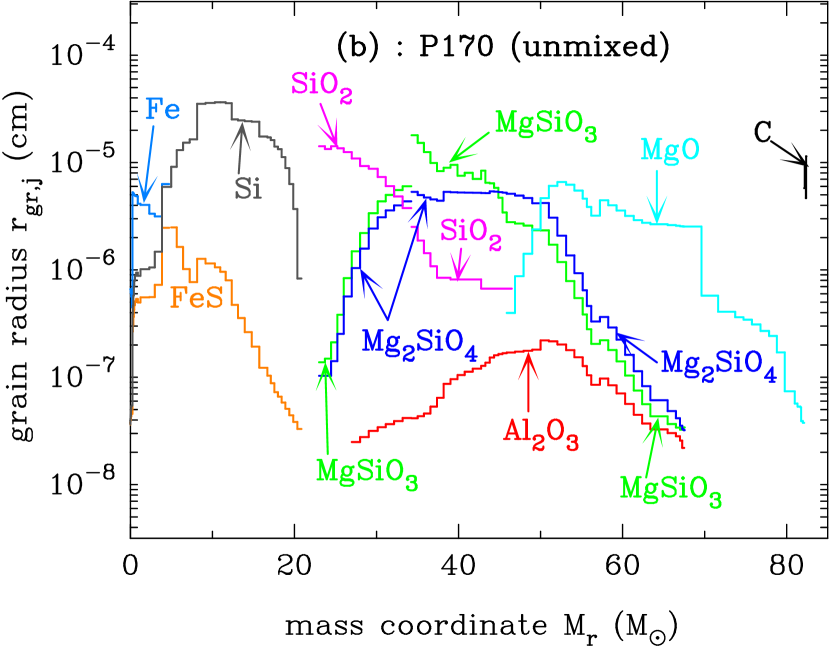
Figure 1 shows the elemental composition within the unmixed He–core at day 600 after the explosion, taking account of the decay of radio active elements; Fig. 1a for a model of CCSNe (C20) and Fig. 1b for PISNe (P170). The ejecta is divided into five regimes according to the elemental composition of interest to dust formation; for example, in the ejecta of the model C20, Fe–Si–S layer (2.45 2.52 ), Si–S–Fe layer (2.52 2.95 ), O–Si–Mg layer (2.95 3.14 ), O–Mg–Si layer (3.14 4.92 ) and He–layer (4.92 5.79 ).
The He–layer is carbon–rich (C/O 1) for CCSNe and its mass irregularly varies with the progenitor mass in the models of CCSNe used in this paper. The mass of oxygen–rich layer (O–Si–Mg layer and O–Mg–Si layer) increases with increasing the progenitor mass, and the mass of inner Si–S–Fe and Fe–Si–S layer depends on the value of the mass cut. On the other hand, in the ejecta of PISNe, the He–layer is very thin for P170 and the mass increases with increasing the progenitor mass.
The mixing of elements in the ejecta of SN 1987A was confirmed from the early emergence of X–rays and –rays (e.g., Dotani et al. 1987; Itoh et al. 1987; Kumagai et al. 1988), and also the hydrodynamical simulations (Hachisu et al. 1990; see Arnett et al. 1989 for a review and references) and the laboratory experiments (Drake et al. 2002) clearly demonstrate that the mixing of elements is caused by the Rayleigh–Taylor instability at the interface of each layer with the different elemental composition. The isotopic signatures in the presolar carbon and SiC grains identified as SUNOCONs have suggested the extensive and microscopic mixing of elements in the different layers in the explosion (Amari & Zinner 1997; Travaglio et al. 1999). Thus, as an ideal case, the uniform mixing of elements within the He–core was considered to investigate dust formation in the ejecta of supernovae (Kozasa, Hasegawa & Nomoto 1989a; Todini & Ferrara 2001; Schneider, Ferrara, & Salvaterra 2003). On the other hand, Douvion, Lagage, & Pantin (2001) have suggested that the mixing in the ejecta of the Cas A SNR is knotty rather than microscopic. A simple calculation of molecular diffusion has shown that the mixing at atomic level is impossible before the condensation of dust grains in the ejecta (Deneault, Clayton, & Heger 2003). It has been still on debate at this moment whether the mixing is macroscopic at knotty level or microscopic at atomic level and how large the mixing is extended in the ejecta. Therefore, in the following calculation of dust formation we consider the two extreme cases for the mixing of elements; one is the unmixed case with the original onion–like structure, and another is the mixed case for which the elements are uniformly mixed within the He–core.
2.2 The time evolution of gas density and temperature in the ejecta
The time evolution of gas density and temperature strongly affects the number density and size of newly formed grains in the ejecta. As the explosion shock propagates outwards, the reverse shock generated at the interface of layers with different chemical composition changes the density structure. Although Deneault, Clayton, & Heger (2003) show that the reverse shock generated at the He–H interface introduces a very nonhomologous readjustment after seconds from the explosion, our hydrodynamical calculations including the interaction with the reverse shock have shown that the interaction makes the expansion finally homologous in less than one day after the explosion (see Shigeyama & Nomoto 1990). Thus, the time evolution of gas density at a given mass coordinate is calculated by
| (1) |
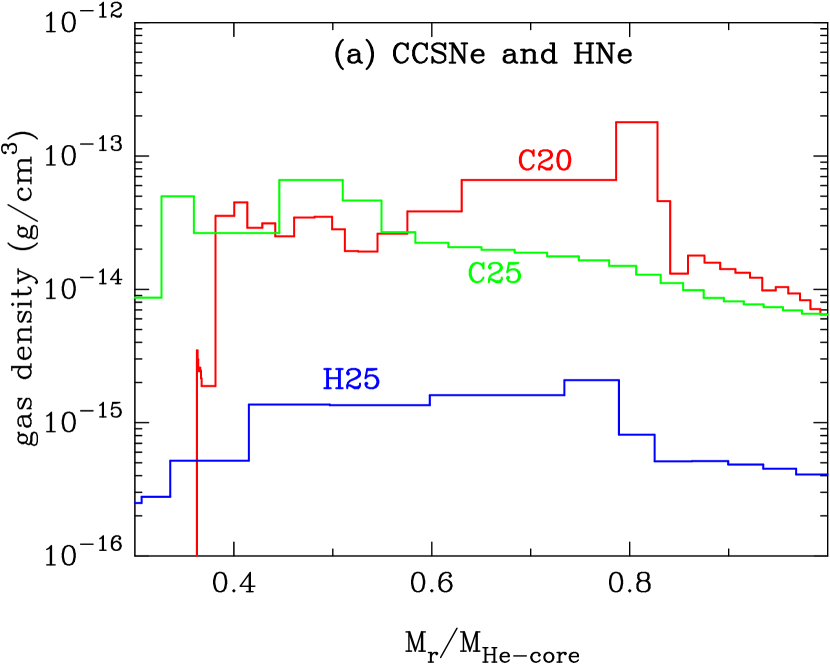
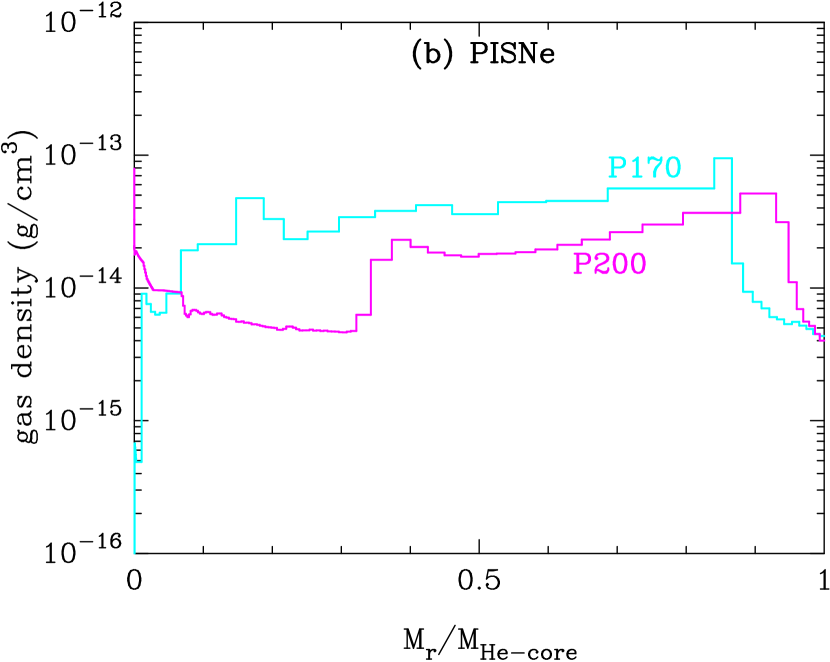
where the reference time is one day after the explosion. The distribution of gas density within the He–core at day 600 after the explosion is shown in Figure 2 where the mass coordinate is normalized to the He–core mass and the histogram presentation of the density structure reflects the size of mesh used in the calculations: Fig. 2a for CCSNe (C20 and C25) and HNe (H25), and Fig. 2b for PISNe (P170 and P200). The gas density within the He–core of CCSNe with the same explosion energy is almost the same in the order of magnitude and does not depend so much on the progenitor mass, apart from the detailed structure caused by the propagation of reverse shock originating at the interface of each layer. The gas density in the ejecta of H25 is one order of magnitude lower than that of CCSNe, reflecting the explosion energy of ten times of CCSNe. Also the gas density in the ejecta of P200 is a little bit lower than that in the ejecta of P170, but the gas density within the He–core is 10-14–10-13 g cm-3 at day 600 after the explosion and is almost the same order of the magnitude as the gas density in the ejecta of CCSNe, except for the region 40 .
The gas temperature in the ejecta is determined by the detailed process of the degradation of –rays and X–rays deposited from the radio active elements. In the previous calculations (Kozasa, Hasegawa, & Nomoto 1989a, 1991; Todini & Ferrara 2001), the time evolution of gas temperature was approximated by
| (2) |
with a parameter , and the reference temperature was determined by the observations of SN 1987A. However this method is not applicable for population III supernovae with no observational data. Therefore, the time evolution of gas temperature is calculated by using the multifrequency radiative transfer code together with the energy equation, taking account of the deposition of energy from radio active elements (see Iwamoto et al. 2000 for details).
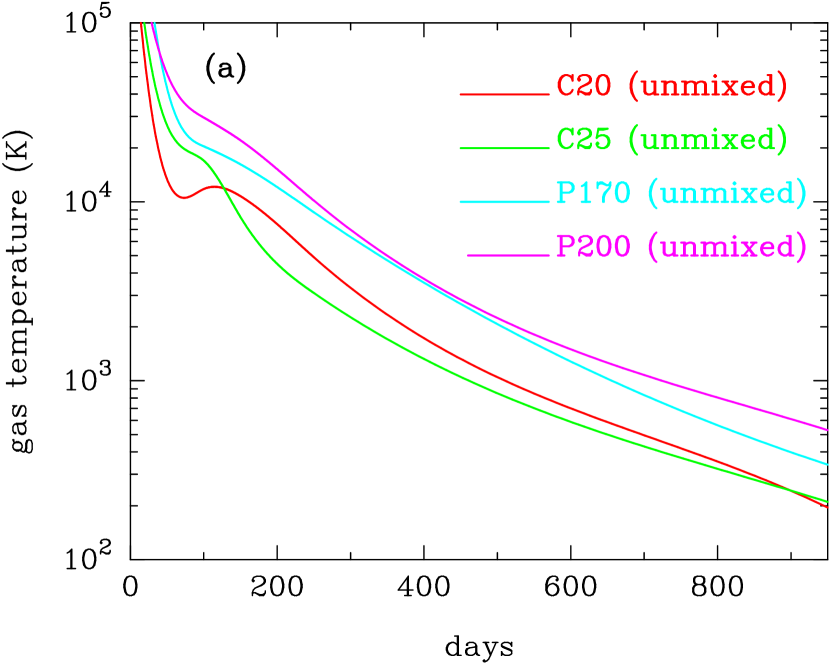
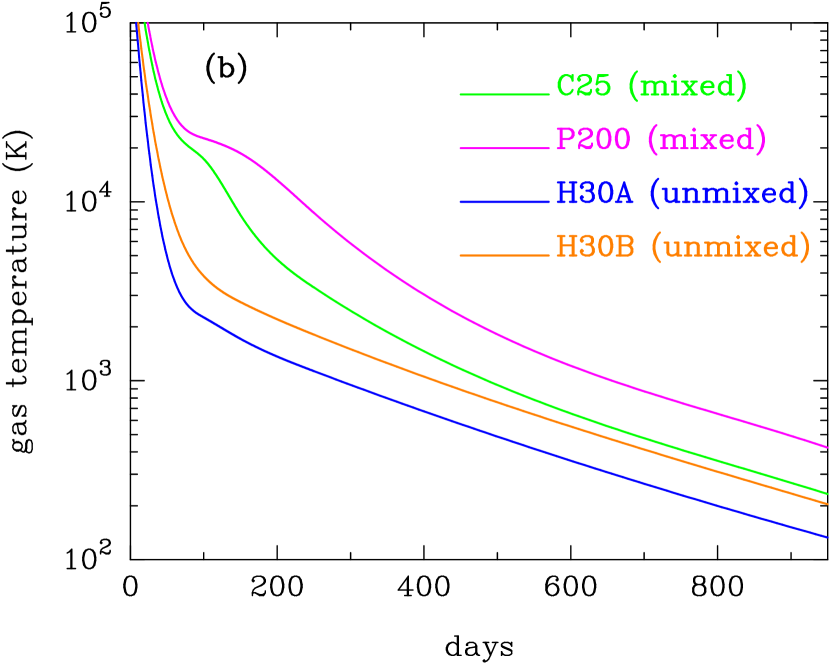
As an example, Figs. 3a and 3b show the time evolution of gas temperature at a location of oxygen–rich layer with almost the same elemental composition in the ejecta of CCSNe, PISNe and HNe; Fig. 3a for the unmixed ejecta of C20 (at 3.7 ), C25 (at 4.6 ), P170 (at 56.5 ) and P200 (at 64.9 ), and Fig. 3b for the mixed ejecta of C25 (at 4.6 ) and P200 (at 64.9 ) and for the unmixed ejecta of H30A (at 6.8 ) and H30B (at 6.8 ). As can be seen from Figure 3, it should be pointed out here that the temporal evolution of gas temperature in the ejecta is approximately determined only by the explosion energy and the amount of 56Ni in the ejecta and does not heavily depend on the progenitor mass in the mass range considered in this paper. Also the gas temperature in the mixed ejecta is almost the same as that in the unmixed ejecta, except for the gas temperature around the day 200 after the explosion. The gas temperature in the ejecta of H30 with the large explosion energy quickly decreases in comparison with CCSNe, because X–rays and –rays escape easily due to the low gas density in the ejecta. The effect of in the ejecta on the gas temperature is clearly shown by the difference of the gas temperature in the unmixed ejecta between H30A and H30B. The gas temperature in the ejecta of PISNe with the large explosion energy is much higher than that in CCSNe because the progenitor is massive and a large amount of 56Ni reside in the ejecta.
From Figures 2 and 3, we can easily estimate the condensation time and the behavior of the average radius of a grain species formed in the ejecta of population III supernovae; if the grains condense around gas temperature of 1500 K in the oxygen–rich layer, the condensation time after the explosion would be around day 400 for CCSNe, day 600 for PISNe and day 200 for HNe with the same as CCSNe. The average radius of the condensate would be not so much different since the average size is roughly proportional to , so far as the abundance of the elements available for dust formation is the same, which is confirmed by the results of dust formation calculations given in section 4 and Appendix A. Note that the radiation transfer calculation does not include the radiative cooling of molecules such as CO and SiO which act as effective coolants of gas in the ejecta as demonstrated by Liu & Dalgarno (1995) for SN 1987A. The effect of radiative cooling of molecules would make the condensation time of dust grains earlier and the average radius larger than those presented in section 4. However the average size and the number density of newly formed grains could not be so much different so far as the condensation time is in the order of one hundred days.
3 Formulation and calculation of dust formation
3.1 Formulation of nucleation and grain growth
In astrophysical environments, dust grains condense via formation of condensation nuclei and their growth through the collisions of gaseous species in a cooling gas outflowing from star into interstellar space.
The nucleation rate is usually formulated under the condition of presence of monomer molecule whose chemical composition is the same as the condensate. However, for formation of compound grains of astrophysical interest such as silicates, no gaseous monomer molecule exists and it is impossible to derive rigorously the nucleation rate without specifying the chemical passways and reaction constants. Nevertheless, even if no information on chemical passways and reaction constants is available for formation of compound grains, as is discussed by Yamamoto et al. (2001), the nucleation rate can be evaluated by applying the concept of the key species introduced by Kozasa & Hasegawa (1987) when the net reaction rate is much larger than the decay rate. Under the assumption that the key species defined as the gaseous species of the least collision frequency among the reactants controls the kinetics of nucleation and grain growth, the steady state nucleation rate of –th grain species is given by
| (3) |
where is the sticking probability of the key species for –th grain species, is the volume of the condensate per the key species, and is the surface energy. We assume in the calculations (see Hasegawa & Kozasa 1988; Kozasa et al. 1996; Chigai, Yamamoto, & Kozasa 1999 for the derivation of steady–state nucleation rate). The concentration and the mass of the key species for –th grain species are denoted by and , respectively. is the temperature of the condensation nuclei and is the gas temperature (see Kozasa et al. 1996). The factor is a function of partial gas pressures of reactants and products except for the key species (Yamamoto et al. 2001) and we put in the calculations, partly because the appearance of the factor is somehow related with the detailed chemical reaction mechanism at the condensation and partly because the factor can be negligible under the condition that the number of the key species contained in the condensation nuclei is much larger than unity. The quantity representing the energy barrier for nucleation is defined by with the hypothetical radius of condensate per the key species , where is the Boltzmann constant. We assume the temperature of the condensation nuclei is the same as the gas temperature in what follows. The supersaturation ratio taking into account the chemical reaction at the condensation of –th grain species is calculated by
| (4) |
where the is the Gibbs free energy of formation of –th grain species from the reactants per the key species and are the partial gas pressures of reactant and product gas species. The stoichiometric coefficients of reactants and products are normalized to the key species; is positive for a reactant and negative for a product (see Kozasa & Hasegawa 1987; Hasegawa & Kozasa 1988).
In the ejecta of supernovae where the gas cooling time and/or the collision time controlling the process of nucleation and grain growth are comparable to the dynamical time scale, the application of the steady state nucleation rate is questionable. In this paper, according to Gail, Keller, & Sedlmayr (1984), we employ the non–steady state nucleation rate evaluated by the equation
| (5) |
with the relaxation time towards the steady state defined by
| (6) |
and , where is the collision time of the key species and is the critical radius for –th grain species.
Given the nucleation rate at a time , the process of nucleation and grain growth is described by the two basic equations in a frame comoving with gas; one is the equation of continuity for the key species given by
| (7) |
where is the equilibrium time defined as a time at which the supersaturation ratio reaches to unity without depletion of the key species, and is the nominal concentration of the key species expected without depletion of the key species due to nucleation and grain growth, and represents the degree of depletion of the key species due to nucleation and grain growth, and is the radius of grain nucleated at and measured at . Another is the equation of grain growth given by
| (8) |
By differentiating the equation (7) with subsequently, the integral equation is reduced to the simultaneous ordinary equations
| (9) |
with
| (10) |
In principle, by solving the equations (5), (8), (9) and (10) in couple with the temporal evolution of gas density and temperature with the number abundances of reactants, the number density and volume equivalent average radius of –th grain species are calculated by
| (11) |
and
| (12) |
respectively. Furthermore, the size distribution function of newly formed –th grain species at a time is calculated by
| (13) |
since the grains with radii between and are nucleated in the time interval of and .
3.2 Calculation of dust formation in the ejecta of supernovae
Formation of dust grains in the ejecta of supernovae is calculated by solving the equations (5), (8), (9) and (10) with the temporal evolution of gas density and temperature, given the grain species and the chemical reaction at the condensation with the abundance of the reactants. The formation of CO and SiO molecules prior to the formation of dust grains was observed in the ejecta of SN 1987A (e.g., Bouchet & Danziger 1993). Formation of CO and SiO molecules plays a crucial role on the formation of dust grains, because CO molecules lock the oxygen atoms available for formation of oxide grains and SiO molecules are considered to be the starting molecules to form silicate grains.
As discussed by Liu & Dalgarno (1994, 1996), in the ejecta of supernovae, these molecules are destroyed by the impact with energetic electrons and charge transfer reactions with the ionized inert gaseous atoms which are created by the decay of radio active elements whose abundances depend on the elemental composition as well as the degree of the mixing in the ejecta. In this paper, to simplify the calculation of dust formation, we assume that formation of CO and SiO molecules is complete, that is, no carbon–bearing grain condenses in the region of C/O 1 and no Si–bearing grain except for the oxide grains condenses in the region of Si/O 1. The effect of incomplete formation of CO molecules has been extensively investigated by Clayton, Liu, & Dalgarno (1999) and Clayton, Deneault, & Meyer (2001) and they have shown that carbon grain can condense even in the region of C/O . Also the formation efficiency of SiO molecules is expected to affect the abundance and the size of Si– and/or Mg–bearing grains. The effect of the formation efficiency of CO and SiO molecules on the dust formation in the ejecta is discussed in Appendix B.
The grain species, the chemical reactions at the condensations and the basic data necessary for dust formation calculations are tabulated in Table 2. The Gibbs free energy for formation of a condensate from the reactants is approximated by a formula and the numerical values of A and B are evaluated by the least squares’ fitting of the thermodynamic data (Chase et al. 1985). It should be recognized here that what kind of grains species really condenses in the gas with a given elemental composition is determined by the competitive process of formation of each grain species, because formation of a grain species depletes the gaseous atoms and molecules available for the condensation of other grains. So in the calculations, formation of all possible condensates tabulated in Table 2 is taken into account simultaneously.
4 The results of calculations and discussions
In this section, the results of calculations of dust formation in the ejecta of ordinary CCSNe and PISNe are presented and discussed. The behaviors of nucleation and growth of dust grains are depicted in section 4.1. The detailed results of the condensation times, the average radii, and the size distribution functions of each grain species formed in the unmixed and mixed ejecta of CCSNe and PISNe are presented and discussed in sections 4.2 and 4.3, respectively. The dependence of the total mass of newly formed grains and that of the mass yield of each grain species on the progenitor mass are given in sections 4.4 and 4.5, respectively. The effects of the explosion energy as well as the amount of 56Ni in the unmixed ejecta on dust formation are investigated in Appendix A, and the effect of the formation efficiency of CO and SiO molecules is discussed in Appendix B.
4.1 The behavior of nucleation and grain growth
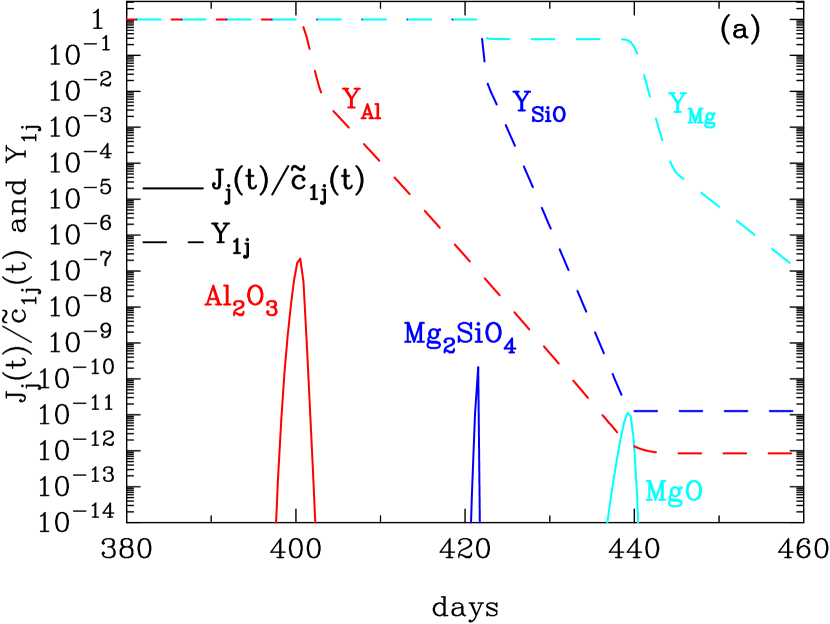
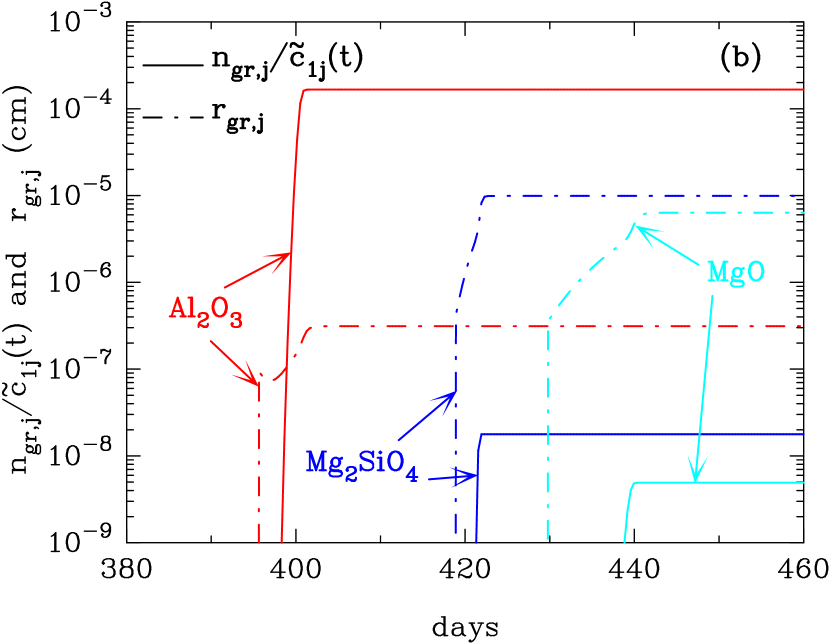
Figure 4 depicts the behaviors of nucleation and grain growth as a function of time after the explosion at a location of 3.5 in the O–Mg–Si layer with the elemental abundances relative to oxygen Si/O , Mg/O , and Al/O ; Fig. 4a for the behaviors of nucleation rate and the depletion of the key species , and Fig. 4b for the number density and the average radius . At this location, the expected condensates are Al2O3, Si– and/or Mg–bearing grains. The key species is Al for Al2O3 and Mg or SiO for Mg– and/or Si–bearing grains depending on what kind of grain species really condenses.
As the gas cools down with time, it can be clearly shown from Figs. 4a and 4b that the nucleation rate rapidly increases with increasing the supersaturation ratio, and then decreases with the depletion of the key species due to grain growth, thus the nucleation rate has a maximum at a time. This is a typical behavior of nucleation and grain growth in a cooling gas. The time at which the nucleation rate reaches to the maximum is defined as the condensation time. At this location, Al2O3 grain condenses first at day 400, and then Mg2SiO4 condenses consuming the key species SiO at day 421, and finally the remaining Mg atoms are locked into MgO grains at day 439. Also it should be noted that each grain grows to the final radius in the very short time interval; less than 20 days after the condensation time.
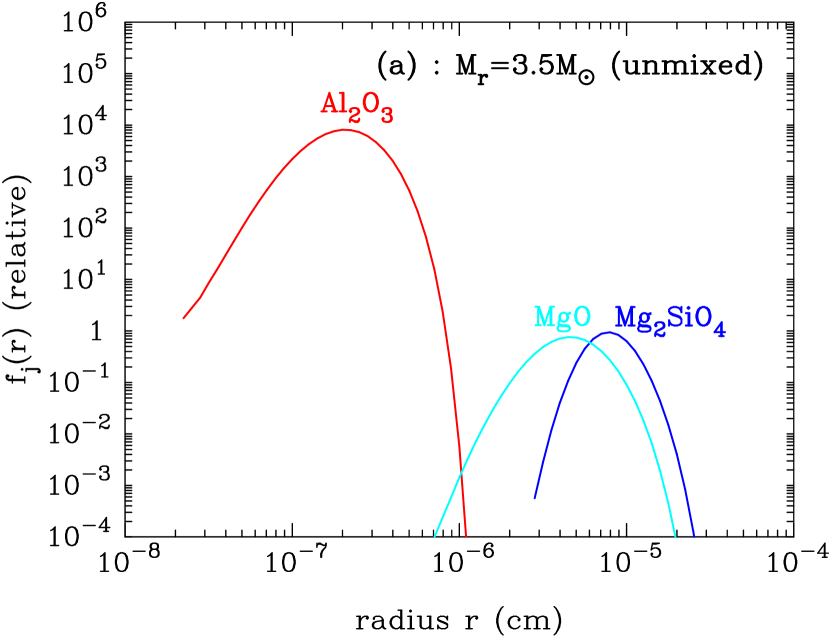
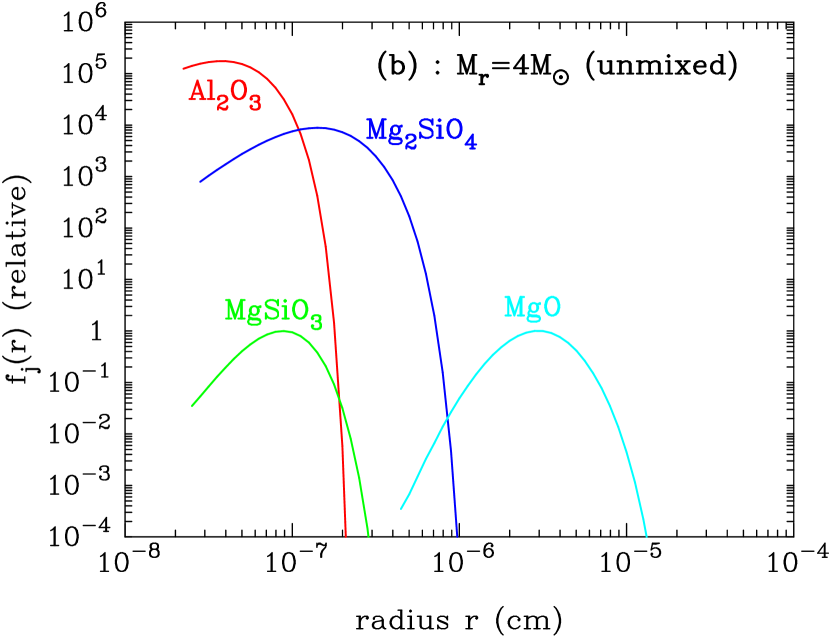
Furthermore, we can see from Figs. 4a and 4b that the smaller abundance of the key species leads to the larger number density of condensation nuclei with broad peak of the nucleation rate and results in the small average radius. Thus, the abundance of the key species is very sensitive to the number density and average radius of newly formed grains, which is well reflected to the size distribution function of grains given in Figure 5; Fig. 5a at 3.5 and Fig. 5b at 4.0 where the abundances of Si, Mg and Al are more than one order of magnitude smaller than at 3.5 ; Si/O , Mg/O , and Al/O . At 4.0 , the smaller abundance of the key species SiO for formation of Mg2SiO4 grains results in the larger number of condensation nuclei with very broad peak of the nucleation rate corresponding to the wide-spreaded size distribution, which is true for formation of Al2O3 grains. On the other hand, the size distribution function of MgO grains at 4.0 is almost the same as that at 3.5 , because the abundance of Mg being the key species for formation of MgO and remaining after the formation of Mg2SiO4 is only factor 4 smaller at 4 than at 3.5 . Note that the size distribution function of a grain species formed at a location is approximately log–normal so far as the average size is larger than 0.01 m.
4.2 The dust formation in unmixed ejecta of CCSNe and PISNe
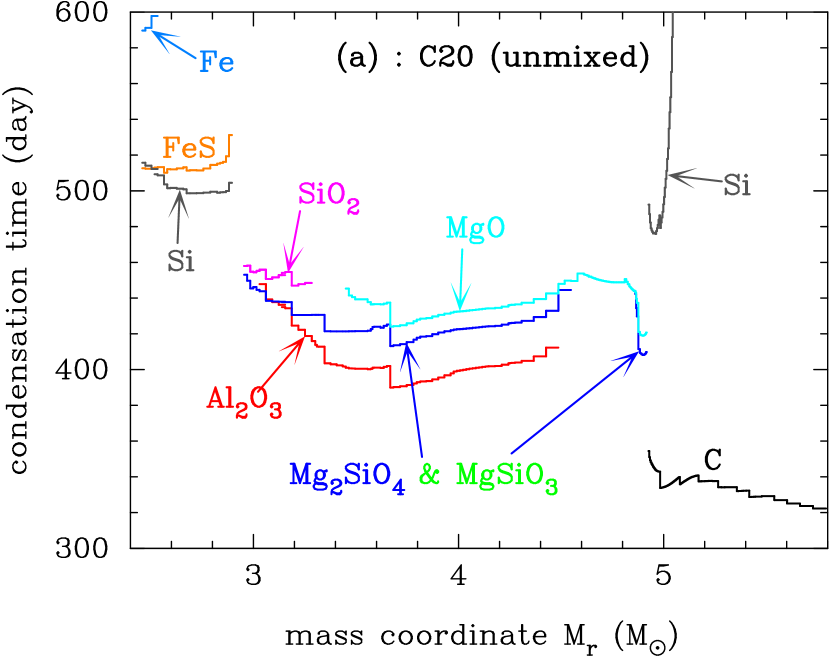
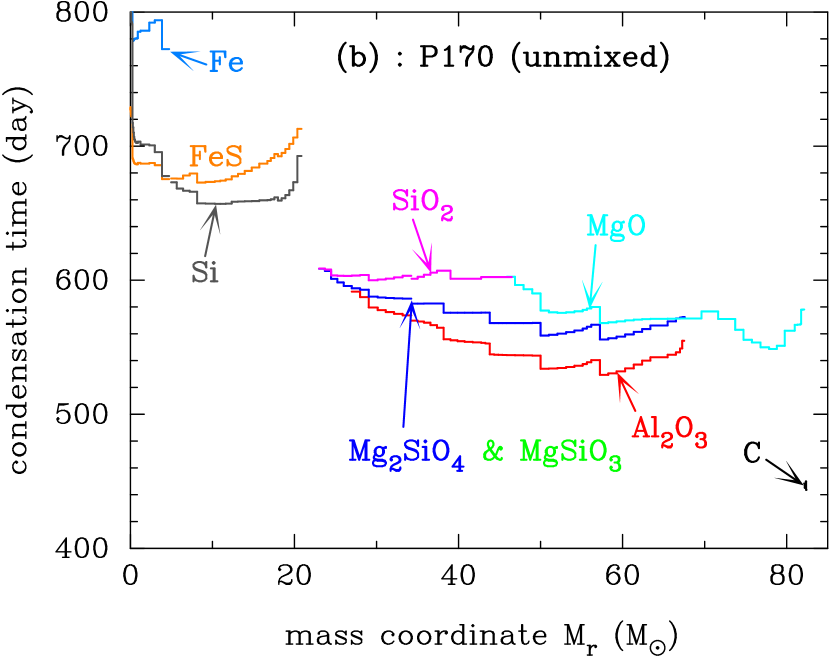
In the unmixed ejecta of supernovae, a variety of grain species condense in each layer corresponding to the difference in the elemental composition. Fig. 6a and Fig. 6b show the condensation times of dust grains formed in the unmixed ejecta of C20 and P170, respectively. At first carbon grains condense in the He–layer, which is followed by the condensation of Al2O3 and Mg–silicates (Mg2SiO4 and MgSiO3) in the oxygen–rich layer, MgO in the O–Mg–Si layer, SiO2 in O–Si–Mg layer, Si and FeS inside Si–S–Fe layer, and Fe in the innermost Fe–Si–S layer in this sequence. Note that in the O–Si–Mg layer SiO2 grains condense from SiO molecules left over after the formation of Mg–silicate grains, otherwise MgO grains condense from Mg atoms remaining in the O–Mg–Si layer. The major grain species are Mg2SiO4 and MgO in the O–Mg–Si layer, otherwise MgSiO3 and SiO2 in the O–Si–Mg layer. In the ejecta of C20, Si grains condense in the innermost region of the He–layer because a significant amount of Si atoms are present around the interface between He–layer and oxygen–rich layer (see Fig. 1a), but no SiC grain condenses in this region. Anyway, in the unmixed ejecta of C20 and P170, the grain species condensed in the ejecta are the same. Also metallic Cr and Ni grains do not condense significantly in the Fe–Si–S layer of the both ejecta because of the low number density as well as the high energy barrier for nucleation.
The condensation time generally depends not only on the temporal evolution of gas temperature but also on the concentration of the key species at the formation site. On the other hand, given the time evolution of gas temperature, the condensation temperature defined as the gas temperature at the condensation time depends only on the concentration of the key species; the condensation temperature decreases with decreasing the concentrations. In the unmixed ejecta of CCSNe and PISNe, the condensation temperature does not heavily depend on the progenitor mass; 1900 K for carbon, 1600–1700 K for Al2O3, 1400–1500 K for Mg–silicates, 1350–1450 K for MgO, 1300–1400 K for SiO2, 1100–1200 K for Si, 1000–1100 K for FeS and 800–850 K for Fe. The reason is as follows; as described in section 2, the concentration of the key species is a few times large in the ejecta of PISNe compared with CCSNe, and the elemental composition in each layer and the gas density at a time are not so significantly different between CCSNe and PISNe. On the other hand, the gas temperature in the ejecta of PISNe is higher than that of CCSNe. Thus, as can be seen from Figs. 6a and 6b, the condensation time of each grain species in the ejecta of PISNe is about 150 days delayed in comparison with that of CCSNe. Anyway, dust grains condense in the ejecta of ordinary CCSNe around day 300 to 600 after the explosion, and around day 500 to 800 in the ejecta of PISNe, which is almost independent of the progenitor mass.
Figures 7a and 7b show the average radius of each grain species in the ejecta of C20 and P170, respectively. The average radius of each grain species well reflects the concentration of the key species at the condensation time, and heavily depends on the elemental composition and the gas density at the formation site in the ejecta. In the ejecta of C20, the average radii of Fe and Si condensed in the innermost region are relatively large; about 0.2 m for Fe and 0.4 m for Si. The range of the average radius spans about one order of magnitude for carbon, Al2O3, SiO2 and FeS whose maximum radii are 0.4 m, 0.004 m, 0.1 m and 0.06 m, respectively. The range spans more than two orders of magnitude for MgO, Mg2SiO4, and MgSiO3 with the maximum radii 0.2 m, 0.1 m and 0.5 m, respectively. In the ejecta of P170, the average radius of each grain species is a little smaller than that in the ejecta of C20, but the difference is not significant except for Fe, FeS and Si condensed in the Fe–Si–S layer where the gas density is substantially lower than that in the ejecta of C20 (see Fig. 2). The average radii of dust grains formed in the unmixed ejecta are limited to less than 1 m.
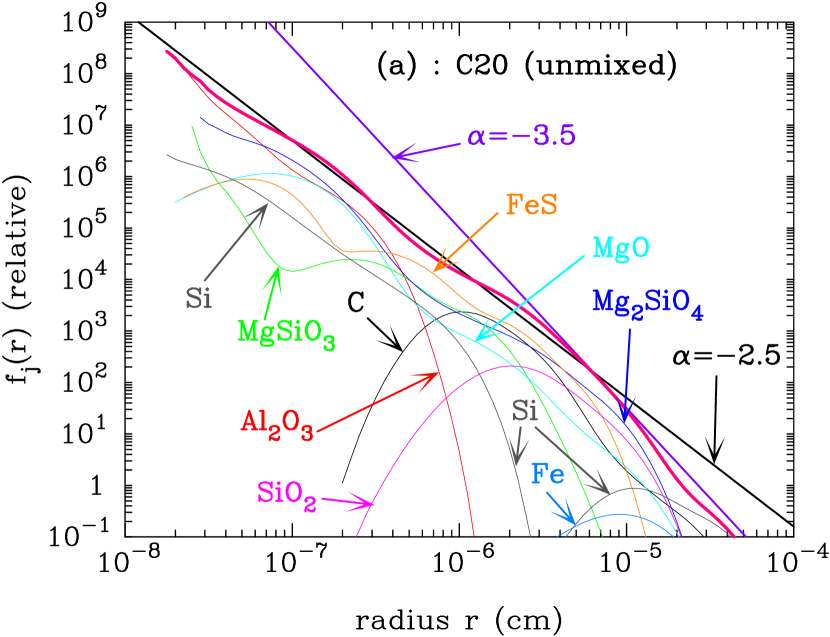
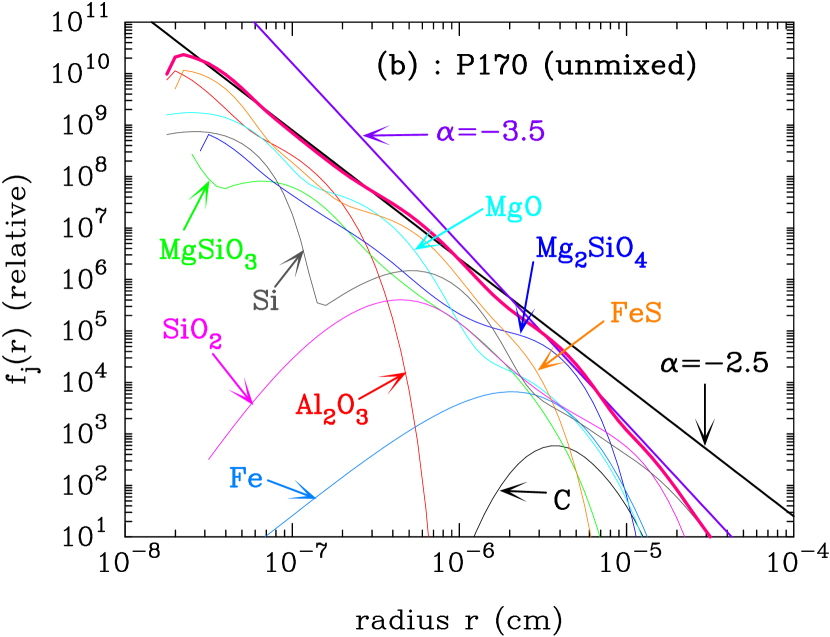
The size distrubution functions of newly formed grains in the ejecta of C20 and P170 are given in Figs. 8a and 8b, respectively. As is shown in 4.1, the size distribution function at a location is approximately log–nomal for a grain species with the average radius larger than 0.01 m. However, the size distribution function of a grain species summed up over the formation region does not keep the original shape at the formation site, reflecting the difference of the elemental composition and the gas density in the formation region. Generally, for a grain species whose formation region is wide–spreaded in the ejecta and whose average radius spans more than one order of magnitude, the size distribution function completely deviates from the original log–normal shape, which is true for MgO, Mg2SiO4, MgSiO3 and FeS grains. Although the average size of carbon grains ranges from 0.01 to 0.4 m, the size distribution function looks like log–normal because the large grains formed in the innermost region of He–layer do not contribute to the size distribution function due to the small number compared with the small grains condensed in the outer He–layer. The size distribution functions of SiO2 and Fe in the ejecta are approximately log–normal. Si grain shows a bimordial distribution function with large grains condensed inside the Si–S–Fe layer and smaller ones condensed around the interface between the He–layer and the O–Mg–Si layer. In the ejecta of P170, the behavior of the summed up size distribution function of each grain species is the same as that in the ejecta of C20. However, in the ejecta of P170, the bimordiality of Si stems from the wide span of the average radius arising from the density variation within the Fe–Si–S layer.
The size distribtion function summed up over all grain species formed within the He–core is drawn by the thick curve in Figure 8. The thick straight lines represent power–law formulae with the index of and . As can be seen from Fig. 8, in the both cases, the size distribution summed up over all grain species is well fitted with a power–law formula whose index is for the larger size and for smaller one, which is different from the conventional MRN size distribution function (Mathis, Rumpl, & Nordsieck 1977) used in the astrophysical literatures. The radius at the crossover point is 0.06 m for C20 and 0.02 m for P170. Although in this subsection only one model for CCSNe and PISNe is presented, respectively, the behaviors of dust formation and the average size as well as the size distribution function described above are almost the same for the other models, being not dependent on the progenitor mass.
4.3 The dust formation in uniformly mixed ejecta of CCSNe and PISNe
This subsection presents the results of the dust formation calculations in the ejecta with the elemental composition uniformly mixed within the He–core as a extreme case. In the calculations we assume the density structure in the ejecta is not affected by the mixing, since the numerical simulation suggested that the Rayleigh–Taylor instability produces the clumpy structure but the gas density does not so much change on average (Hachisu et al. 1990).
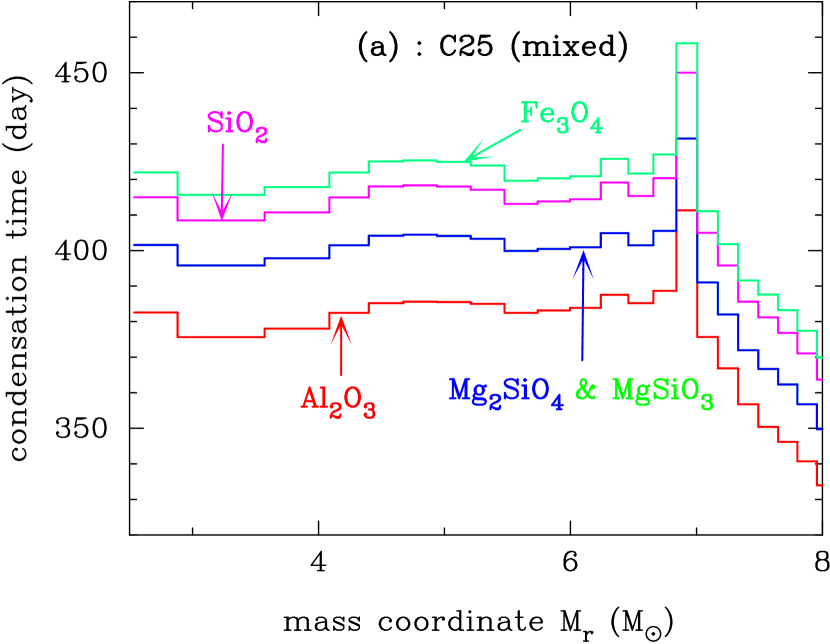
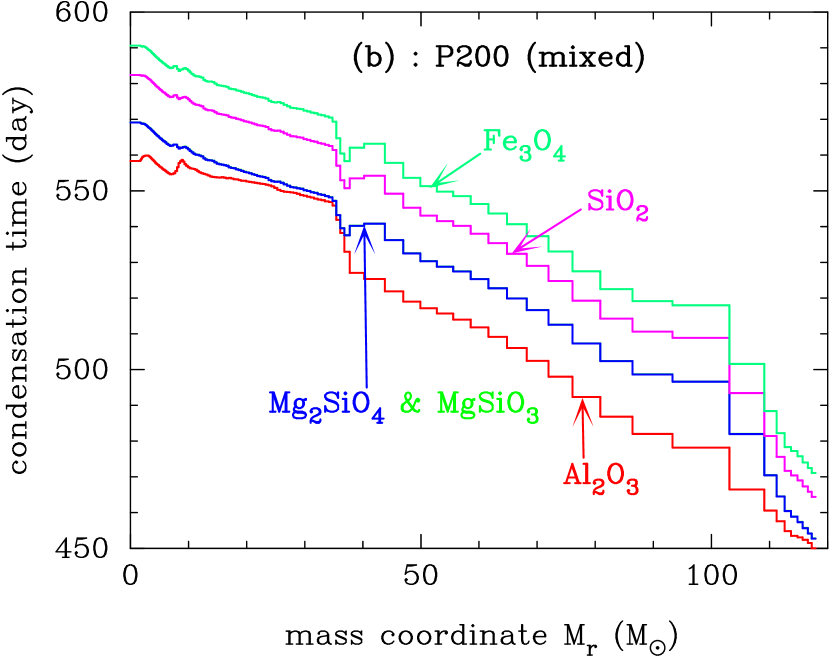
Under the assumption that formation of CO molecules is complete, only oxide grains condense in the uniformly mixed ejecta because the ejecta is oxygen–rich. Figure 9 shows the condensation time of each grain species formed in the ejecta; Fig. 9a for C25 and Fig. 9b for P200. In the both models, Al2O3, Mg–silicates (Mg2SiO4 and MgSiO3), SiO2 and Fe3O4 grains condense in this order. Being different from the unmixed ejecta, no MgO grain condenses because of Si Mg in the uniformly mixed ejecta, and all iron atoms are locked into Fe3O4 grains. Except for the inner– and outermost region of P200, the condensation temperature of each dust grains is almost the same within the He–core; 1550–1600 K for Al2O3, 1450 K for Mg–silicates, 1350 K for SiO2 and 1300–1350 K for Fe3O4.
In the ejecta of C25, the gas temperature decreases faster in the outer region than in the inner region of 6.8 where the gas temperature at a time is almost the same. Thus, well reflecting the temperature structure in the ejecta, in the ejecta of C25, Al2O3 grains start to condense at day 330 in the outer edge of He–core after the explosion, Mg–silicate grains at day 350, SiO2 grains at day 364, and Fe3O4 at day 370. In the region of 6.8 , each grain species condenses at almost the same time; Al2O3 around day 385, Mg–silicates around day 400, SiO2 around day 415 and Fe3O4 around day 420. Being different from the formation of dust grains in the unmixed ejecta, all dust grains condense within 100 days after the onset of dust formation. On the other hand, in the ejecta of P200, the condensation time of each grain species increases with decreasing the mass coordinate because the gas density gradually decreases with decreasing ; Al2O3 grains from day 450 up to day 560, Mg–silicate grains from day 450 up to 570, SiO2 grains from day 465 up to day 583, and Fe3O4 grains from day 470 to day 590. In the ejecta of P200, the condensation times of dust grains are about 150 days later than those in the ejecta of C25 since the gas temperature at a given time is higher than that of C25.
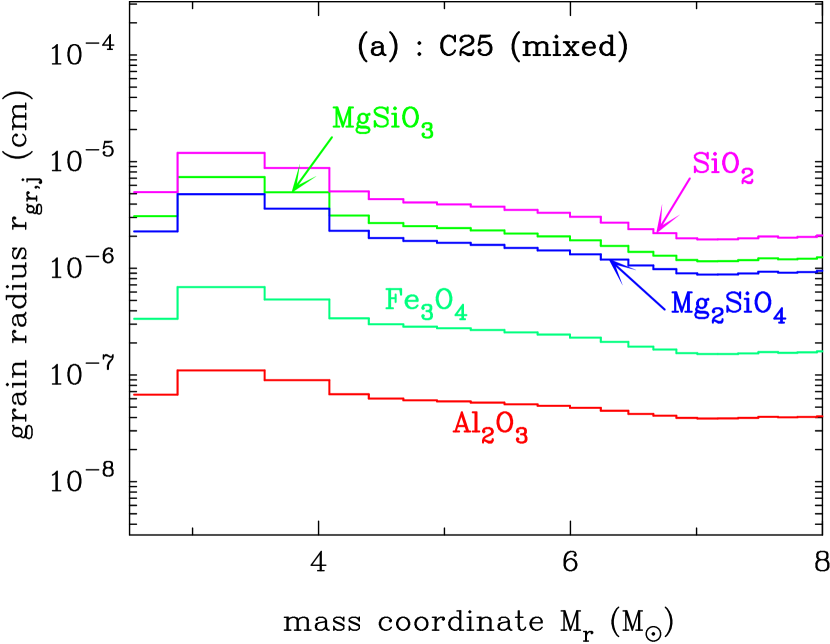
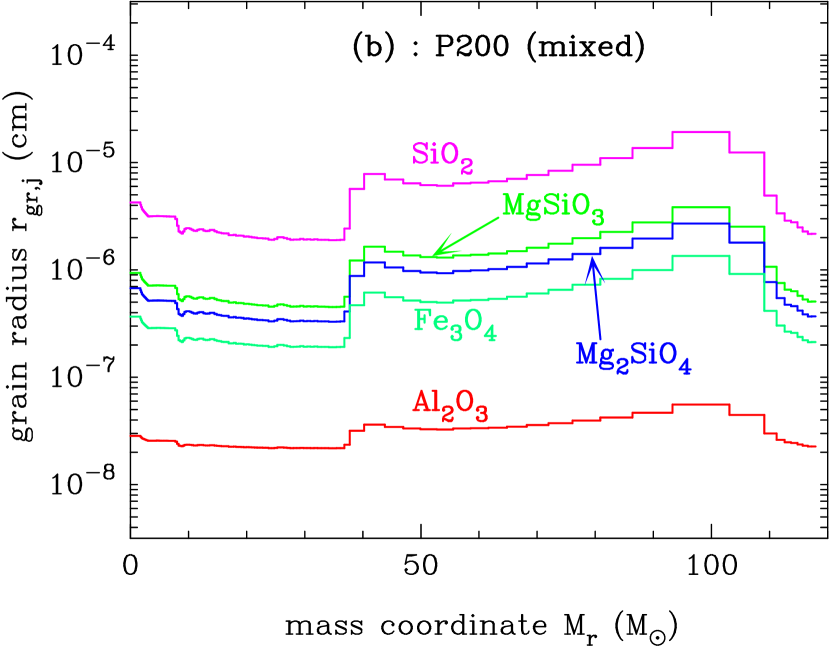
As are shown in Fig. 10a for C25 and Fig. 10b for P200, the range of average radius of each grain species spans less than one order of magnitude throughout the He–core. Given the same elemental composition within the He–core, the average radius depends on not only the density structure of gas but also the time evolution of gas temperature; in the outer region of the He–core, the gas density is lower than that in the inner region, but the gas temperature decreases faster in the outer region, which compensates the decrease of gas density at the condensation time. In the inner region of P200, the gas temperature is almost the same being independent of and the variation of the gas density is less than one order of magnitude. In the mixed ejecta of C25, the average radii of SiO2 and Mg–silicates are a few hundredth m with the maximum 0.1 m for SiO2, 0.05 m for Mg2SiO4 and 0.07 m for MgSiO3. The average radii of Fe3O4 and Al2O3 are small; several tens for Fe3O4 and a several for Al2O3 which are consistent with the results by Todini and Ferrara (2001). Despite that the gas temperature in the mixed ejecta of P200 is higher than that of C25, the average radius of each grain species formed in the region of 40 is almost the same as that in the ejecta of C25, because abundance of the key species of dust grains is a few times larger in P200 than in C25. The low density in the region of 40 of P200 (see Fig. 2b) results in the smaller average radius for each grain species.
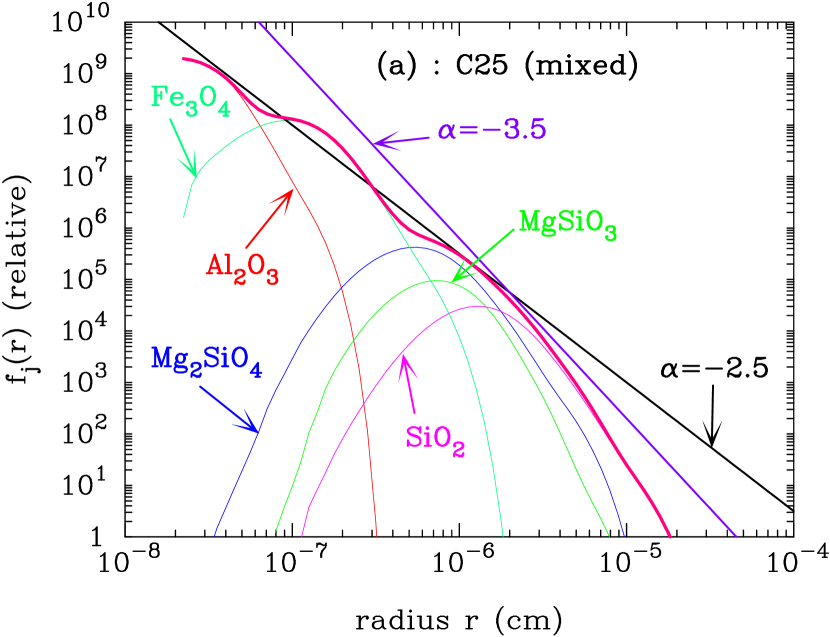
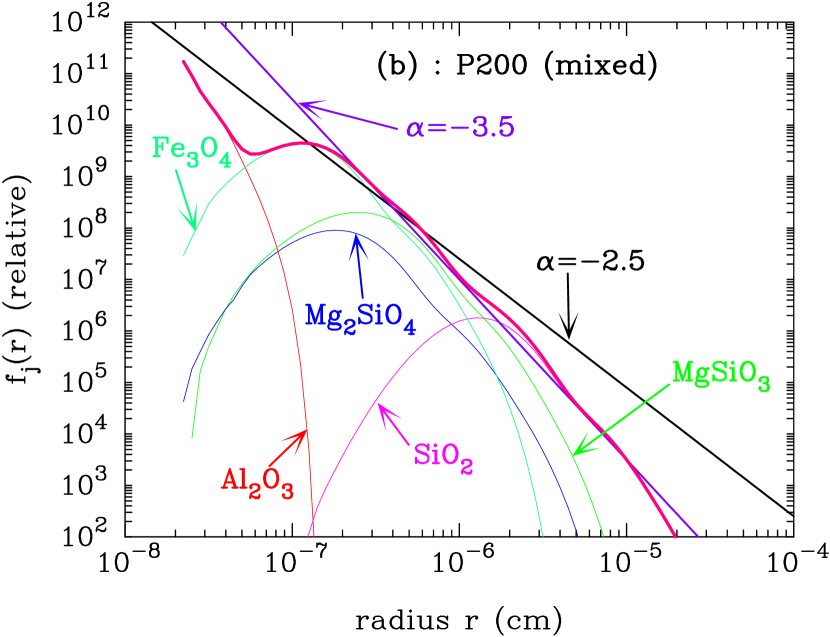
Figure 11 shows the size distribution function of each dust grains formed in the mixed ejecta; Fig. 11a for C25 and Fig. 11b for P200. Except for Al2O3 grains with very small average radius, in the both models, the size distribution functions of Mg2SiO4, MgSiO3, SiO2 and Fe3O4 grains approximately tend to be log–normal because of the narrow size range of each grain species. The size distribution function summed up over all grain species is also fitted with a power–law formula, whose index is for radius larger than 0.004 m in P200 and for radius smaller than 0.02 m in C25. The deviation from the power–law formula is distinctive for the larger size in the model of C25, because only SiO2 grain with the log–normal distribution function contributes to the larger size. However, this is an untypical case for the behavior of the summed up size distribution function. Here it should be addressed that, irrespective of the progenitor mass, the size distribution function summed up over all grain species newly formed in the ejecta with and without mixing is approximated by power–law distribution whose index is for larger radius and for smaller one, although the radius at the crossover point depends on the model of supernovae with the range from 0.004 to 0.1 m.
4.4 The amount of freshly formed dust grains
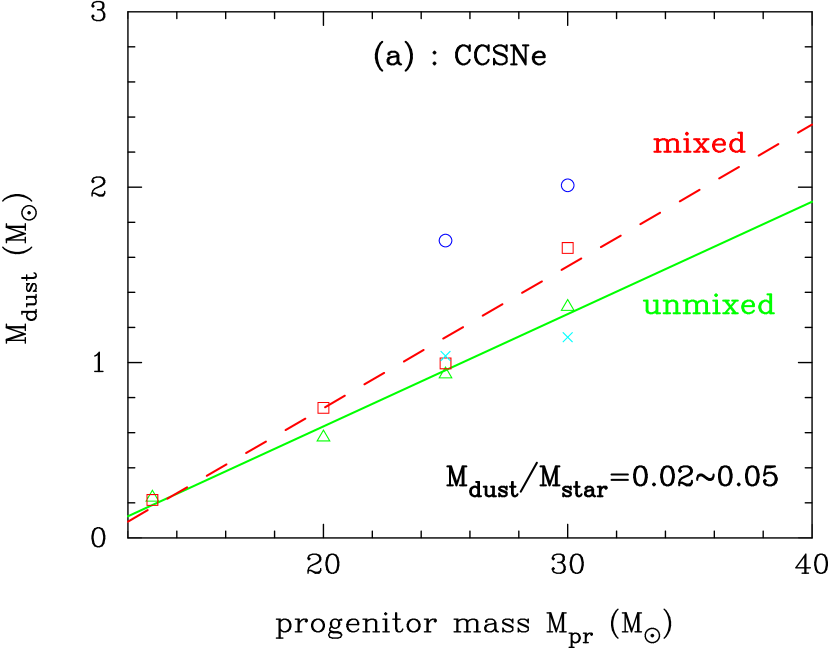
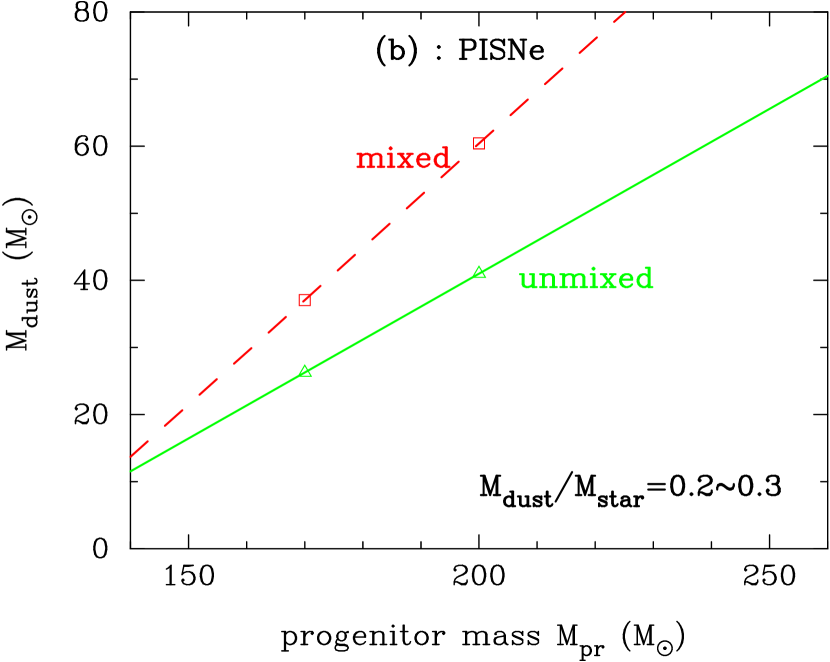
Figure 12 shows the total mass of dust grains produced in the ejecta versus the progenitor mass; Fig. 12a for CCSNe and Fig. 12b for PISNe, where open triangle denotes the results of calculations for the unmixed ejecta and open square for the mixed ejecta. In Fig. 12a, for a reference, the results of calculations in the unmixed ejecta of HNe are also plotted by cross for H25A and H30A, and open circle for H25B and H30B. The straight lines in Fig. 12a and in Fig. 12b are the linear least squares’ fits to the calculated mass for ordinary CCSNe and linearly connect the two data points for PISNe, respectively; solid line for the unmixed ejecta and dashed line for the mixed ejecta.
The total mass of newly formed grains increases with increasing the progenitor mass in the both unmixed and mixed ejecta of CCSNe and PISNe. In the unmixed ejecta of ordinary CCSNe, the total dust mass is 0.57 for C20 and 1.32 for C30. It is generally expected that the amount of dust grains is more in the mixed ejecta than in the unmixed ejecta because much more oxygen atoms are locked into dust grains in the mixed ejecta. However, in the mixed ejecta of C13, the total mass of dust grains is 0.22 and is a little smaller than the dust mass 0.23 in the unmixed ejecta. The reason is that in the mixed ejecta of C13, formation of CO molecules consuming the oxygen atoms available for oxide grains limits the amount of oxide grains; in this case, a small amount of Si and FeS grains condense instead of SiO2 and Fe3O4 grains. Also in the model of C25, the dust mass in the mixed ejecta is not so much different compared with that in the unmixed ejecta, because in the model of C25 the He–layer massive compared with other CCSNe somehow depresses the increase in the amount of mass available for formation of oxide grains within the oxygen–rich layer.
In the unmixed ejecta of hypernovae with the same 0.07 as CCSNe, H25A and H30A produce almost the same dust mass as C25 and C30, respectively. On the other hand, with a deep mass cut corresponding to 0.7 , H25B and H30B produce the dust grains about 0.7 larger than C25 and C30, respectively. In the ejecta of the CCSNe except for the model of H25 and H30, the ratio of dust mass to the progenitor mass is 0.02–0.05, which increases with increasing the progenitor mass. Although the total mass of newly formed grains depends on the detailed elemental composition in the ejecta as well as the position of mass cut, in general, the total mass produced in the mixed ejecta becomes larger than that in the unmixed ejecta with increasing .
PISNe, for which the progenitor is very massive and is completely disrupted, produce much more dust grains than CCSNe. For the model P200, the total mass of newly formed grains is 40 in the unmixed ejecta and 60 in the mixed ejecta. The mass ratio of newly formed grains to the progenitor mass for PISNe reaches to 0.15–0.3 at least, and the ratio increases with increasing the progenitor mass. Therefore, in the early universe, much more dust grains could be produced and be injected into interstellar space if the very massive stars populate the first generation stars.
4.5 The mass yield of each grain species
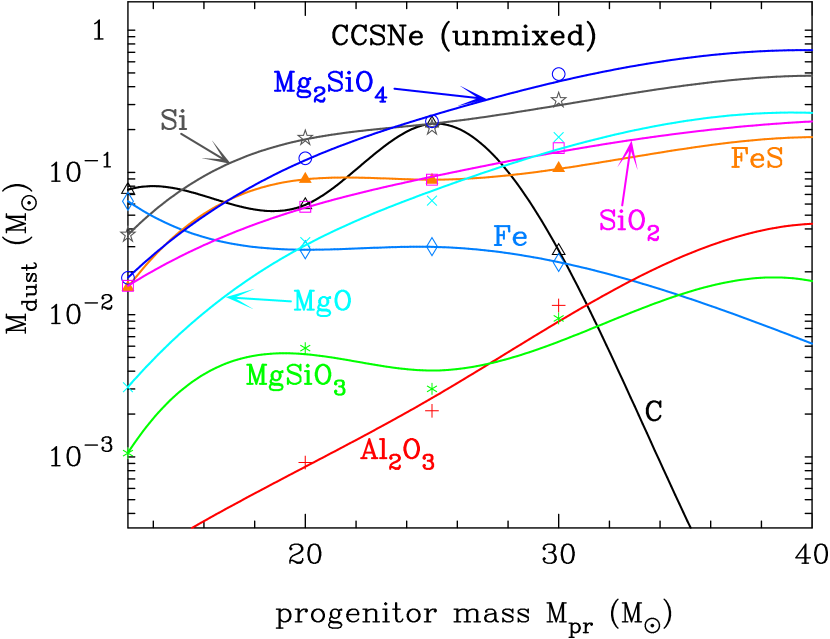
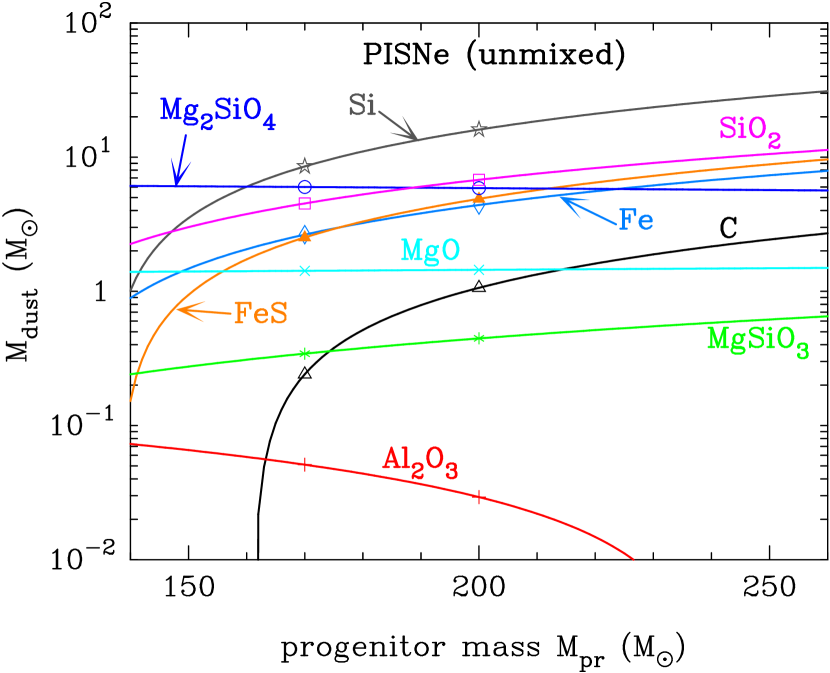
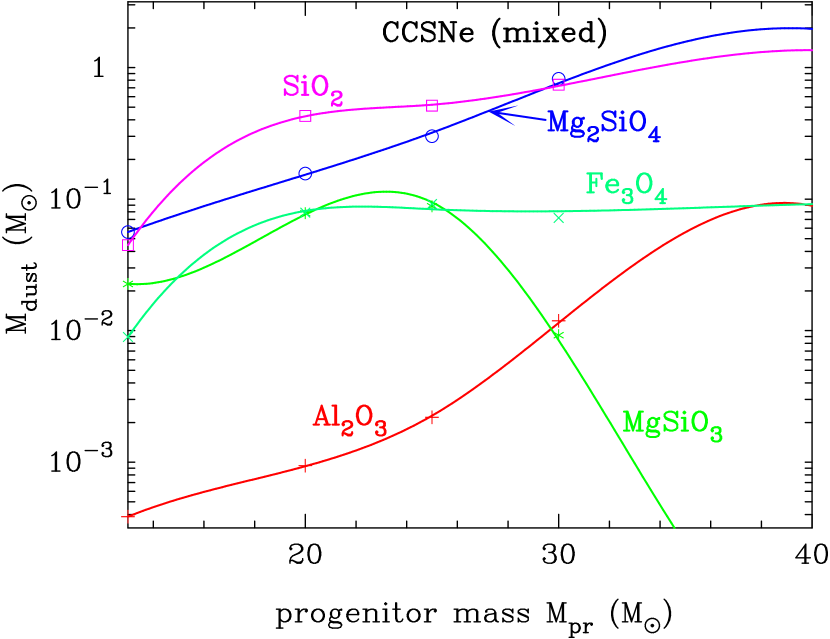
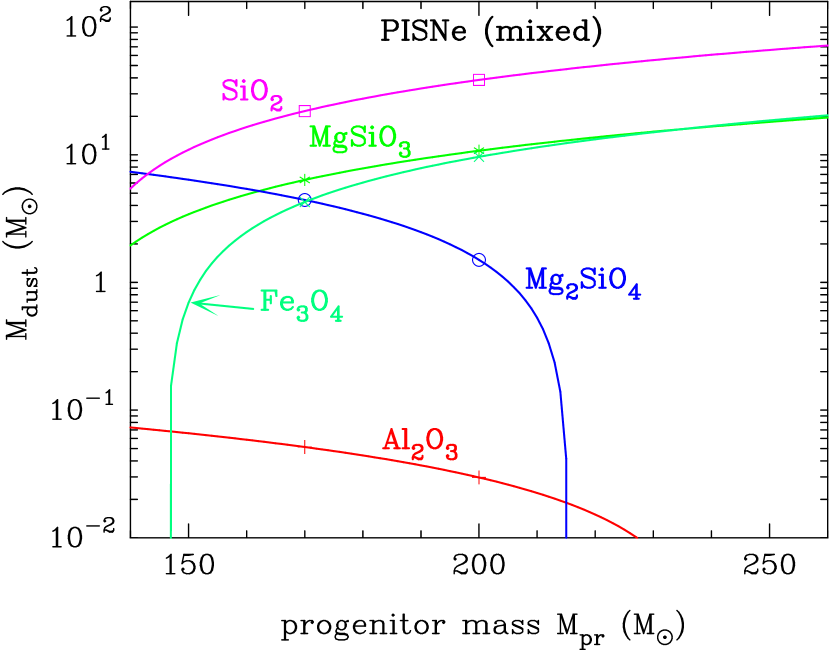
Figures 13 and 14 present the mass yield of each grain species versus the progenitor mass in the unmixed ejecta and the mixed ejecta, respectively; Figs. 13a and 14a for CCSNe, and Figs. 13b and 14b for PISNe. In the figures, the smooth curves are the least squares’ spline fits to the calculated values for CCSNe and are the straight lines connecting the two calculated values in linear scale for PISNe. Thus for PISNe, the mass yield for a given progenitor mass should be taken as a nominal value.
In the unmixed ejecta of CCSNe (Fig. 13a), with increasing , the mass yield of carbon grains, apart from the small fluctuation, somehow increases up to around 25 , and then decreases, while the yields of other grain species except for Fe grain increase. The grain species contributing to the total dust mass heavily depend on the progenitor mass for 28 ; in the ejecta with 15 , the major grain species in mass are carbon, Fe and Si grains with the average radius 0.1 m. With increasing , the masses of the oxygen–rich layer as well as of the Si–S–Fe layer increase. Therefore, the yields of Si and Mg2SiO4 increase, and also the mass of FeS increases together with decreasing the mass of Fe. Around 20 , Mg2SiO4, Si and FeS grains tend to dominate the mass abundance. Around 25 , the major grain species are Mg2SiO4, Si and C grains. The mass abundances of FeS, SiO2 and MgO grains are larger than that of carbon grain for 28 , and Mg2SiO4 and Si are the major grain species followed by MgO, SiO2 and FeS grains. Although the masses of Al2O3 and MgSiO3 grains increase with , their mass fractions are limited to less than 10-2.
The masses of Mg2SiO4 and MgO grains per supernova are almost constant in the unmixed ejecta of PISNe, being almost independent of the progenitor mass (see Fig. 13b); (Mg2SiO4) 6 and slightly decreases with increasing , and (MgO) 1.4 . When the progenitor mass is smaller than 160 , Mg2SiO4, Si, and SiO2 grains are the major grain species contributing to the total mass. In contrast to the unmixed ejecta of CCSNe, the mass fraction of carbon grain is to be less than 5 10-2 although the mass of carbon grains increases with increasing . It should be noted here that for 160 , the most abundant grain species in the unmixed ejecta of PISNe is Si grain followed by SiO2 grains, because the masses of the Si–S–Fe layer and the O–Si–Mg layer increase with increasing . Also the mass fractions of iron–bearing grains (Fe and FeS) produced within the Si–S–Fe layer are larger than that of Mg2SiO4 grains for 220 .
In the mixed ejecta of CCSNe (see Fig. 14a), SiO2 and Mg2SiO4 grains mainly contribute to the total dust mass for 15 . The mass of Fe3O4 for 20 is 0.09 , being almost independent of the progenitor mass. With increasing , the mass of Mg2SiO4 increases and reaches to the same as that of SiO2 at 30 . The dust mass of massive CCSNe with 25 is dominated by SiO2 and Mg2SiO4 grains. Although the yield of Al2O3 increases with increasing and tends to be the same mass as Fe3O4, the mass fraction of Fe3O4 is limited to less than 0.1 for 20 and that of Al2O3 is limited to less than 0.02 at most. In the mixed ejecta of PISNe (see Fig. 14b), SiO2 is the most abundant grain, regardless of the progenitor mass. As is the same as the mixed ejecta of CCSNe, around the low–mass end of the progenitor mass of PISNe, SiO2 and Mg2SiO4 contribute to the total mass. As the progenitor mass increases, the masses of MgSiO3 and Fe3O4 increase and approach to the almost the same mass, while the amount of Mg2SiO4 decreases. The total mass of dust grains is dominated by SiO2, MgSiO3 and Fe3O4 whose mass fractions are 0.7, 0.15 and 0.15, respectively.
5 Summary
We investigated the dust formation in the ejecta of population III core collapse and pair–instability supernovae, employing the hydrodynamical models and the results of nucleosynthesis calculations by Umeda and Nomoto (2002). The time evolution of gas temperature in the ejecta is calculated by solving the radiative transfer equation together with the energy equation taking into account of the energy deposition from radio active elements. Two extreme cases are considered for the elemental composition within the He–core; the unmixed case and the uniformly mixed case. In order to clarify what kind of grain species condenses in the ejecta, formation of all possible condensates is calculated simultaneously by applying a theory of non–steady state nucleation and grain growth under the assumption of complete formation of CO and SiO molecules. The results of the calculations are summarized as follows;
(1) The species of newly formed dust grains are affected by the elemental composition in the ejecta. In the unmixed ejecta, a variety of grain species condense corresponding to the elemental composition at the formation site; C and Si grains in the He–layer, Al2O3, Mg2SiO4 and MgSiO3 grains in the oxygen–rich layer (O–Mg–Si and O–Si–Mg layers), MgO grain in the O–Mg–Si layer, SiO2 grain in the O–Si–Mg layer, Si and FeS grains in the Si–S–Fe layer and Fe grain in the Fe–Si–S layer. On the other hand, only oxide grains such as Al2O3, Mg2SiO4, MgSiO3, SiO2 and Fe3O4 condense in the mixed ejecta. The main species of newly formed grains do not depend on the progenitor mass.
(2) The average size of newly formed dust grains strongly depends on the concentration of the key species at the condensation time as well as at the formation site. In the unmixed ejecta, the range of average radius of each grain species spans a few orders of magnitude, depending on the grain species and the formation region. On the other hand, in the mixed ejecta, the average radius of each grain species is almost the same order of magnitude in the entire region within the He–core, reflecting the uniform elemental composition. The average radius of each grain species in both the unmixed and the mixed ejecta does not strongly depend on the progenitor mass and the explosion energy, but is affected by the amount of 56Ni in the ejecta. No dust grain condenses with the average radius larger than 1 m in the ejecta of population III supernovae considered in this paper.
(3) The size distribution function of a grain species condensed at a location in the ejecta is almost log–normal so far as the average radius is larger than 0.01 m. The size distribution function summed up within the He–core is log–normal for carbon, Fe and SiO2 grains condensed in the narrow confined region of the unmixed ejecta, otherwise in the mixed ejecta, except for Al2O3 grain, the summed up size distribution function is log–normal. The size distribution function summed up over all grain species is approximated by a power–law formula with the index of for the larger radius and for the smaller one, which is true for the unmixed and the mixed cases, being almost independent of the progenitor mass; the radius at the crossover point ranges from 0.004 to 0.1 m, depending on the model of supernovae.
(4) The total mass of newly formed dust grains increases with increasing the progenitor mass and is generally much more in the mixed case than in the unmixed case. The total mass of dust grains is 2–5 % of the progenitor mass for CCSNe with 13 40 , and 15–30 % of the progenitor mass for PISNe with 140 260 .111After submitting this paper to ApJ on 28 June 2003, we have received a preprint from Dr. A. Ferrara, who obtained basically similar results for the mass of dust produced per PISN as ours. Thus, if PISNe populate the early universe, a large amount of dust grains would be injected into the primordial interstellar medium.
(5) The mass yield of each grain species depends on the progenitor mass. C, Fe and Si grains are the major grains species in the unmixed ejecta of CCSNe with 15 . With increasing , Si and Mg2SiO4 grains are getting dominant, and Mg2SiO4 grains is the most abundant for 24 . In the unmixed ejecta of PISNe, the most abundant grain is Mg2SiO4 for 160 , otherwise for 160 the most abundant grain is Si followed by Mg2SiO4, SiO2, FeS, and Fe grains. In the mixed ejecta of CCSNe, SiO2 and/or Mg2SiO4 grains are the major grain species contributing to the total mass. Being independent of the progenitor mass, in the mixed ejecta of PISNe, SiO2 grain is the most abundant species, which is followed by Mg2SiO4 grains for 160 and by MgSiO3 and Fe3O4 grains for 170 .
In the calculations, we treat only the formation of homogeneous grains taking into account of the chemical reaction at the condensation but do not consider the possibility for the heterogeneous nucleation on the surface of pre–condensed grains. In fact, the heterogeneous grains consisting of metal–carbide cores and a graphite mantle have been observed in the Murchison meteorite (Bernatowicz et al. 1991, 1996). Also we must consider the possibility of the formation of composite grains such as Fe–Ni–Cr alloy to reveal whether the metal elements of Ni, Co and Cr with relatively small abundance are locked into dust grains in the ejecta of supernovae or not. Also as is discussed in Appendix B, it is very important to investigate the effect of the formation efficiency of CO and SiO molecules on the formation of dust grains in order to clarify what kind of dust grains really condenses in the ejecta of supernovae. These subjects are left for the future work.
Anyway, dust grains in the early universe play a critical role on formation and evolution history of stars and galaxies. The investigation of the nature of dust grains in the early universe is essential not only to investigate the evolution and the structure of the early universe but also to deduce the SFR and the IMF during the evolution of the universe from the relevant observations, because how much dust grains absorb stellar light and re–emit it by thermal radiation depends on the chemical composition, the size distribution and the amount of dust grains residing in interstellar space in galaxies and in intergalactic medium. The evolution of dust grains is determined by the balance between the production in the ejecta of supernovae and the destruction by the interstellar shock as well as the reverse shock penetrating into the ejecta. The efficiency of destruction by shock depends on the chemical composition and the size of dust grains. Therefore, the results of the calculations presented in this paper can be used as the basis to investigate the evolution of dust grains in the early universe.
Appendix A The dust formation in the ejecta of hypernovae
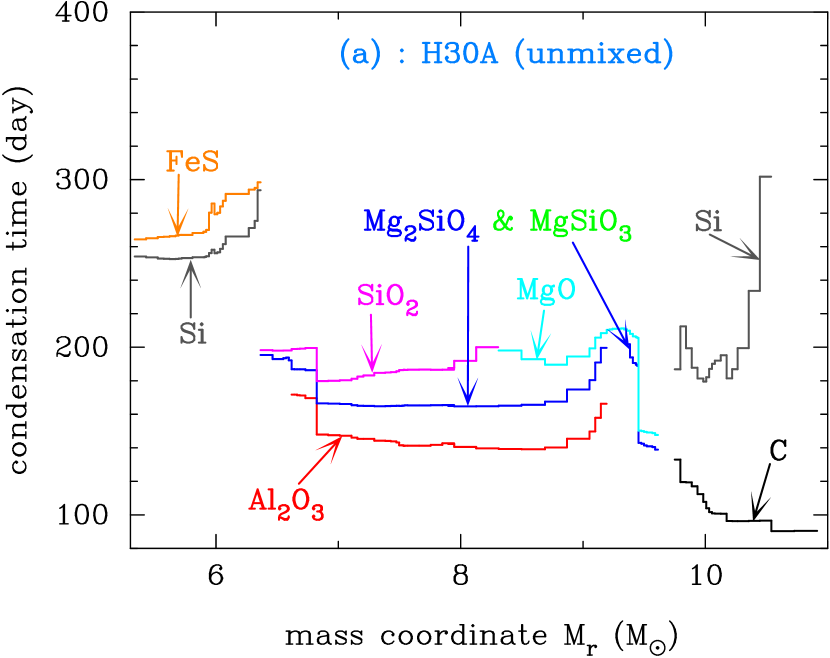
The hypernovae with the explosion energy larger than 1052 erg are proposed to reproduce the behavior of observed early light curve of SN 1998bw (Iwamoto et al. 1998; Woosley, Eastman, & Schmidt 1999). Also the analysis of the light curve of SN 1998bw (Nakamura et al. 2001) concluded that the mass of 56Ni in the ejecta is 0.4 , which is larger than a typical value of 0.07 in the ejecta of ordinary CCSNe. Furthermore, Umeda and Nomoto (2002) have claimed that the primordial hypernovae well reproduce the observed elemental composition in the metal–poor stars; [Zn/Fe] increasing with decreasing [Fe/H] for [Fe/H] (Primas et al. 2000). In this Appendix, we shall perform the calculations of dust formation in the ejecta of population III hypernovae to investigate the effect of the explosion energy as well as the amount of 56Ni in the ejecta on the dust formation. We consider two model; one is H30A with 30 , erg and 0.07 , and another is H30B for which and are the same as H30A but 0.7 .
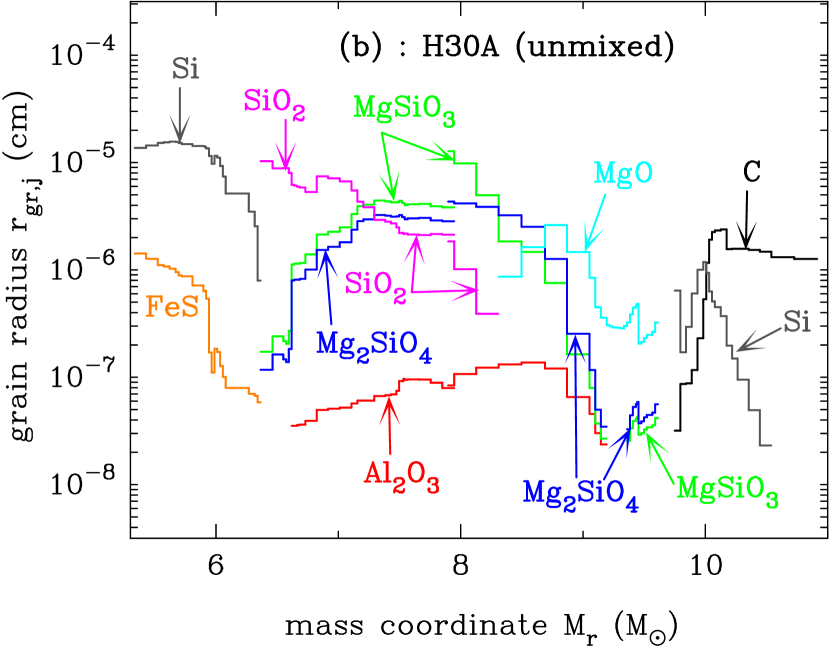
Fig. 15a shows the condensation time of each dust grains in the unmixed ejecta of H30A with the explosion energy 30 times but as same as ordinary CCSNe. The grain species formed in the ejecta and their condensation sequence are almost the same as CCSNe and PISNe, except for Fe; the reason is that in this model with the explosion energy 3 erg, the innermost Fe–Si–S layer is not ejected because of a shallow mass cut caused by adjusting in the ejecta to 0.07 . The condensation time of each grain species is about 200 days earlier than CCSNe, because the gas temperature quickly decreases due to the high expansion velocity and the low gas density in the ejecta. However, as can be seen from Fig. 15b, the average radius of each dust grains formed in the ejecta is almost the same as that in the ejecta of CCSNe, because the early condensation time compensates the decrease of gas density at the condensation time.
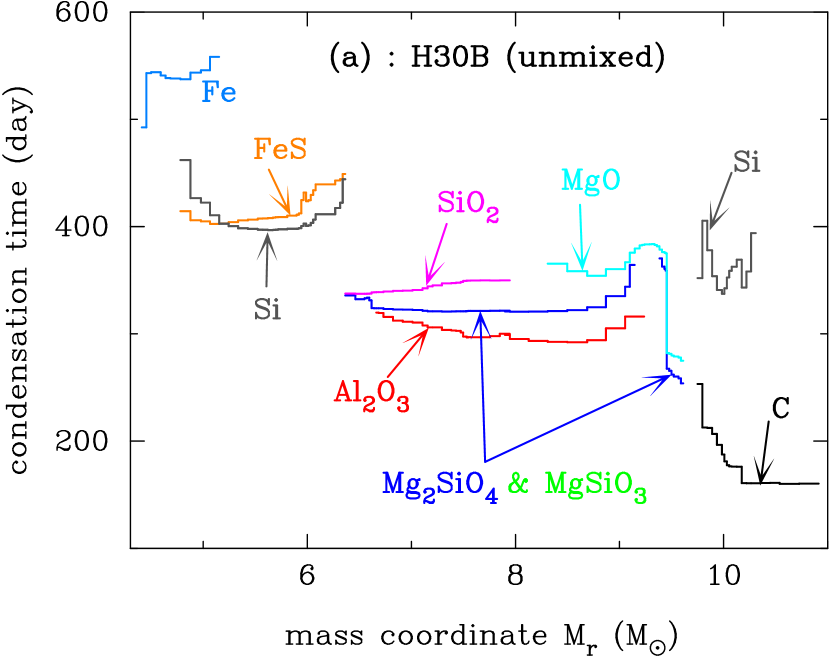
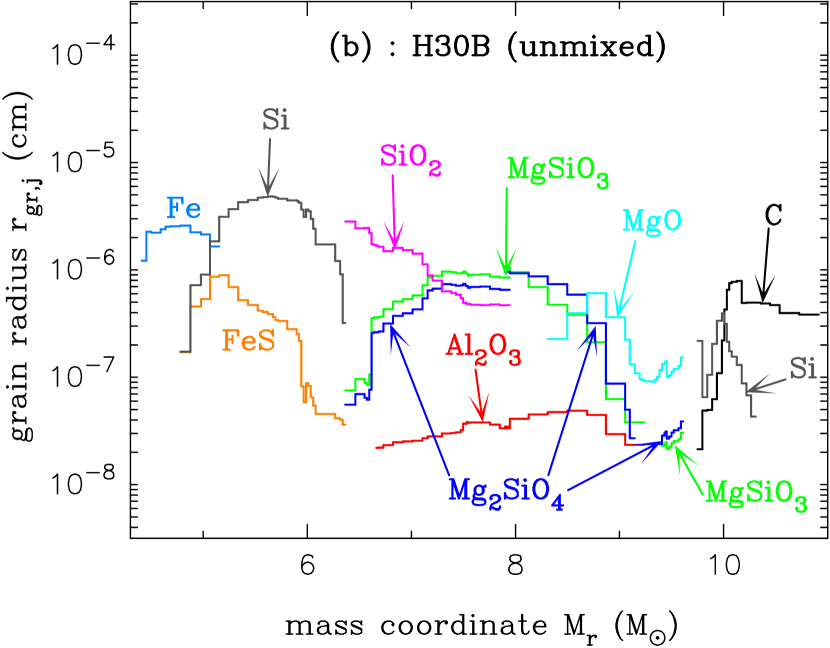
With 0.7 and the higher gas temperature at a time than H30A, as is shown in Fig. 16a, the condensation time of each grains species in the ejecta of H30B is about 150 days later than that of H30A. Therefore, the average radii of dust grains formed in the ejecta are a factor 4–10 smaller than those of H30A (see Fig. 16b), depending on the concentration of key species at the formation site. In contrast to H30A, iron grain condenses in the innermost Fe–Si–S layer, reflecting the deep mass cut at 4.33 .
From the results of calculations, we can conclude here that the explosion energy as well as the amount of 56Ni in the ejecta strongly affects the formation of dust grains in the ejecta. In the ejecta with a fixed amount of 56Ni, the higher explosion energy results in the early condensation time because the gas temperature quickly decreases due to the low gas density. However, the average radius of dust grain is not heavily affected because the early condensation time compensates the decrease of gas density at the formation site. On the other hand, the mass of 56Ni in the ejecta strongly affects the average radius of dust grains formed in the ejecta with the same explosion energy. With increasing , the more delayed condensation time decreases the concentration of key species at the site of dust formation, which results in the smaller size of dust grains. Finally it should be pointed out here that the amount of 56Ni in the ejecta also affects the total mass of dust grains formed in the ejecta as is depicted in Fig. 13a; a large amount of 56Ni in the ejecta with a deep mass cut for a fixed progenitor mass result in the large mass in the ejecta as well as the large total mass of dust grains, and vice versa.
Appendix B The effect of formation efficiency of CO and SiO molecules on dust formation
In the calculations of dust formation, we assumed the complete formation of CO and SiO molecules. The formation of CO and SiO molecules prior to the dust formation was observed in SN 1987A (e.g., Bouchet & Danziger 1993). Furthermore, the recent observations have suggested that formation of CO molecules is a common phenomenon in the ejecta of CCSNe (e.g., Gerardy et al. 2002). Formation of CO and SiO molecules is usually considered to be complete and controls the chemistry in the astrophysical environments of interest to dust formation such as in the circumstellar envelopes of AGB star. However, in the ejecta of supernovae, these molecules are destroyed by the collisions with high energy electrons as well as with ionized inert gaseous atoms produced by the decay of radio active elements, and the abundance of these molecules is determined by the balance between formation and destruction (Liu & Dalgarno 1994, 1996). Thus, in the ejecta of supernovae, for an example, it is expected that free carbon atoms are available for formation of carbon–bearing dust grains even in the ejecta of C/O 1. This aspect has been extensively pursued by Clayton, Liu, & Dalgarno (1999) and Clayton, Deneault, & Meyer (2001) to investigate the origin of presolar grains identified as SUNOCONs. The abundances of CO and SiO molecules depend on the abundance of free electrons as well as ionized inert gas. Thus, in this Appendix, to simplify the calculations, we investigate the effect of the formation efficiency of CO and SiO molecules on the dust formation, by referring to the formation efficiency of CO and SiO molecules observed in SN 1987A as a template and introducing the parameters and which represent the mass fractions of C and Si atoms not locked into CO and SiO molecules, respectively.
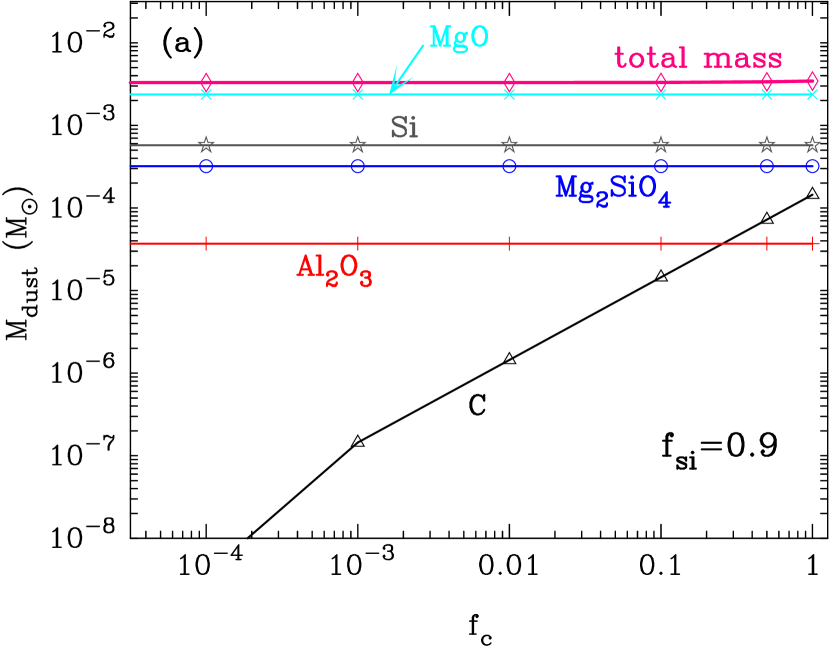
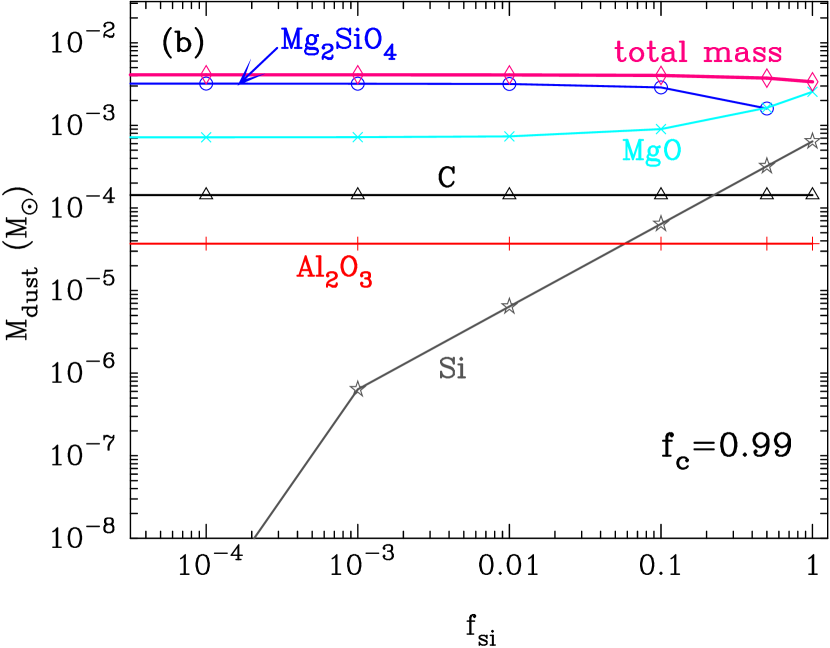
In the ejecta of SN 1987A, the masses of CO and SiO molecules have been evaluated to be 3–6 and 0.4–1 , respectively, during 300 to 600 days after the explosion (Liu & Dalgarno 1994, 1995), which correspond to and in the oxygen–rich core. The mass fractions and being fixed, respectively, Figs. 17a and 17b show the mass of newly formed grain species versus and at the location of 3.5 in the O–Mg–Si layer of C20. In the calculations, we consider SiO molecule is the key species for formation of Mg–silicate grains. Of course, formation of Al2O3 grain is not affected by the formation efficiency of these molecules. The mass of C and Si grains increases with increasing . As can be seen from Fig. 17a, except for the formation of carbon grains, formation efficiency of CO molecules does not influence the formation of other grain species. Also the formation of carbon grains does not affect the total mass of dust grains at this location since O and Mg atoms are much more abundant than C atoms (see Fig. 1a). The average size of carbon grains increases with increasing but is limited to less than 0.04 m even for . On the other hand, the formation efficiency of SiO molecules strongly affects the mass abundance of Si– and/or Mg–bearing grains; with increasing , the decrease of SiO molecules not only results in the formation of Si grains but also increases the mass of MgO grains with the reduction of mass of Mg2SiO4 grains, which is prominent for . The average radii of Si and MgO grains increase and reach to m with increaing , otherwise the average radius of Mg2SiO4 grain decreases. At this location, formation efficiency of CO and SiO molecule does not affect the total mass of dust grains because the abundance of C atom is two order of magnitude lower than that of O atom. However, if in the outer region of O–Mg–Si layer (4 for C20), much more carbon dust grains could condense and the average radius reach to 0.4 m m, depending on the abundance of carbon atom at the formation site.
Finally it should be addressed here that we cannot realize the formation of SiC grains with radius comparable to presolar SiC grains identified as SUNOCONs by changing the parameters and . Formation of SiC grains competes with the formation of carbon and silicon grains; carbon atoms available for formation of SiC grains are locked into carbon grains prior to formation of SiC grains, which is true for silicon atoms. This implies that the amount and size are very small even if SiC grains condense. Therefore, as proposed by Deneault, Clayton, & Heger (2003), a special condition and/or chemical passways might have to be considered in order to realize the formation of SiC grains identified as SUNOCONs.
Anyway, the result of calculation shows that the reduction of formation efficiency of CO and SiO moclules leads to the formation of C and Si grains. Furthermore, the formation efficiency of SiO molecules affects the abundance and the size of Si– and/or Mg–bearing grains. However we must keep in mind that in the calculations the stability of C and Si grains is not taken into account; in the environment with a lot of free oxygen atoms, C and Si grains could be easily oxidized if their sizes would be small, though Clayton, Deneault, & Meyer (2001) have claimed that carbon grain is stable against the oxidation in the oxygen–rich environment. Oxidation of Si grains produces SiO2 grains and/or evaporates SiO molecules available for formation of Mg–silicate grains, and it may be possible that another chemical passway leads to formation of Mg–silicate grains without SiO molecules, which results in the more oxide grains even if the formation efficiency is very low. These aspects should be pursued to clarify how much as well as what kind of oxide grains really forms in the ejecta of supernovae.
References
- amari (97) Amari, S., & Zinner, E. 1997, in AIP Conf. Proc. 402, Astrophysical Implications of the Laboratory Study of Presolar Materials, eds. T. J. Bernatowicz & E. Zinner (New York: AIP), 287
- Arendt, Dwek & Moseley (1999) Arendt, R. G., Dwek, E., & Moseley, S. H. 1999, ApJ, 521, 234
- arnet (89) Arnett, W. D., Bahcall, J. N., Kirshner, R. P., & Woosley, S. E. 1989, AAR&A, 27, 629
- Bernatowicz et al. (1991) Bernatowicz, T. J., Amari, S., Zinner, E., & Lewis, R. S. 1991, ApJ, 373, L73
- Bernatowicz et al. (1996) Bernatowicz, T. J., Cowsik, R., Gibbons, P. C., Lodders, K., Fegley, B., Jr., Amari, S., & Lewis, R. S. 1996, ApJ, 472, 760
- Boni & Derge (1956) Boni, R. E., & Derge, D. 1956, J. Metals, 8, 53
- Bouchet & Danziger (1993) Bouchet, P., & Danziger, I. J. 1993, A&A, 273, 451
- Bromm, Coppi & Larson (2002) Bromm, V., Coppi, P. S., & Larson, R. B. 2002, ApJ, 564, 23
- Chase et al. (1985) Chase, M. W., Davies, C. A., Downey, J. R., Frurip, D. J., McDonald, R. A., & Syverud, A. N. 1985, JANAF Thermochemical Tables 3d ed. (J. Phys. Chem. Ref. Data, 14, Suppl. 1)
- (10) Chigai, T., Yamamoto, T., & Kozasa, T. 1999, ApJ, 510, 999
- Christlieb et al. (2002) Christlieb, N., et al. 2002, Nature, 419, 904
- Clayton, Deneault & Meyer (2001) Clayton, D. D., Deneault, E. A.-N., & Meyer, B. S. 2001, ApJ, 562, 480
- Clayton, Liu & Dalgarno (1999) Clayton, D. D., Liu, W., & Dalgarno, A. 1999, Science, 283, 1290
- Colgan et al. (1994) Colgan, S. W. J., Haas, M. R., Erickson, E. F., Lord, S. D., & Hollenbach, D. 1994, ApJ, 427, 874
- Deneaul et al (2003) Deneault, E. A. -N., Clayton, D. D., & Heger, A. 2003, ApJ preprint doi:10.1086/376863
- Dotani et al. (1987) Dotani, T., Hayashida, K., Inoue, H., Itoh, M., & Koyama, K. 1987, Nature, 330, 230
- Douvion et al. (2001) Douvion, T., Lagage, P. O., Cesarsky, C. J., & Dwek, E. 2001, A&A, 373, 281
- Douvion, Lagage & Pantin (2001) Douvion, T., Lagage, P. O., & Pantin, E. 2001, A&A, 369, 589
- Drake et al. (2002) Drake, R. P., et al. 2002, ApJ, 564, 896
- Dunne et al. (2003) Dunne, L., Eales, S., Ivison, R., Morgan, H., & Edumnds, M. 2003, Nature, 424, 285
- Dwek (1998) Dwek, E. 1998, ApJ, 501, 643
- Dwek et al. (1987) Dwek, E., Hauser, M. G., Dinerstein, H. L., Gillett, F. C., & Rice, W. L. 1987, ApJ, 315, 571
- Elliott & Gleiser (1960) Elliott, J. F., & Gleiser, M. 1960, Thermochemistry for Steelmaking, Vol. 1. Addison-Wesley, Reading, MA.
- Elliott, Gleiser & Ramakrishna (1963) Elliott, J. F., Gleiser, M., & Ramakrishna, V. 1963, Thermochemistry for Steelmaking, Vol. 2. Addison-Wesley, Reading, MA.
- Elmhamdi et al. (2003) Elmhamdi, A., et al. 2003, MNRAS, 338, 939
- Fesen & Blair (1990) Fesen, R., & Blair, W. P. 1990, ApJ, 351, L45
- Gail, Keller & Sedlmayr (1984) Gail, H.-P., Keller, R., & Sedlmayr, E. 1984, A&A, 133, 320
- Gerardy et al. (2002) Gerardy, C. L., Fesen, R. A., Nomoto, K., Maeda, K., Hoflich, P., & Wheeler, J. C. 2002, PASJ, 54, 905
- Hachisu et al. (1990) Hachisu, I., Matsuda, T., Nomoto, K., & Shigeyama, T. 1990, ApJ, 358, L57
- Hasegawa & Kozasa (1988) Hasegawa, H., & Kozasa, T. 1988, Prog. Theor. Phys. Suppl., 96, 107
- Hauser & Dwek (2001) Hauser, M. G., & Dwek, E. 2001, ARA&A, 39, 249
- Heger & Woosley (2002) Heger, A., & Woosley, S. E. 2002, ApJ, 567, 532
- Hester et al. (1990) Hester, J. J., Graham, J. R., Beichman, C. A., & Gautier, T. N., III 1990, ApJ, 357, 539
- Hirashita & Ferrara (2002) Hirashita, H., & Ferrara, A. 2002, MNRAS, 337, 921
- Hirashita, Hunt & Ferrara (2002) Hirashita, H., Hunt, L. K., & Ferrara, A. 2002, MNRAS, 330, L19
- Itoh (87) Itoh, M., Kumagai, S., Shigeyama, T., Nomoto, K., & Nishimura, J. 1987, Nature, 330, 2331
- Iwamoto et al. (1998) Iwamoto, K., et al. 1998, Nature, 395, 672
- Iwamoto et al. (2000) Iwamoto, K., et al. 2000, ApJ, 534, 660
- Kozasa et al. (1996) Kozasa, T., Dorschner, J., Henning, T., & Stognienko, R. 1996, A&A, 307, 551
- Kozasa & Hasegawa (1987) Kozasa, T., & Hasegawa, H. 1987, Prog. Theor. Phys., 77, 1402
- Kozasa & Hasegawa (1988) ———. 1988, ICARUS, 73, 180
- Kozasa, Hasegawa & Nomoto (1989a) Kozasa, T., Hasegawa, H., & Nomoto, K. 1989a, ApJ, 344, 325
- Kozasa, Hasegawa & Nomoto (1989b) ———. 1989b, ApJ, 346, L81
- Kozasa, Hasegawa & Nomoto (1991) ———. 1991, A&A, 249, 474
- (45) Kumagai, S., Shigeyama, T., Nomoto, K., Itoh, M., & Nishimura, J. 1988, A&A, 197, L7
- Lagage et al. (1996) Lagage, P. O., et al. 1996, A&A, 315, L273
- Liu & Dalgarno (1994) Liu, W., & Dalgarno, A. 1994, ApJ, 428, 769
- Liu & Dalgarno (1995) ———. 1995, ApJ, 454, 472
- Liu & Dalgarno (1996) ———. 1996, ApJ, 471, 480
- Loeb & Haiman (1997) Loeb, A., & Haiman, Z. 1997, ApJ, 490, 571
- Lucy et al. (1989) Lucy, L. B., Danziger, I. J., Gouiffes, C., & Bouchet, P. 1989, in Structure and Dynamics of Interstellar Medium, IAU Colloq. No 120, eds. G. Tenorio-Tagle, M. Mole, & J. Melnick (Berlin : Springer), 350, 164
- Mathis et al. (1977) Mathis, J. S., Rumpl, W., & Nordsieck, K. H. 1977, ApJ, 217, 425
- Meikle et al. (1993) Meikle, W. P. S., Spyromilio, J., Allen, D. A., Varani, G. -F., & Cumming, R. J. 1993, MNRAS, 261, 535
- Mezger et al. (1986) Mezger, P. G., Tuffs, R. J., Chini, R., Kreysa, E., & Gemünd, H.-P. 1986, A&A, 167, 145
- Nakamura et al. (2001) Nakamura, T., Mazzali, P. A., Nomoto, K., & Iwamoto, K. 2001, ApJ, 550, 991
- Nakamura & Umemura (2001) Nakamura, F., & Umemura, M. 2001, ApJ, 548, 19
- Nomoto et al. (2003) Nomoto, K., Maeda, K., Mazzali, P. A., Umeda, H., Deng, J., & Iwamoto, K. 2003, in Stellar Collapse, ed. C. L. Fryer (Dordrecht; Kluwer), in press (astro-ph/0308136)
- (58) Nomoto, K., Mazzali, P. A., Nakamura, T., et al. 2001, in Supernovae and Gamma Ray Bursts, eds. M. Livio et al. (Cambridge Univ. Press), 144 (astro-ph/0003077)
- Overbury, Bertrand, & Somorjai (1975) Overbury, S. H., Bertrand, P. A., & Somorjai, G. A. 1975, Chemical reviews, 75, 547
- Pei & Fall (1995) Pei, Y. C., & Fall, S. M. 1995, ApJ, 454, 69
- Pettini et al. (1997) Pettini, M., King, D. L., Smith, L. J., & Hunstead, R. W. 1997, ApJ, 478, 536
- Pettini et al. (1994) Pettini, M., Smith, L. J., Hunstead, R. W., & King, D. L. 1994, ApJ, 426, 79
- Primas et al. (2000) Primas, F., et al. 2000, in The First Stars, ed. A. Weiss, T. Abel, & V. Hill (Berlin : Springer), p51
- Rhee (1970) Rhee, S. K. 1970, J. Am. Ceram. Soc., 53, 639
- Robie & Waldbaum (1968) Robie, R. A., & Waldbaum, D. R. 1968, Geological Survey Bull., No. 1259
- Schneider et al. (2003) Schneider, R., Ferrara, A., Salvaterra, R., Omukai, K., & Bromm, V. 2003, Nature, 422, 869
- Schneider (2003) Schneider, R., Ferrara, A., & Salvaterra, R. 2003, submitted to MNRAS (astro-ph/0307087)
- (68) Shigeyama, T., & Nomoto, K. 1990, ApJ, 360, 242
- Tabak et al. (1975) Tabak, R. G., Hirth, J. P., Meyrick, G., & Roark, T. P. 1975, ApJ, 196, 457
- Todini & Ferrara (2001) Todini, P., & Ferrara, A. 2001, MNRAS, 325, 726
- Travaglio (99) Travaglio, C., Gallino, R., Amari, S., Zinner, E., Woosley, S., & Lewis, R. S. 1999, ApJ, 510, 325
- Umeda & Nomoto (2002) Umeda, H., & Nomoto, K. 2002, ApJ, 565, 385
- (73) ———. 2003a, Nature, 422, 871
- (74) ———. 2003b, submitted to ApJ (astro-ph/0308029)
- Whitelock et al. (1989) Whitelock, P. A., et al. 1989, MNRAS, 240, 7
- Wooden et al. (1993) Wooden, D. H., Rank, D. M., Bregman, J. D., Witteborn, F. C., Tielen, A. G. G. M., Cohen, M., Pinto, P. A., & Axelrod, T. S. 1993, ApJS, 88, 477
- Woosley, Eastman & Schmidt (1999) Woosley, S. E., Eastman, R. G., & Schmidt, B. P. 1999, ApJ, 516, 788
- Woosley & Weaver (1995) Woosley, S. E., & Weaver, T. A. 1995, ApJS, 101, 181
- Yamamoto et al. (2001) Yamamoto, T., Chigai, T., Watanabe, S., & Kozasa, T. 2001, A&A, 380, 373
- Zinner (1998) Zinner, E. 1998, Meteoritics & Planetary Science, 33, 549
| Model | Progenitor | Explosion | Mass cut | He–core | |
|---|---|---|---|---|---|
| mass | energy | mass | |||
| erg) | |||||
| C13 ….. | 13 | 1 | 1.50 | 2.05 | 0.07 |
| C20 ….. | 20 | 1 | 2.45 | 5.79 | 0.07 |
| C25 ….. | 25 | 1 | 2.54 | 8.01 | 0.07 |
| C30 ….. | 30 | 1 | 2.54 | 10.7 | 0.07 |
| P170 …. | 170 | 20 | 0 | 82.4 | 3.56 |
| P200 …. | 200 | 28 | 0 | 117.3 | 7.25 |
| H25A ….. | 25 | 10 | 3.29 | 8.01 | 0.07 |
| H25B ….. | 25 | 10 | 2.47 | 8.01 | 0.7 |
| H30A ….. | 30 | 30 | 5.31 | 10.9 | 0.07 |
| H30B ….. | 30 | 30 | 4.33 | 10.9 | 0.7 |
Note. — The labels C, P and H of the model represent ordinary CCSNe, PISNe and HNe, respectively, and the numerical value denotes the mass of progenitor in units of solar mass.
| Grains | Key species | Chemical reactions | (erg/cm2) | |||
|---|---|---|---|---|---|---|
| 4.84180 | 16.5566 | 1800aaElliott, Gleiser, & Ramakrishna (1963) | 1.411 | |||
| 9.31326 | 30.7771 | 380bbKozasa & Hasegawa (1988) | 1.932 | |||
| 5.36975 | 17.4349 | 800ccElliott & Gleiser (1960) | 1.684 | |||
| 5.58902 | 16.6071 | 1510ccElliott & Gleiser (1960) | 1.615 | |||
| 6.15394 | 17.8702 | 1697ccElliott & Gleiser (1960) | 1.490 | |||
| 4.67733 | 16.7596 | 1880ccElliott & Gleiser (1960) | 1.421 | |||
| 5.03880 | 16.8372 | 1936ccElliott & Gleiser (1960) | 1.383 | |||
| 5.09130 | 17.1559 | 1924ccElliott & Gleiser (1960) | 1.377 | |||
| 3.97955 | 14.9083 | 1300ccElliott & Gleiser (1960) | 1.412 | |||
| 8.64726 | 19.0422 | 1400ddTabak et al. (1975) | 1.281 | |||
| 14.8934 | 37.3825 | 1800eeKozasa et al. (1996) | 1.702 | |||
| 16.4696 | 37.2301 | 1242ffRhee (1970) | 1.689 | |||
| 18.4788 | 45.3543 | 690ggOverbury, Bertrand, & Somorjai (1975) | 1.718 | |||
| 25.0129 | 72.0015 | 400hhBoni & Derge (1956) | 2.319 | |||
| 18.6200 | 52.4336 | 436hhBoni & Derge (1956) | 2.055 | |||
| 37.2400 | 104.872 | 2.589 | ||||
| 12.6028 | 38.1507 | 605ggOverbury, Bertrand, & Somorjai (1975) | 2.080 | |||
| 11.9237 | 33.1593 | 1100ggOverbury, Bertrand, & Somorjai (1975) | 1.646 | |||
| 13.2889 | 39.1687 | 400ggOverbury, Bertrand, & Somorjai (1975) | 1.805 | |||
| 11.1290 | 31.9850 | 580ggOverbury, Bertrand, & Somorjai (1975) | 1.682 |
Note. — The key species is defined as the gaseous species of the least collisional frequency among the reactants. The Gibbs free energy for formation of the condensate from the reactants per the key species is approximated by a formula , and the numerical values A and B are evaluated by least–squares fitting of the thermodynamics data (Chase et al. 1985) in the range of temperatures of interest. is the surface energy of the condensate, and is the hypothetical radius of the condensate per the key species whose values are calculated from the molar volumes tabulated by Robie & Waldbaum (1968).