Abstract
It is currently impossible to determine the abundances and ages of the stellar populations of distant, dense stellar systems star by star. Therefore, methods to analyze the composite light of stellar systems are required. I review the modelling and analysis of integrated spectra of the stellar populations of individual globular clusters, globular cluster systems, early-type galaxies, and the bulges of spiral galaxies, with a focus on their abundances and abundance ratios. I conclude with a list of continuing difficulties in the modelling that complicate the interpretation of integrated spectra as well as a look ahead to new methods and new observations.
Chapter 0 Abundances from the Integrated
Light of Globular Clusters and
Galaxies
1 Introduction
The reviews presented in this volume demonstrate that the nucleosynthetic history of the Milky Way and its satellites can now be probed in exquisite detail, revealing a wealth of information about the processes by which our own Galaxy and its neighbors have formed. Such star-by-star analysis of the abundances of distant globular clusters and distant and/or dense galaxies is however currently beyond the reach of current telescopes. Although this situation might change with the advent of overwhelmingly large telescopes of the 30–100m class with high-precision adaptive optics systems, during the 20th Century and at the beginning of the 21st, we have been limited to studying the integrated stellar populations of distant globular clusters and galaxies.
In this review, I will discuss spectroscopic techniques for determining abundances from the integrated light of galaxies and globular clusters. I will begin with a discussion of the ingredients of the models required to interpret the integrated-light spectra, the calibration of those models, and a few of their their pitfalls. I will then discuss the abundances determined from integrated light spectroscopy of globular clusters in our Galaxy, the Local Group, and the globular cluster systems of early-type galaxies. I will then consider the abundances of nearby early-type galaxies and the bulges of early-type spirals determined from integrated-light spectroscopy, including recent results on abundance anomalies in these systems. Although I will focus on deriving abundances from optical spectra, these results necessarily depend on the ages of the systems (through the age–metallicity degeneracy, §1), and so I must briefly discuss the ages of these systems. Finally, I will summarize the current state of the observations, the current problems in understanding stellar populations from integrated-light spectroscopy, and current and future directions in this subject.
Perusal of this outline reveals that there are a number of topics I will not discuss, due either to space constraints or to difficulties in interpretation. I will not be able to discuss the fascinating history of this subject in detail. I will not discuss purely photometric methods of determining abundances, such as attempts to derive abundances of globular clusters and early-type galaxies from broad-band colors, as the interpretation of broad-band optical colors is seriously compromised by the age–metallicity degeneracy. I will not have space to discuss abundances derived from wavebands other than the optical; there have been excellent recent reviews and studies of the stellar populations of globular clusters and early-type galaxies determined from, e.g., UV spectroscopy (O’Connell 1999; Dorman, O’Connell & Rood 2003; Peterson et al. 2003; Peterson, this meeting). Last, but not least, I will not discuss stellar abundances of irregular or dwarf galaxies themselves (apart from M32), as this subject is ably covered in Section V of this volume, and I will touch only lightly on abundances derived from the integrated stellar light of bulges of early-type spiral galaxies. Garnett (this volume) thoroughly and cogently discusses the gas-phase abundances of such galaxies.
2 Stellar population modeling of integrated-light spectra
The interpretation of the integrated light of globular clusters and galaxies requires astrophysically-constrained models. In this section, I outline the basic purpose and ingredients of such models and the steps required to calibrate them.
1 The basic problem

O’Connell (1986) gives a clear physical explanation of the age–metallicity degeneracy that plagues the study of the integrated light of stellar populations. Because the emergent flux from a stellar atmosphere is a superposition of spectra which are characterized by different temperatures weighted by a function of opacity, increases in opacity in a stellar atmosphere due to increased metallicity are equivalent to a decreased mean temperature for the emergent flux. Therefore, a metal-rich population can be simulated by decreasing the mean temperature—that is, decreasing the age—of a more metal-poor population (Fig. 1).
The key breakthrough in the analysis of integrated stellar populations was made by Rabin (1980, 1982) and Gunn, Stryker & Tinsley (1981), who noticed independently that the strengths of the Balmer lines of hydrogens derived from evolutionary population synthesis models allow an accurate age of a single-burst stellar population to be measured. Rabin expressed this idea in a powerful graphical form: the “hydrogen–metals diagnostic diagram,” in which the strength of Balmers are plotted as a function of a metal-line (in this case, Ca 2 K) for the integrated spectra and stellar population models. Using this diagram, he could break the age–metallicity degeneracy. Applying this method to clusters in the Magellanic Clouds, Rabin confirmed that the Searle, Wilkinson & Bagnuolo (1980; hereafter SWB) ranking of those clusters was indeed an age ranking.
Worthey (1994) and Worthey & Ottaviani (1997) quantified the age–metallicity degeneracy for a large number of absorption-line strengths and broad-band colors. Metal lines (like and ) and broad-band colors are slightly more sensitive to metallicity than age, in the ratio (Worthey 1994; Fig. 1). This means that a factor of 3 change in age looks like a factor of 2 change in metallicity for a simple stellar population. Clearly, age-sensitive indices are desired—lines that preferentially measure the (luminosity-weighted) temperature of the main-sequence turnoff. Following Rabin (1980, 1982), Worthey (1994) showed that for (and for H and H; Worthey & Ottaviani 1997). Thus, a Balmer-line index combined with a metal-line index breaks the age–metallicity degeneracy.
2 Ingredients
The first attempt to synthesize the spectral lines and colors of a galaxy appears to have been made by Whipple (1935). Whipple developed population synthesis, in which arbitrary permutations of stellar types are combined to make a synthetic galaxy spectrum and colors; this method was highly influential on many later workers (e.g., de Vaucouleurs & de Vaucouleurs 1959; Spinrad 1962a,b; Spinrad & Taylor 1969, 1971; Lasker 1970; Faber 1972; O’Connell 1976; Williams 1976). Tinsley (1968, 1972; Tinsley & Gunn 1976) invented the method that has generally superseded population synthesis: evolutionary population synthesis. In this method, populations are modelled from the starting point of an isochrone and a luminosity function and then matched to the observations, instead of attempting to extract a color-magnitude diagram and luminosity function from the observations. Tinsley’s method has become the basis for modern stellar population models (e.g., Bruzual 1983; Buzzoni 1989; Charlot & Bruzual 1991; Bruzual & Charlot 1993; Worthey 1994; Bressan, Chiosi & Fagotto 1994; Maraston 1998).
To build a model of a simple stellar population (SSP)—that is, a single-age, single-metallicity stellar population—that can be used to analyze the integrated spectrum of a given object, four major ingredients are required.
- Isochrones
-
An isochrone set that is best calibrated against the populations of interest (young, intermediate-aged, or old; metal-poor or metal-rich) is needed as the basic astrophysical constraint. Popular choices for the intermediate-aged and old populations considered here are currently the Padova set (Girardi et al. 2000; Salasnich et al. 2000); the set from Cassisi, Castellani & Castellani (1997) and Bono et al. (1997); and the set of Salaris & Weiss (1998) and more recent extensions (see, e.g., Schiavon et al. 2002b).
- Initial mass function
-
An IMF populates the isochrones as needed. Typically, a Salpeter (1955) IMF is chosen, although other choices are possible (Vazdekis et al. 1996).
- Stellar fluxes
-
While it may be preferable to have a set of observed stellar fluxes covering a comprehensive range in temperature, gravity and metallicity (and even ), such a set is not currently available (although see Vazdekis 1999 for another approach and Le Borgne et al. 2003 for a hint of what is to come). We therefore are reliant on the theoretical flux library of Kurucz (1993), which covers a broad range of parameter space, or modifications of that library to attempt to bring its colors into better agreement with real stars (Lejeune, Cuisinier & Buser 1997, 1998; Westera et al. 2002).
- Stellar spectra or absorption-line strengths
-
Because we require the strengths of Balmer-line and metal-line indices to break the age–metallicity degeneracy, a library of either stellar spectra (e.g., Jones 1998) or stellar absorption-line strengths (e.g., Worthey et al. 1994) is required. Given the difficulties matching the Lick/IDS system precisely (Worthey & Ottaviani 1997; Trager, Faber & Dressler 2003), we would like to find new libraries for population syntheses. Such libraries are on their way (Schiavon, priv. comm.; Worthey, priv. comm.; Peletier, priv. comm.; Rose, priv. comm.).
Once these ingredients are available, one can construct a stellar population model, as shown in Figure 2. However, such models clearly have a problem: ages and metallicities derived from different pairs of Balmer- and metal-line indices are different for giant elliptical and many S0 galaxies. These discrepancies result from the non-solar abundance ratios of these objects (O’Connell 1976; Faber & Jackson 1976; Peterson 1976; Peletier 1989; Worthey, Faber & González 1992; Greggio 1997; Worthey 1998; Trager et al. 2000a). Although we refer to these non-solar abundance ratios by the shorthand phrase “-enhancements,” we stress that the proper interpretation of these discrepancies is actually as “Fe-deficiencies,” because the “-elements” O and Mg dominate the metallicity determinations (Greggio 1997; Trager et al. 2000a). Correcting for (or more generally, for for any element : TMB03) requires either an empirical stellar library with the needed enhancements or stellar atmosphere models in which synthetic spectra with the needed enhancements can be generated, as well as isochrones with , such as those available in the Padova and Salaris & Weiss sets (cf. Trager et al. 2000a; but see Maraston & Thomas 2003). The empirical approach was attempted first by Weiss, Peletier & Matteucci (1995), who coupled fitting functions for Mg2 and from the Bulge giants of Rich (1988) with -enhanced isochrones; unfortunately, the Rich library was not complete enough for a reasonable coverage of parameter space and more importantly did not include the crucial index. Trager et al. (2000a) and TMB03 have chosen to use the stellar atmosphere computations of Tripicco & Bell (1995), who modelled the response of the Lick/IDS index system to changes in individual elements, in a differential sense, and ignore the -enhanced isochrones (Maraston & Thomas 2003). While more flexible for analyzing populations that may not resemble local stars, calibration of these theoretical corrections is required.
3 Calibrations
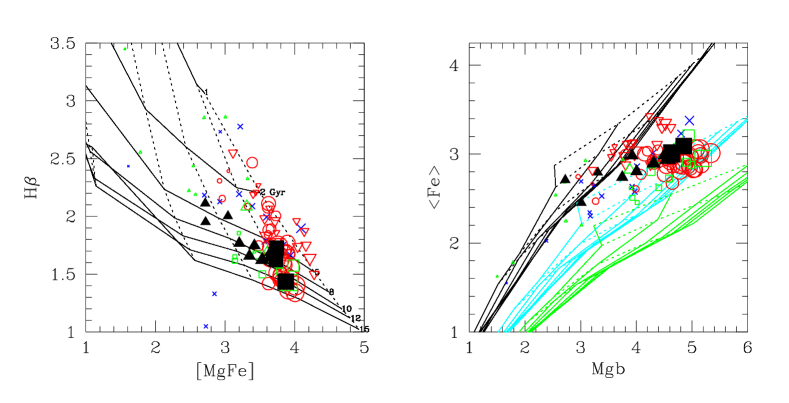
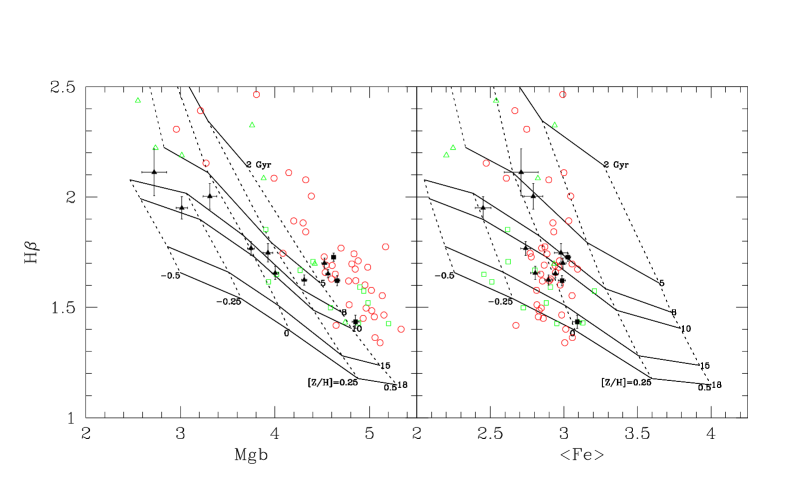
I show the results of -enhanced models (TMB03) in Figure 3. It is clear that if these models are indeed properly calibrated, then it is possible to determine uniquely age, metallicity, and for a single-burst population. Galaxies are unlikely to be SSP’s, but globular clusters are (except maybe Cen: Smith, this volume). I note here that the “metallicities” measured by the Trager et al. (2000a) technique are total metallicities , not . However, can be converted to on the Zinn & West (1984) scale with the following (model-dependent) scaling: (Tantalo, Chiosi & Bressan 1998; Trager et al. 2000a; TMB03).
I will now exploit this fact and turn to a model of an individual cluster: 47 Tuc. Gibson et al. (1999) pointed out that the stellar population models of Jones & Worthey (1995) predicted an age in excess of 20 Gyr from H and the Ca4227 or C24668 indices. for 47 Tuc, a cluster with a CMD-based age of 11–14 Gyr (depending on the isochrone set used; Schiavon et al. 2002b). Vazdekis et al. (2001) brought the spectroscopic age down by using -enhanced isochrones with He diffusion (from the Salaris & Weiss 1998 set). Schiavon et al. (2002a,b) used a two-pronged approach to solve this problem. First, they synthesized the spectrum directly from the CMD (Schiavon et al. 2002a), which was meant to reveal any problems with the stellar libraries. Schiavon et al. uncovered several: (a) it is necessary to have a strictly homogeneous set of atmospheric parameters for the stars in the library; (b) the metallicities of the library stars used in the synthesis must be that of the cluster to less than dex, and must be on the same metallicity scale; and (c) the line strengths need to account for the CN bimodality of the cluster (which extends to at least the main-sequence turnoff: Hesser 1978), in which roughly half the stars are CN-strong. Now that the necessary corrections to the line strengths are understood, the second step is to synthesize the line strengths from the best-fitting isochrone (Schiavon et al. 2002b). A significant problem arises in this step: the observed luminosity function does not match that of the model, due to a lack of AGB stars (in the Salaris isochrones) and a strong deficit of RGB stars (in both the Salaris and Padova isochrones). Once all of these problems are corrected for, nearly all of the synthesized spectral indices match the observations at the correct age (11–13 or 12–14 Gyr using the Salaris and Padova isochrones, respectively) and metallicity ( dex).
Now that we have confidence in our stellar population models to predict the age and metallicity of a single globular cluster (finally; Searle 1986), we turn to the calibration of the corrections for . Maraston et al. (2003) have done this by comparing the Lick/IDS globular cluster data and the Bulge cluster data of Puzia et al. (2002) with the TMB03 stellar population models, index-by-index. I show Puzia et al.’s data for a few indices below (Fig. 4) but comment here that several indices do not match the models: CN1 and CN2 (Burstein et al. 1984); Ca4455 (this difficult index probably should be dropped from the Lick/IDS system); strikingly, C24668, an index with a large dynamic range at fixed temperature but varying metallicity (Worthey et al 1994; Worthey 1994); Na D; and the TiO indices (although this isn’t surprising, as Tripicco & Bell 1995 did not model TiO properly). TMB03 have solved the discrepancies in the CN indices and C24668 by allowing (cf. Brodie & Huchra 1991; Smith et al. 1997); but Na D remains a mystery (Spinrad 1962a,b; Cohen et al. 2003).
3 Globular cluster systems
Now that the required tools are in hand, I turn to what has been learned about the abundances and ages of the stellar populations of globular cluster systems of the Milky Way and M31 (§1), dwarf galaxies in the Local Group (§2), and early-type galaxies (§3).
1 The globular cluster systems of the Milky Way and Messier 31
Van den Bergh’s (1969) spectroscopy of globular clusters in M31, the Fornax dwarf spheroidal galaxy and the Milky Way opened the field of extragalactic globular cluster systems. He found that the metallicities of M31 globular clusters were on average more metal-rich than those in the Milky Way with a similar or slightly larger metallicity spread, but the Fornax clusters were more metal-poor and had a much smaller metallicity spread. Interestingly, van den Bergh also found that the Balmer line strengths of globular clusters may differ at fixed metallicity, even in the most metal-rich clusters (see the discussion in Rose 1985); this suggests that age may play a role in the stellar populations of some globular cluster systems or that blue horizontal branches may exist at much higher metallicities than seen in the Milky Way globular clusters.
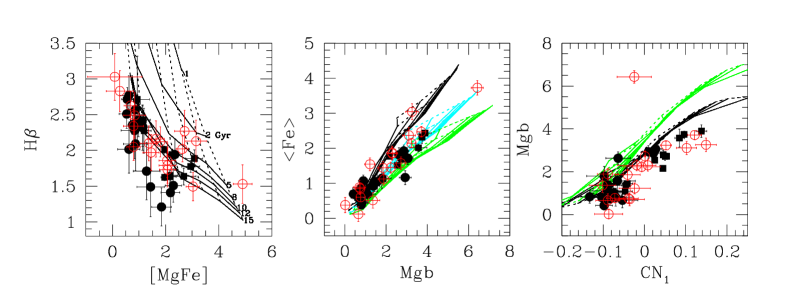
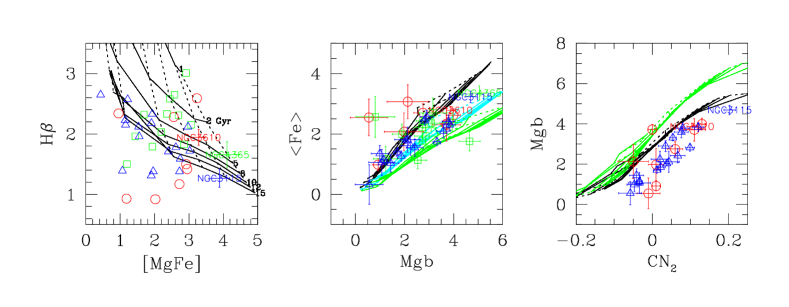
In Figure 4 I plot the line strengths of globular clusters in the Milky Way and M31. Three primary results can be read from this Figure.
-
1.
The mean metallicity and spread in metallicity of the globular cluster systems in the two dominant spirals of the Local Group are nearly identical when the bulge clusters of the Milky Way are included.111Figure 4 ignores the inner bulge clusters of M31, for which spectral indices are unavailable. It may be that those clusters have high metallicity (as the Milky bulge globulars have higher metallicity than the halo clusters), which would weaken this conclusion.
-
2.
The M31 clusters are slightly more “solar” in their ratios at the highest metallicities.
-
3.
The CN strengths at fixed are very similar in both systems but are significantly higher than the strength predicted by the models at the ratios derived from the – diagram.
Point (1) implies that metallicities of M31 clusters from integrated-light spectra interpreted using the TMB03 models can be assumed to be well-calibrated onto the Zinn & West (1984) scale as long as can be measured. Point (2) supports the identification of the two “intermediate-aged” (-strong) M31 clusters (V87 and V116) as being somewhat younger than the dominant cluster populations in the two systems (cf. Brodie & Huchra 1990). However, the -strong, metal-rich Galactic globular clusters are the Bulge clusters NGC 6388 and NGC 6441, which have well-populated blue horizontal branches that do not exist in other metal-rich clusters (Rose & Tripicco 1986; Rich et al. 1997). Point (3) disagrees with the conclusions of Burstein et al. (1984), who found that M31 clusters have stronger CN strengths than Galactic globular clusters, solely because the Lick/IDS database does not contain the metal-rich Bulge clusters which span the high-CN strengths of the metal-rich M31 clusters. As discussed above, “enhanced” CN at fixed appears to be a result of in these clusters.
I note however that many of the globular clusters in Figure 4 fall below the strengths of the TMB03 models. As discussed in §3 above, this is due to a number of factors. TMB03 use the Worthey et al. (1994) fitting functions, taken from the Lick/IDS stellar library of absorption-line strengths, in which the atmospheric parameters are somewhat inhomogeneous, and which are constrained by very few stars at metallicities below , which makes direct comparison with halo globular clusters problematic. Finally, it is possible that the TMB03 models may have problems with the RGB/AGB luminosity functions, although the Maraston (1998) synthesis method on which TMB03 is based uses the fuel-consumption theorem (Renzini & Buzzoni 1986), which should properly populate the luminosity functions.
2 The globular cluster systems of dwarf galaxies in the Local Group
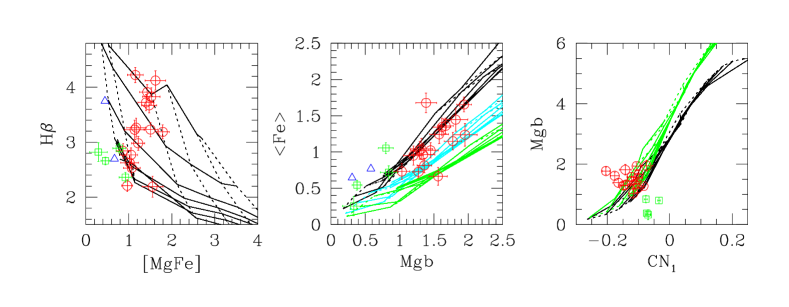
In Figure 5 I show the stellar populations for the globular cluster systems of three dwarf galaxies in the Local Group: the Large Magellanic Cloud (Beasley, Hoyle & Sharples 2002), the Fornax dSph (Strader et al. 2003b), and the dIrr NGC 6822 (Cohen & Blakeslee 1998; see also Chandar, Bianchi & Ford 2000; Strader, Brodie & Huchra 2003b). As shown previously by Rabin (1982), Beasley et al. (2002) find that the SWB sequence is indeed an age sequence, with the younger clusters being more metal-rich. In fact, the LMC clusters represent the best training set we currently have for calibrating the stellar populations of intermediate-aged populations (Searle 1986), but the multivalued nature of the TMB03 model grids at very low metallicity (because of the blue horizontal branches) makes the old, metal-poor end difficult to calibrate without a priori knowledge of the horizontal branch morphology (Beasley et al. 2002). The ratios of the LMC clusters—which is only slightly super-solar—do not seem to decrease appreciably with decreasing age, so possibly age and are not tightly coupled (as is also seen for giant ellipticals, Trager et al. 2000b; Fig. 3). Moreover, the LMC clusters appear not to have a significant CN anomaly. The reasons for this are unclear, but may be related to the – relation discussed below for early-type galaxies.
The two smaller dwarfs considered in Figure 5 have very metal-poor globular cluster populations. The clusters in Fornax are quite old and even show a CN anomaly of the sort present in the Galactic and M31 clusters—that is, the CN strengths are too high at fixed strength. The NGC 6822 clusters have a range of ages, with at least one old cluster (H VII) and a number of younger clusters (Cohen & Blakeslee 1998; Chandar et al. 2000; Strader et al. 2000b). Da Costa & Mould (1988) employed a method similar to Rabin’s (1982) study to probe the stellar populations of the globular cluster systems of NGC 147, NGC 185, and NGC 205, comparing the equivalent widths of the Balmer lines with Ca 2 K. They found that the majority of the clusters were old, although both NGC 205 and NGC 185 have intermediate-aged clusters and NGC 205 has at least two metal-rich clusters similar to those in the Galactic Bulge (see their Fig. 3). However, line strengths on the Lick/IDS system do not exist for these clusters and direct comparison with the stellar populations derived from Figure 5 is not possible.
3 The globular cluster systems of nearby early-type galaxies
Although heroic early efforts were made by Racine, Oke & Searle (1978), Hanes & Brodie (1986), Mould, Oke & Nemec (1987), Mould et al. (1990), Brodie & Huchra (1991), Perelmuter, Brodie & Huchra (1995), Jablonka et al. (1996), Minniti et al. (1996), and Bridges et al. (1997) using 4–5m class telescopes, the era of measuring accurate stellar populations of the globular cluster systems of early-type galaxies began in earnest with the availability of multislit spectrographs on 8–10m class telescopes. Kissler-Patig et al. (1998) and Cohen, Blakeslee & Rhyzov (1998) studied NGC 1399 and M87, respectively, using the LRIS multislit spectrograph (Oke et al. 1995) on the Keck Telescopes. Cohen et al. (1998) studied the largest sample of extragalactic globular clusters around a single galaxy to date (150). Although the typical signal-to-noise of these spectra is not as good as the most recent studies (e.g., Puzia et al. 2003), given the size of the dataset, statistically significant conclusions about the stellar populations of the globular cluster system of an early-type galaxy could be drawn for the first time. In particular, of the clusters around M87 are old and can be classified into metal-poor () blue clusters and metal-rich () red clusters in a ratio of 2:3, thus resolving most of the debate about the cause of the bimodality in colors of globular cluster systems of early-type galaxies (e.g., Kundu & Whitmore 2001; Larsen et al. 2001). However, a small () population of intermediate-aged clusters can also be found in M87.
In Figure 6 I show recent results for the globular cluster systems of three early-type galaxies: NGC 3115 (Kuntschner et al. 2002); NGC 3610 (Strader et al. 2003c); and NGC 4365 (Larson et al. 2003), together with line strengths of their host galaxies (see figure caption for line-strength references). Although the error bars are large, the basic results of Cohen et al. (1998) are confirmed: there are generally three populations of globular clusters in early-type galaxies—metal-poor, old, blue clusters, metal-rich, old, red clusters, and often small frostings of metal-rich, intermediate-aged, red(der) clusters (see also Puzia et al. 2003). This small frosting of intermediate-aged clusters may be a key to understanding the formation history of their host galaxies. A particularly interesting case is the globular cluster system of NGC 4365, as NGC 4365 has no evidence of having an intermediate-aged stellar population (Davies et al. 2001; Larsen et al. 2003; Fig. 6). It may be hoped that the multiple-population degeneracy of the Lick/IDS index system (Trager et al. 2000b) can be broken using globular clusters as tracers of individual star formation events in their host galaxies; such work is in progress (e.g., Larsen et al. 2003). Note also that these globular cluster systems also show a CN anomaly.
4 Early-type galaxies and bulges
Determining the abundances and ages of galaxies is far more complex than doing the same for globular clusters, which are nearly all SSPs. Galaxies are composite stellar populations, and thus the interpretation of their spectra suffer from (currently) unavoidable difficulties. In particular, the absorption-line strength indices of composite populations are the luminosity-weighted sums of their SSP components. This means that young populations, which have low mass-to-light ratios and therefore high light-to-mass ratios, unduly bias the analysis of composite populations if present (see, e.g., Trager et al. 2000b). However, in the absence of other knowledge (like the ages of the globular clusters possessed by the galaxy), line-strength indices only give the SSP-equivalent stellar population parameters for any individual galaxy. Therefore, I will proceed with a discussion of the abundances (and ages) obtained from modelling the integrated spectra of early-type galaxies and bulges as SSPs.
In Figure 3 I show the stellar populations of the nuclei of early-type galaxies (data from González 1993; Fisher et al. 1996; Kuntschner 2000; Trager et al. 2003) and spiral bulges (S0/a–Sbc; data from Proctor & Sansom 2002). Several results can be read directly from this Figure.
-
1.
The nuclei of early-type galaxies and early-type spiral bulges have metallicities that range from just below solar to nearly five times the solar value.
-
2.
Field ellipticals, S0’s in most environments, and early-type spiral bulges span a large range in over a reasonably small range in and therefore span a large range in SSP-equivalent age.
-
3.
Cluster ellipticals are typically coeval to a factor of in age and vary mostly in metallicity (Bower, Lucey & Ellis 1992; Kuntschner 2000).
-
4.
Ellipticals typically have ; is proportional to velocity dispersion but apparently not to age (Trager et al. 2000b).
-
5.
S0’s are slightly more “solar” in than ellipticals. They also show a variation in with velocity dispersion (Fisher et al. 1996), although not as strong as that in ellipticals.
-
6.
Bulges of early-type spirals (S0/a–Sbc) are similar to field ellipticals in the distribution of their ages, metallicities, and ratios.
By analyzing correlations between the derived stellar population parameters, Trager et al. (2000b) found that the nuclei elliptical galaxies (a) obey a – relation (point 3 above, and suggested earlier by Worthey et al. 1992) that may (Thomas, Maraston & Bender 2002) or may not (Trager et al. 2000b) depend on age and (b) occupy only a thin plane in –– space (the “-plane”), such that age and metallicity are anti-correlated with a slope at fixed velocity dispersion and metallicity increases with velocity dispersion at fixed age.
The – relation can be explained (Trager et al. 2000b) as either a varying IMF with galaxy mass—larger galaxies have “flatter” IMFs and therefore more high mass stars and therefore more SN II and therefore higher and, at fixed age, higher (Worthey et al. 1992; Matteucci 1994)—or that smaller galaxies have more efficient, metal-enriched winds (Vader 1986, 1987)—so that SN II products are lost more efficiently in these objects and so have lower at fixed SN Ia yield and therefore lower at fixed age. In the latter case, a high is still required for massive ellipticals, so a very short star formation timescale ( Gyr; Matteucci 1994) or a flattened IMF would be required for all elliptical galaxies.
A simple physical explanation for the -plane is more difficult to find. Multiple-burst population models seem to fit the data best, with small (1–10%) bursts of recent (1–3 Gyr) star formation providing the enhanced strengths and suitably increased metallicities over a dominant (by mass) old population, but the modelling is not unique (Trager et al. 2000b). It is not yet clear if hierarchical merging models can reproduce this plane (Kauffmann & Charlot 1998). This plane has definite observational consequences. Because age and metallicity of elliptical galaxy nuclei are correlated at fixed velocity dispersion with a slope of 3/2 that preserves constant broad-band optical color and metal-line indices (§1), the Mg– relations (e.g., Mg2–) are actually edge-on projections of this plane and therefore are not good indicators of a physically significant mass–metallicity relation (Faber 1977; Colless et al. 1999). In fact, there is no mass–metallicity relation in the SSP-equivalent populations of field elliptical galaxies; although there is such a relation for the roughly coeval and presently old cluster elliptical galaxy population.
Although multiple ages in a population are hard to recover, the light-weighted mean metallicity is measured quite well from an integrated spectrum. An Appendix in Trager et al. (2000b) demonstrates the calculation based on the color-magnitude diagram of the top of the RGB of M32 at (Grillmair et al. 1996) and extrapolated absorption-line strengths from (González 1993). The light-weighted metallicity from the CMD assuming a population between 8 and 15 Gyr old is dex; from the line strengths, a Worthey (1994) model (which uses the same isochrones) gives dex. A similar (though purely theoretical) calculation for suggests that light-weighted abundance ratios are also measured quite reliably from integrated spectra.
Finally, by examining other line strengths than and , other elemental abundances beside the rather generic are coming under scrutiny. Saglia et al. (2002), Cenarro et al. (2003), and Falcón-Barroso et al. (2003) have studied the Ca 2 triplet at 8600 Å in early-type galaxies and bulges and found that stellar population models (from either TMB03 or Vazdekis et al. 2003) overpredict the strength of the CaT∗ index by as much as 1.5 Å if is set to the level suggested by , , and , and calcium is included with the -elements. This suggests that either the IMF is significantly steeper than previously assumed to include more dwarf stars (cf. the discussion about Na D earlier), in conflict with the ratios of the galaxies (Saglia et al. 2002), or that calcium does not act as an -element in early-type galaxies and bulges (Worthey 1998; Trager et al. 2000a). This latter suggestion has recently been reinforced by Thomas, Maraston & Bender (2003b), who examined the Ca4227 index (centered on the Ca 2 line) of ellipticals from the Lick/IDS sample (Trager et al. 1998) and found that this index also required Ca to track Fe. More exactly, Thomas et al. required for giant ellipticals, decreasing as velocity dispersion decreased. Therefore, giant galaxies are Ca underabundant. In fact, the Ca underabundance is nearly that of the Fe underabundance, , so in elliptical galaxies.
5 Summary
I conclude this review with an overview of the state of the art in determining the abundances and ages of globular clusters, early-type galaxies and the bulges of spirals from integrated-light spectra. I then discuss the present difficulties we have with stellar population models and their application. I finish with a hint of what is to come in the immediate future.
1 The current state of play
It is now possible to determine accurately and precisely the age, metallicity, and abundance ratio of a simple stellar population—one that has experienced only a single burst of star formation—from its integrated spectrum. We can therefore probe the stellar populations of globular clusters, including those around other, distant galaxies, with confidence. In Local Group galaxies, various researchers have used this technique to determine that the mean metallicity of globular cluster systems correlates with the mass of the host galaxy. The stellar content of many clusters too distant to resolve without adaptive optics or a large space telescope have been probed and the rough chemical compositions characterized. Overly-strong CN lines, apparently indicative of N enhancements, have been detected in the Galactic, M31, and Fornax globular cluster systems, but not in the LMC. The stellar populations of the globular cluster systems of early-type galaxies can now be studied in detail, and the bimodality of globular cluster colors is now resolved into three populations: blue, old, metal-poor and red, old, metal-rich, which together dominate the cluster populations, and a frosting of red, intermediate-aged, metal-rich clusters. The CN anomaly is also present in these systems (Fig. 6), and so seems an almost generic property of globular cluster stellar populations—except in the LMC.
For more complex star formation histories, we can at present only parameterize this history as three (or five) numbers without additional information: the SSP-equivalent age, metallicity, and (and now and ; TMB03). However, that parameterization is a useful one, and much progress has been made using this simplistic approach. Field ellipticals, S0’s in many environments (except possibly in the richest clusters), and spiral bulges span a large range in SSP-equivalent age. Cluster ellipticals, on the other hand, are typically coeval to within a factor of two in age. SSP-equivalent metallicities of the nuclei of early-type galaxies and spiral bulges range from just below solar to nearly five times solar. At fixed velocity dispersion (mass), age and metallicity are correlated in such a way as to preserve constant broad-band optical color and metal-line strength; this makes the interpretation of the optical color–magnitude and Mg– relations of local early-type galaxies problematic. There is a mass–metallicity relation for early-type galaxies at fixed age, which manifests itself primarily in cluster galaxies. I note here that line-strength gradients (González 1993; Fisher et al. 1996) suggest that early-type galaxies globally follow the same relations, with lower metallicity and older ages (cf. Trager et al. 2000a). Early-type galaxies and spiral bulges typically have Fe-deficient (“-enhanced”) stellar populations. The value of this deficiency, , is well-correlated with velocity dispersion. S0 galaxies are slightly more “solar” than giant ellipticals, where ; bulges seem to follow the elliptical track, although the sample of bulges available is still small. Finally, work is progressing on tracking the abundances of other elements, including Ca, which seems to track Fe rather than the -elements in elliptical galaxies.
2 Continuing annoyances
Of course, although we have come a long way towards precision stellar populations, there are several significant issues still outstanding. Here are three.
- Oxygen abundance
-
The oxygen abundance controls the temperature of the main-sequence turnoff (e.g., Salaris & Weiss 1998), but no direct measure of is available in the optical. Might the OH bands in the near-infrared be exploited for this purpose?
- Blue horizontal branches
-
The presence or not of BHB stars have been a continuing thorn in the side of those who analyze metal-rich stellar populations (e.g, Trager et al. 2000a). They apparently exist in dense, metal-rich clusters (Rose & Tripicco 1986; Rich et al. 1997) but the evolutionary path by which they appear in those clusters is unknown and therefore cannot yet be included in stellar population models. There is also the question of the importance of very metal-poor populations underlying the metal-rich populations that dominate the light (Rose 1985; Maraston & Thomas 2000). However, Rose (1985) showed that the strong Balmer lines in elliptical galaxies must be dominated by the light from dwarf stars, not giants. This however is not true in globular clusters, as seen in Figure 4.
- Blue straggler stars
-
Given their colors and luminosities, these stars might be another significant worry, confusing age determinations (Rose 1985; Trager et al. 2000a). Again an evolutionary path for these stars is not yet clear and therefore they have not appeared in evolutionary syntheses. However, Rose (1985) found little evidence of such stars in his study of the blue line strengths of local elliptical galaxies.
3 Present and future directions
The future for this subject seems bright. Large surveys such as the Sloan Digital Sky Survey are beginning to use this method for studying the typical stellar populations of galaxies (Bernardi et al. 2003; Eisenstein et al. 2003), although calibrations onto a well-calibrated and well-modelled system are not yet available. Two-dimensional spectroscopy using instruments like SAURON (Davies et al. 2001; de Zeeuw et al. 2002) are now examining the spatial distribution of the stellar populations of early-type galaxies and bulges and combining this information with kinematics. Spectral synthesis of galaxies (beginning with Vazdekis 1999) and principal-component analyses of spectra (e.g., Heavens, Jimenez & Lahav 2000; Reichardt, Jimenez & Heavens 2001; Eisenstein et al. 2003) are now coming over the horizon. Finally, several groups are pushing these techniques out to (Kelson et al. 2001; Trager, Dressler & Faber 2003), which will allow for the direct detection of the evolution of old stellar populations.
It is a pleasure to thank my collaborators, G. Worthey, S. Faber, A. Dressler, M. Houdashelt, J. Dalcanton, D. Burstein, and J. J. González. I also gratefully acknowledge very helpful conversations with J. Brodie, A. Cole, J. van Gorkom, J. Johnson, D. Kelson, M. Kissler-Patig, H. Kuntschner, C. Maraston, B. Poggianti, T. Puzia, R. Schiavon, D. Thomas, and E. Tolstoy during the preparation of this review. The anonymous referee is thanked for a careful reading of the manuscript and especially for pointing out the lack of data on the inner bulge clusters of M31. I would like to thank the organizers, A. McWilliam and M. Rauch, for an enjoyable meeting. The stellar population community owes a significant debt of gratitude to L. Robinson and J. Wampler for the development of the Image Dissector Scanner (IDS), which revolutionized the study of integrated spectra of galaxies. I also would like to thank J. Nelson and CARA for the vision to develop and build the Keck Telescopes and J. B. Oke and J. Cohen for building the LRIS spectrograph, which together have pushed our study of stellar populations towards the high-redshift Universe. This research has been supported at various times by a Flintridge Foundation Fellowship, by a Carnegie Starr Fellowship, by NASA through Hubble Fellowship grant HF-01125.01-99A awarded by the Space Telescope Science Institute, which is operated by the Association of Universities for Research in Astronomy, Inc., for NASA under contract NAS 5-26555, and by the Kapteyn Astronomical Institute.
References
- [1] Beasley, M A., Hoyle, F., & Sharples, R. M. 2002, MNRAS, 336, 168
- [2] Berkhuijsen, E. M., Humphreys, R. M., Ghigo, F. D., & Zumach, W. 1988, A&AS, 76, 65
- [3] Bernardi, M., et al. 2003, AJ, 125, 1882
- [4] Bono, G., Caputo, F., Cassisi, S., Castellani, V., Marconi, M. 1997, ApJ, 489, 822
- [5] Bower, R. G., Lucey, J. R., & Ellis, R. S. 1992, MNRAS, 254, 601
- [6] Brodie, J. P. & Huchra, J. P. 1990, ApJ, 362, 503
- [7] Brodie, J. P. & Huchra, J. P. 1991, ApJ, 379, 157
- [8] Bressan, A., Chiosi, C., & Fagotto, F. 1994, ApJS, 94, 63
- [9] Bruzual A., G. 1983, ApJ, 273, 105
- [10] Bruzual A., G & Charlot, S. 1993, ApJ, 405, 538
- [11] Burstein, D., Faber, S. M., Gaskell, C. M., & Krumm, N. 1984, ApJ, 287, 586
- [12] Buzzoni, A. 1989, ApJS, 71, 817
- [13] Cassisi, S., Castellani, M., & Castellani, V. 1997, A&A, 317, 10
- [14] Cenarro, A. J., Gorgas, J., Vazdekis, A., Cardiel, N., & Peletier, R. F. 2003, MNRAS, 339, L12
- [15] Chandar, R., Bianchi, L., & Ford, H. C. 2000, AJ, 120, 3088
- [16] Charlot, S. & Bruzual A., G. 1991, ApJ, 126
- [17] Cohen, J. G. & Blakeslee, J. P. 1998, AJ, 115, 2356
- [18] Cohen, J. G., Blakeslee, J. P., & Coté, P. 2003, ApJ, in press
- [19] Cohen, J. G., Blakeslee, J. P., & Rhyzov, A. 1998, ApJ, 496, 808
- [20] Colless, M., Burstein, D., Davies, R. L., McMahan, R. K., Saglia, R. P., & Wegner, G. 1999, MNRAS, 303, 813
- [21] Da Costa, G. S. & Mould, J. R. 1988, ApJ, 334, 159
- [22] Davies, R. L., et al. 2001, ApJ, 548, L33
- [23] de Vaucouleurs, G. & de Vaucouleurs, A. 1959, PASP, 71, 83
- [24] de Zeeuw, P. T., et al. 2002, MNRAS, 329, 513
- [25] Dorman, B., O’Connell, R. W., & Rood, R. T. 2003, ApJ, in press
- [26] Eisenstein, D. J., et al. 2003, ApJ, 585, 649
- [27] Faber, S. M. 1972, A&A, 20, 361
- [28] Faber, S. M. 1977, in “The Evolution of Galaxies and Stellar Populations,” eds. Tinsley, B. M. & Larson, R. (New Haven: Yale University Observatory), 157
- [29] Faber, S. M. & Jackson, R. E. 1976, 204, 668
- [30] Faber, S. M., Friel, E. D., Burstein, D., & Gaskell, C. M. 1985, ApJS, 57, 711
- [31] Falcón-Barroso, J., Peletier, R. F., Vazdekis, A., & Balcells, M. 2003, ApJ, 588, L17
- [32] Fisher, D., Franx, M., & Illingworth, G. D. 1996, ApJ, 459, 110
- [33] Gibson, B. K., Madgwick, D. S., Jones, L. A., Da Costa, G. S., & Norris, J. E. 1999, AJ, 118, 1268
- [34] Girardi, L., Bressan, A., Bertelli, G., & Chiosi, C., 2000, A&AS, 141, 371
- [35] González, J. J. 1993, PhD Thesis, U. of California, Santa Cruz
- [36] Gorgas, J., Faber, S. M., Burstein, D., González, J. J., Courteau, S., & Prosser, C. 1993, ApJS, 86, 153
- [37] Greggio, L. 1997, MNRAS, 285, 151
- [38] Grillmair, C. J., et al. 1996, AJ, 112, 1975
- [39] Gunn, J. E., Stryker, L. L., & Tinsley, B. M. 1981, ApJ, 249, 48
- [40] Hanes, D. A. & Brodie, J. 1986, ApJ, 300, 279
- [41] Heavens, A. F., Jimenez, R., & Lahav, O. 2000, MNRAS, 317, 965
- [42] Hesser, J. E. 1978, ApJ, 223, L117
- [43] Jablonka, P., Bica, E., Pelat, D., & Alloin, D. 1996, A&A, 307, 385
- [44] Jones, L. A. 1998, PhD Thesis, U. of North Carolina
- [45] Jones, L. A. & Worthey, G. 1995, ApJ, 446, L31
- [46] Kauffmann, G. & Charlot, S. 1998, MNRAS, 297, L23
- [47] Kelson, D. D., Illingworth, G. D., Franx, M., & van Dokkum, P. G. 2001, ApJ, 552, L17
- [48] Kissler-Patig, M., Brodie, J. P., Schroder, L. L., Forbes, D. A., Grillmair, C. J., & Huchra, J. P. 1998, AJ, 115, 105
- [49] Kundu, A. & Whitmore, B. C. 2001, AJ, 121, 2950
- [50] Kuntschner, H. 2000, MNRAS, 315, 184
- [51] Kuntschner, H., Ziegler, B. L., Sharples, R. M., Worthey, G., & Fricke, K. J. 2002, A&A, 395, 761
- [52] Kurucz, R. L. 1993, http://kurucz.harvard.edu/
- [53] Larsen, S. S., Brodie, J. P., Huchra, J. P., Forbes, D. A., & Grillmair, C. J. 2001, AJ, 121, 2974
- [54] Larsen, S. S., Brodie, J. P., Beasley, M. A., Forbes, D. A., Kissler-Patig, M., Kuntschner, H., & Puzia, T. H. 2003, ApJ, 585, 767
- [55] Lasker, B. M. 1970, AJ, 75, 21
- [56] Le Borgne, J.-F., et al. 2003, A&A, submitted
- [57] Lejeune, T., Cuisinier, F., & Buser, R. 1997, A&AS, 125, 229
- [58] Lejeune, T., Cuisinier, F., & Buser, R. 1998, A&AS, 130, 65
- [59] Maraston, C. 1998, MNRAS, 300, 872
- [60] Maraston, C., Greggio, L., Renzini, A., Ortolani, S., Saglia, R. P., Puzia, T. H., & Kissler-Patig, M. 2003, A&A, 400, 823
- [61] Maraston, C. & Thomas, D. 2000, ApJ, 541, 126
- [62] Maraston, C. & Thomas, D. 2003, A&A, 401, 429
- [63] Matteucci, F. 1994, A&A, 288, 57
- [64] Minniti, D., Alonso, M. V., Goudfrooij, P., Jablonka, P., & Meylan, G. 1996, ApJ, 467, 221
- [65] Mould, J. R., Oke, J. B., de Zeeuw, P. T., & Nemec, J. M. 1990, AJ, 99, 1823
- [66] Mould, J. R., Oke, J. B., & Nemec, J. M. 1987, AJ, 92, 53
- [67] O’Connell, R. W. 1976, ApJ, 206, 370
- [68] O’Connell, R. W. 1986, in “Stellar Populations,” eds. Norman, C. A., Renzini, A., & Tosi, M. (Cambridge: Cambridge University Press), 167
- [69] O’Connell, R. W. 1999, ARA&A, 37, 603
- [70] Oke, J. B. et al. 1995, PASP, 107, 375
- [71] Peletier, R. F. 1989, PhD Thesis, Rijksuniversiteit Groningen
- [72] Perelmuter, J.-M., Brodie, J. P. & Huchra, J. P. 1995, AJ, 110, 620
- [73] Peterson, R. C. 1976, ApJ, 210, L123
- [74] Peterson, R. C., Carney, B. W., Dorman, B., Green, E. M., Landsman, W., Liebert, J., O’Connell, R. W., & Rood, R. T. ApJ, 2003, ApJ, 588, 299
- [75] Proctor, R. N. & Sansom, A. E. 2002, MNRAS, 333, 517
- [76] Puzia, T. H., Saglia, R. P., Kissler-Patig, M., Maraston, C., Greggio, L., Renzini, A., & Ortolani, S. 2002, A&A, 395, 45
- [77] Puzia, T. H., et al. 2003, A&A, submitted
- [78] Rabin, D. 1980, PhD Thesis, California Institute of Technology
- [79] Rabin, D. 1982, ApJ, 261, 85
- [80] Racine, R., Oke, J. B., & Searle, L. 1978, ApJ, 223, 82
- [81] Reichardt, C., Jimenez, R., & Heavens, A. F. 2001, MNRAS, 327, 849
- [82] Renzini, A. & Buzzoni, A. 1986, in “Spectral Evolution of Galaxies,” eds. Chiosi, C. & Renzini, A. (Dordrecht: Reidel), 135
- [83] Rich, R. M. 1988, AJ, 95, 828
- [84] Rich, R. M., et al. 1997, ApJ, 484, L25
- [85] Robinson, L. B. & Wampler, E. J. 1972, PASP, 84, 161
- [86] Rose, J. A. 1985, AJ, 90, 1927
- [87] Rose, J. A. & Tripicco, M. J. 1986, AJ, 92, 610
- [88] Saglia, R. P., Maraston, C., Thomas, D., Bender, R., & Colless, M. 2002, ApJ, 579, L13
- [89] Salaris, M. & Weiss, A. 1998, A&A, 335, 943
- [90] Salasnich, B., Girardi, L., Weiss, A., & Chiosi, C. 2000, A&A, 361, 1023
- [91] Salpeter, E. E. 1955, ApJ, 121, 161
- [92] Schiavon, R. P., Faber, S. M., Castilho, B. V., & Rose, J. A. 2002a, ApJ, 580, 850
- [93] Schiavon, R. P., Faber, S. M., Rose, J. A., & Castilho, B. V. 2002b, ApJ, 580, 873
- [94] Searle, L., in “Stellar Populations,” eds. Norman, C. A., Renzini, A., & Tosi, M. (Cambridge: Cambridge University Press), 3
- [95] Searle, L., Wilkinson, A., & Bagnuolo, W. 1980, ApJ, 239, 803 (SWB)
- [96] Smith, G. H., Shetrone, M. D., Briley, M. M., Churchill, C. W., & Bell, R. A. 1997, PASP, 109, 236
- [97] Spinrad, H. 1962a, PASP, 64, 146
- [98] Spinrad, H. 1962b, ApJ, 135, 715
- [99] Spinrad, H. & Taylor, B. J. 1969, ApJ, 157, 1279
- [100] Spinrad, H. & Taylor, B. J. 1971, ApJS, 22, 445
- [101] Strader, J., Brodie, J. P., Forbes, D. A., Beasley, M. A., & Huchra, J. P. 2003a, AJ, 125, 1291
- [102] Strader, J., Brodie, J. P., & Huchra, J. P. 2003b, MNRAS, 339, 707
- [103] Strader, J., Brodie, J. P., Schweizer, F., Larsen, S. S., & Seitzer, P. 2003c, AJ, 125, 626
- [104] Tantalo, R., Chiosi, C., & Bressan, A. 1998, A&A, 333, 419
- [105] Thomas, D., Maraston, C., & Bender, R. 2002, Ap&SS, 281, 371
- [106] Thomas, D., Maraston, C., & Bender, R. 2003a, MNRAS, 339, 897 (TMB03)
- [107] Thomas, D., Maraston, C., & Bender, R. 2003b, MNRAS, in press
- [108] Tinsley, B. M. 1968, ApJ, 151, 547
- [109] Tinsley, B. M. 1972, A&A, 20, 383
- [110] Tinsley, B. M. & Gunn, J. E. 1976, ApJ, 203, 52
- [111] Trager, S. C., Dressler, A., & Faber, S. M. 2003, in preparation
- [112] Trager, S. C., Faber, S. M., & Dressler, A. 2003, in preparation
- [113] Trager, S. C., Faber, S. M., Worthey, G., & González, J. J. 2000a, AJ, 119, 1645
- [114] Trager, S. C., Faber, S. M., Worthey, G., & González, J. J. 2000b, AJ, 120, 165
- [115] Trager, S. C., Worthey, G., Faber, S. M., Burstein, D., & González, J. J. 1998, ApJS, 116, 1
- [116] Tripicco, M. J. & Bell, R. A. 1995, AJ, 110, 3035
- [117] Vader, J. P. 1986, ApJ, 305, 669
- [118] Vader, J. P. 1987, ApJ, 317, 128
- [119] van den Bergh, S. 1969, ApJS, 19, 145
- [120] Vazdekis, A. 1999, ApJ, 513, 224
- [121] Vazdekis, A., Casuso, E., Peletier, R. F., & Beckman, J. E. 1996, ApJS, 106, 307
- [122] Vazdekis, A., Cenarro, A. J., Gorgas, J., Cardiel, N., & Peletier, R. F. 2003, MNRAS, 340, 1317
- [123] Vazdekis, A., Salaris, M., Arimoto, N., & Rose, J. A. 2001, ApJ, 549, 274
- [124] Wampler, E. J. 1966, ApJ, 144, 921
- [125] Weiss, A., Peletier, R. F., & Matteucci, F. 1995, A&A, 296, 73
- [126] Westera, P., Lejeune, T., Buser, R., Cuisinier, F., & Bruzual, G. 2002, A&A, 381, 524
- [127] Whipple, F. L. 1935, Harvard Coll. Obs. Circ., 404, 1
- [128] Williams, T. B. 1976, ApJ, 209, 716
- [129] Worthey, G. 1994, ApJS, 95, 107
- [130] Worthey, G. 1998, PASP, 110, 888
- [131] Worthey, G., Faber, S. M., & González, J. J. 1992, ApJ, 398, 69
- [132] Worthey, G., Faber, S. M., González, J. J., & Burstein, D. 1994, ApJS, 94, 687
- [133] Worthey, G. & Ottaviani, D. L. 1997, ApJS, 111, 377
- [134] Zinn, R. & West, M. J. 1984, ApJ, 55, 45