Observations of the neutral hydrogen surrounding the radio quiet neutron star RX J0822–4300 in Puppis A
Abstract
We have observed the H i distribution in an area around the neutron star candidate RX J0822–4300, which is located in the supernova remnant Puppis A. The observations of the cm line were obtained with the Australia Telescope Compact Array (ATCA) and were combined with single dish data from the Southern Galactic Plane Survey. The spatial resolution is , and the velocity resolution, 1 km s-1. A sensitivity of K was achieved. The results revealed a double lobed feature of reduced emission at +16 km s-1, centered on the central compact object (CCO), and aligned with an H i hole blueshifted by 13 km s-1. The H i depressions have probably been created by the sweeping up of M⊙. The alignement between the lobes and the optical expansion centre of Puppis A suggests that the CCO could be ejecting two opposite jets. The velocity at which the two lobes are best defined allowed us to confirm that the distance to Puppis A is 2.2 kpc, based on a systemic velocity of +16 km s-1. The hydrogen column density computed using this systemic velocity is consistent with estimates from models for X-ray spectra, thus reinforcing our conclusion that the kinematic distance is 2.2 kpc.
keywords:
stars: neutron – supernova remnants – ISM: individual: Puppis A – ISM: jets and outflows – X–rays: individual: RX J0822–4300 – spectral lines: neutral hydrogen.1 Introduction
In recent years, different X-ray missions have revealed a new class of unresolved objects with no radio counterpart and very high X-ray to optical flux ratios. Most of these objects are found in the interior of supernova remnants (SNR). Pavlov et al. (2002) propose four categories for these exotic sources: sources showing pulsations with periods between 6 and 12 seconds are called “anomalous X-ray pulsars” (AXP), or “soft gamma-ray repeaters” (SGR) if bursts of -ray emission have been detected. The remaining sources are called “central compact objects” (CCO) if they are located in the interior of an SNR, and “isolated neutron stars” (INS) if they are not associated with a known SNR.
The nature of CCOs is still not clear. They have been interpreted as young, energetic radio pulsars with unfavourable beaming (Brazier & Johnston, 1999), as neutron stars (NS) with long initial periods and high magnetic fields (Vasisht et al., 1997; Frail, 1998), or as fast spinning objects with low magnetic fields (Geppert, Page & Zannias, 1999). Their X-ray emission is generally explained as thermal radiation from cooling NSs (e.g Zavlin, Trümper & Pavlov 1999), with typical temperatures of a few 106 K, inferred from their thermal spectral characteristics. A review of CCOs has recently been published by Pavlov et al. (2002).
An H i study of the interstellar medium (ISM) towards the SNR G296.5+10.0 revealed that its associated CCO, 1E 1207.4–5209, lies near the centre of a small, elongated depression, about in diameter, or 3.2 pc at an assumed distance of 2.1 kpc (Giacani et al., 2000). The depression has a small line width, less than 2 km s-1, and is deepest at km s-1, in agreement with the systemic velocity of the SNR. Giacani et al. (2000) suggest that the X-ray flux from 1E 1207.4–5209 heats the local gas, providing a hot background against which the colder, foreground H i is seen in absorption. Motivated by this striking discovery, we began a search for similar traces in the neutral gas around other candidate NSs, both isolated or associated with SNRs. In this paper, we report the results obtained for RX J0822-4300, the CCO located in the interior of Puppis A.
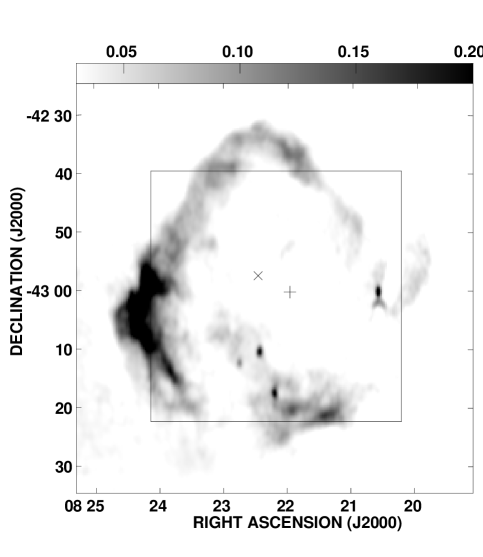
Puppis A (G260.5–3.4) is the remnant of a Type-II supernova explosion which ocurred approximately 3,700 years ago (Winkler et al., 1988). At radio wavelengths, this remnant appears as a distorted shell (Figure 1; Dubner et al. 1991), flattened to the east presumably due to the interaction with an external cloud (Dubner & Arnal, 1988; Reynoso et al., 1995). The most widely accepted distance of 2.2 kpc is derived from the possible association with this cloud at +16 km s-1. However, a recent study based on the OH 1667 MHz line (Woermann, Gaylard & Otrupcek 2000) suggests that the distance to Puppis A could be somewhat smaller, at about 1.3 kpc.
In X-rays, Puppis A appears as an open shell (Petre et al., 1982) with a flattening to the east perfectly interlocking with the eastern cloud at +16 km s-1 (Figure 7 in Reynoso et al. 1995). ROSAT and ASCA observations have revealed an X-ray source near the centre of the shell (Petre, Becker & Winkler 1996). This compact object, RX J0822–4300, is located to the southwest of the kinematical centre of expansion as determined from the proper motion of the fast optical filaments (Winkler & Kirshner, 1985; Winkler et al., 1988). The lack of optical or radio counterparts down to the detection limits strongly suggests that this X-ray source is a NS, while its location suggests a physical association with the SNR Puppis A.
Pavlov, Zavlin & Trümper (1999) reported a marginal detection of pulsations with a periodicity of ms. However, this result has been retracted by Pavlov et al. (2002). A deep search did not detect an associated radio synchrotron nebula (Gaensler, Bock & Stappers 2000a), which may indicate that RX J0822–4300 belongs to a population distinct from young radio pulsars. X-ray spectra from RX J0822–4300 are consistent with those predicted for NSs with a hydrogen atmosphere, having an effective temperature, K and H i column density, cm-2 (Zavlin et al., 1999). This temperature is consistent with standard NS cooling models.
In this paper, we present new H i observations carried out with the Australia Telescope Compact Array (ATCA) of a field of about (inner square in Fig. 1) around the compact source RX J0822–4300. Our goal is to study the H i distribution and kinematics around the CCO, looking for signs of interaction between this source and the surrounding ISM. This study also allows us to revisit the problematic distance to Puppis A.
2 Observations and data reduction
The interferometric observations were obtained with the ATCA during two sessions of 7.5 and 2 h with the 750D array (recording visibilities from baselines 76.5 to 735 m), on 2001 April 27 and 28 respectively, and one session of 12 h with the EW 367 array (with baselines 46 to 367 m) on 2002 March 23. The pointing centre was RA, Dec. (J2000), away from the position of RX J0822–4300 (RA, Dec.; J2000). The correlator configuration used has 1024 channels for a total bandwith of 4 MHz, centered at 1420 MHz. The corresponding velocity resolution is 1 km s-1. A continuum image was obtained simultaneously with a bandwidth of 128 MHz centered at 1384 MHz. The source PKS B1934–638 was used for flux density and bandpass calibration. To calibrate phases two sources were used: PKS B0748–440 for the 2001 sessions, and PKS B0823–500 for the 2002 session.
The data were processed with the MIRIAD software package (Sault, Teuben & Wright, 1995). For the first two hours of the 2001 April 27 session, shadowing affected the correlated data between antennas 1 and 2, and they were deleted. To subtract the continuum component from the H i data set, a linear baseline was fitted to 700 line-free channels. The final H i cube was constructed using the MIRIAD routine INVERT with a 20′′ cell size, retaining 250 channels from –30 to +176 km s-1. Sidelobes were suppressed over an area of . To optimise detection of H i in emission, only spatial frequencies shorter than 1.5 k (315 m) were used. The H i data were convolved with a beam and cleaned to a level of 5 (60 mJy beam-1), where is the noise of the line free channels in the dirty image. The continuum image was constructed with the same geometry and angular resolution as the H i data and a sensitivity of mJy beam-1 (0.5 K) was achieved in the cleaned image.
To recover structures with the shortest spatial frequencies, the ATCA H i data were combined in the u,v plane with single dish (Parkes telescope) data from the Southern Galactic Plane Survey (SGPS; McClure-Griffiths et al. 2001), using the IMMERGE routine. No tapering was applied to the low resolution cube. The rms of the combined cube is K ( mJy beam-1) per channel.
3 Results
To isolate H i absorption due to RX J0822–4300, we compared two profiles: one averaged over the whole area surveyed, and the other taken in a direction towards the CCO. These profiles are shown in Figure 2. In Fig. 2a, the highest emission peak (at km s-1) can be reproduced by the sum of two Gaussian components: one near +3.5 km s-1, probably corresponding to the local Orion arm, and a broader, stronger one, peaking at km s-1. The local distribution of H i at this Galactic longitude is subject to confusion due to the Gum nebula (Reynoso & Dubner, 1997; Woermann, Gaylard & Otrupcek, 2001).
Fig. 2b looks remarkably similar to Fig. 2a except for a dip in the H i emission near km s-1. If the Gaussian distributions shown in Fig. 2a are reproduced in Fig. 2b, the residuals show a negative spike centered at +16.1 km s-1 with a spectral width of 5.4 km s-1. The central velocity of the dip is coincident with the systemic velocity deduced for Puppis A based on a VLA H i study (Reynoso et al., 1995). At this velocity, an H i cloud was found to be interacting with the eastern flank of the radio continuum shell. This cloud was also detected in CO (Dubner & Arnal, 1988).
Figure 3 displays the average H i distribution within 5.4 km s-1 of km s-1. The image shows a pronounced density gradient, weaker in the west. The distribution is consistent with the existence of the eastern cloud and with the morphology of the SNR radio shell. In addition to the H i cavity opening to the west, there is an elongated minimum long, oriented in the NE-SW direction, with a position angle of about 60∘. Strikingly, RX J0822–4300 (indicated by a plus sign) lies near the centre of this H i feature. Two local minima appear inside the elongated feature, one at each side of the CCO. The western minimum is more extended and pronounced than the eastern one. This linear depression has a length of about 8.5 pc at the assumed distance to the SNR of 2.2 kpc, with an average width of 1.6 pc.
Winkler et al. (1988) found that the expansion centre of the O-rich fast filaments in Puppis A lies at RA, Dec. (B1950). In Fig. 3, this position is indicated by a cross. If the expansion centre of the optical filaments pinpoints the site of the SN explosion, it is significant that the eastern lobe is aligned with the path traced from this location to the CCO.
The combination of this evidence suggests that this double-lobed H i structure is not only related to Puppis A but, more specifically, to its CCO. It is well known that H i emission is widespread and it is usual to find structures on all scales at different radial velocities within the Galaxy. For that reason, we have made a careful search of the whole H i cube for features morphologically similar to the double lobed structure. To facilitate this search, an averaged profile over the whole area was computed and subtracted from the H i data. As an example, in Figure 4 we show a set of channels from 7.9 to 20.3 km s-1, after subtraction of the average profile. We did not find any feature similar to the linear depression at km s-1. Hence, it is likely that this elongated structure is related to Puppis A which has a systemic velocity of +16 km s-1. Moreover, the symmetry of the lobes around RX J0822–4300 suggests that the CCO is physically connected to this structure. This can be explained if the gas inside the remnant has a neutral component. There are some mechanisms by which this could happen. White & Long (1991) show that if a SNR is interacting with a dense external medium, as is the case of Puppis A, the shock can propagate through the intercloud medium leaving behind the clouds, still cold and at rest. These clouds gradually evaporate, and in middle-aged SNRs (like Puppis A), the hot post-shock gas can co-exist with dust at less than 100 K. The neutral hydrogen phase of the ISM is typically found at cool temperatures, in the range K, or at warm temperatures of several thousand K. For SNR G296.5+10.0, internal neutral gas is the most probable explanation for the H i depression in which the associated CCO is immersed (Giacani et al., 2000). Assuming that the reduced emission from the lobes is due to absence of material, we estimate that 1.7 M⊙ of neutral hydrogen must have been evacuated.
The inspection of the whole data cube revealed another small depression between +2.2 and +3.8 km s-1, coincident with RX J0822–4300. Figure 5 shows an average of the emission within this velocity interval. The CCO appears to be slightly off-centre from the H i hole (hereafter “central hole”) by (0.4 pc at a distance of 2.2 kpc), analogous to the results for 1E 1207.4–5209 (Giacani et al., 2000), which is off-centre by almost 1 pc. Most of the other minima present in the field are produced through absorption of background continuum emission. This is not the case for the central hole, where no continuum emission is detected to a limit of 20 mJy beam-1 or 1.5 K. It is reasonable to propose that RX J0822–4300 has a direct influence on this H i depression. The alignment observed between this minimum and the lobes (Figure 4) is remarkable. However, it is not clear whether the coincidence in position between the central hole and RX J0822–4300 is a projection effect.
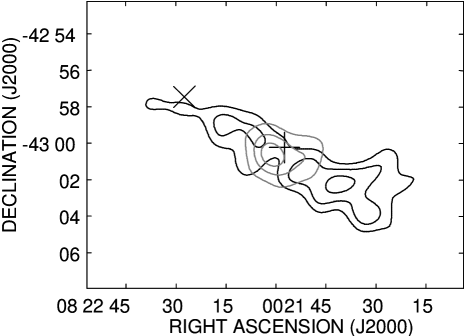
If we assume that the distance to the central hole is the same as the distance to the lobes, 2.2 kpc, the mean diameter of the hole is 1.2 pc (). The ratio between the minor and major axis is 0.7. If we assume that the minimum emission at the hole is due to an absence of neutral hydrogen, then the depleted mass amounts 0.3 M⊙.
4 Discussion
The present H i observations have revealed an intriguing structure consisting of two aligned depressions like lobes. The western one is broader and deeper than the eastern lobe, consistent with effects expected from the general density gradient of gas at the distance of Puppis A (Dubner & Arnal, 1988; Reynoso et al., 1995). In the previous section, we pointed out that the elongated H i feature has : (a) the same systemic velocity as that of Puppis A, (b) alignment with the compact source RX J0822–4300, which lies between the two lobes, and (c) the same orientation as a line from the optical expansion centre of Puppis A to the CCO. These three points, together with the absence of similar features at other velocities, strongly suggest that this H i structure is associated with RX J0822–4300, either related to the past history (translation from the expansion centre to the present location) or with currently ongoing activity (e.g. mass ejection). However, the central hole, although positionally coincident with RX J0822–4300 (Fig. 5), is at a different velocity to the lobes.
4.1 The origin of the H i structure
Brazier & Johnston (1999) propose that radio quiet NSs are normal pulsars which are not beamed towards the observer. From a theoretical point of view, the rotational energy loss of a young pulsar is converted into a relativistic wind of electron-positron pairs coupled with the ambient magnetic field which, when confined by the high-pressure inside a SNR, generates a synchrotron emitting nebula. At present, 13 out of 15 pulsars associated with Galactic SNRs are known to have created pulsar wind nebulae (PWN) (Gaensler et al., 2000b; Giacani et al., 2001; Kaspi & Helfand, 2002), while H bow-shock nebulae have been detected around five NSs (Chatterjee & Cordes 2002 and references therein). It is expected that the local distribution of neutral gas might show the effect of the injection of particles and energy from the neutron star. This could be manifest as ionization of gas or bulk sweeping up of low density gas to the boundaries of the possible jets or outflows. The absence of detected radio continuum emission from ionized gas supports to the second hypothesis.
We have compared the H i structure with the ROSAT image of Puppis A (Figure 7). No X-ray enhancement can be detected at the position of the H i depressions, as would be expected if the gas had been heated to K. Moreover, the X-ray emission appears to be enhanced along the periphery of the H i structure, mainly at the end of the eastern lobe.
The morphology strongly suggests that the lobes represent jets or collimated outflows ejected by RX J0822–4300. Synchrotron nebular tails interpreted as jets associated with pulsars have been detected both in X-rays and in radio continuum (e.g. PSR B1757–24, Kaspi et al. 2001). In some cases, like PSR B1509–58 in G320.4–1.2 (Gaensler et al., 1999, 2002), the radio continuum is enhanced at both sides of the X-ray features. In these cases, the radio synchrotron emission is thought to originate in a cylindrical sheath around a hot, thermal X-ray jet (Hjellming & Johnston, 1988; Frail et al., 1997), where particle acceleration might occur via laterally expanding shocks. Such lateral shocks could account for the H i emission feature detected at an anomalous velocity (Dubner et al., 2002) aligned with the X-ray jet in G320.4–1.2. In most cases, the collimated outflows are believed to be directed along the pulsar’s spin axis (Hester et al., 1995; Gaensler et al., 2002). The process by which jets are produced is not well understood.
Dodson et al. (2003) discovered two aligned lobes in radio continuum centered on the Vela pulsar, with a morphology very similar to the double lobed H i structure detected here. Two opposing X-ray jets are aligned in the direction of the proper motion of the Vela pulsar (Helfand, Gotthelf & Halpern, 2001; Pavlov et al., 2000, 2003). However, the radio continuum double lobed structure is almost prependicular to this axis (Dodson et al., 2003). The fact that the jets align with the proper motion is not coincidental, and has implications for formation models of neutron stars. The radio luminosity of the two lobes is only the spin down energy of the pulsar. The morphological similarity between the double lobed structures in Vela and RX J0822–4300 is suggestive of a common origin, yet their different orientation with respect to the proper motion of the NS is difficult to interpret.
There are also problems in trying to interpret the two H i lobes as jets. First, jets have velocities of at least a few thousand km s-1 (Frail et al., 1997; Kaspi et al., 2001), which seems incompatible with the narrow spectral width of the H i structure. Also, jets are usually less than 1 pc in extension, unlike the H i lobes. Rather, the lobes are comparable in size with typical PWN (Petre, Kuntz & Shelton, 2002). It has been suggested that the motion of the pulsar might determine the morphology of the surrounding ISM with the pulsar lying at the apex of a nebula emitting in radio or X-rays (e.g. W44, Frail et al. 1996; IC 443, Olbert et al. 2001). Such a scenario for RX J0822–4300 is unlikely since it cannot explain either the western lobe or the central hole. However, it is possible that two effects are combined: the ejection of two opposing jets into a medium in turn modified by the passage of the CCO.
Undoubtedly, the main difficulty with trying to explain the double lobed feature as an energetic pulsar phenomenon is the lack of any significant radio or X-ray counterpart. If RX J0822–4300 were a normal pulsar, the non-detection of a radio continuum counterpart to the H i structure could be explained by the inefficiency in converting into detectable radio emission. The lack of detection of any pulsation or PWN associated with RX J0822–4300, probably (but not necessarily) means that this source is not a high pulsar. Developing a detailed explanation to account for the H i double lobed structure discovered here constitutes a challenge that could help to interpret the nature of unconventional neutron stars.
4.2 The distance to Puppis A
The distance to Puppis A of kpc was determined based on a systemic velocity of +16 km s-1 obtained in a VLA H i absorption study (Reynoso et al., 1995). Additional determinations based on the proper motion of optical filaments (Dechristopher & Winkler, 1994) and on a possible association with Vela OB1 (Sakhinov & Smirnov, 1983), yielded a distance of 1.9 kpc, in good agreement with the previous value. However, an OH 1667 MHz study (Woermann et al., 2000) casts doubt on this value of 2.2 kpc. The OH spectra show absorption lines at velocities less than +7.6 km s-1 and emission lines above this velocity. If the systemic velocity of Puppis A is indeed +7.6 km s-1, then the kinematic distance would be 1.3 kpc, after applying the Galactic rotation model of Fich, Blitz & Stark (1989).
To clarify this issue, we analyzed the H i column densities obtained by integrating the brightness temperature in two velocity ranges: from to km s-1, and from to km s-1. The two column densities obtained are and cm-2 respectively. There are no previous direct measurements of this quantity. We recall that these values are lower limits, since they rely on the assumption that the H i emission is optically thin. Aschenbach (1993) analyzed the diffuse X-ray emission from Puppis A and concluded that cm-2. Fitting atmosphere models to RX J0822–4300, Zavlin et al. (1999) obtain a 90% confidence range of cm-2, consistent with the cm-2 range inferred by Winkler et al. (1981) based on X-ray emission lines of O vii and O viii. From the fitted H i column density, Zavlin et al. (1999) infer a distance of between 1.9 and 2.5 kpc to Puppis A.
The agreement of the higher obtained by us with these previous estimates provides supporting evidence for the choice of +16 km s-1 as the systemic velocity for Puppis A. The only support for the lower value of is the column density of cm-2 estimated by Diplas & Savage (1994), based on Ly observations towards the nearby star HD 69882. Since this star is almost away from RX J0822–4300, this result may not be relevant. The column density estimated here when integrating from to km s-1 not only supports the previously accepted kinematic distance of 2.2 kpc but also excludes the power-law fitted by Zavlin et al. (1999) to the X-ray spectra of RX J0822–4300, which requires that cm-2.
In addition to the agreement in column densities, another argument in favour of the systemic velocity of +16 km s-1 for Puppis A is provided by the velocity at which the double lobed H i structure appears. Woermann et al. (2000) found that their results are compatible with a similar excitation temperature for the two spectral components in OH towards Puppis A at +3.5 and +13 km s-1. Given these assumptions, the second component must necessarily lie behind Puppis A in order to appear in emission. However, there is no direct evidence to suggest that the two components do, in fact, have the same excitation temperatures. Moreover, since the assumed excitation temperature ( K) is quite close to the brightness temperature of the continuum background (3.4 K off source; K on source), a small change in the excitation temperature (to K), would lead to an emission line at +13 km s-1, even if the OH line arises in molecular gas in front of the SNR. Such a condition would have been revealed by subtracting an “expected” profile from the OH spectra towards Puppis A.
5 Conclusions
We have found a second example of a CCO which appears to have modified the surrounding neutral gas. The CCO is RX J0822–4300 and the host SNR is Puppis A. The first example reported is 1E 1207.4–5209 in the SNR G296.5+10.0 (Giacani et al., 2000). For both cases, the CCO lies near the centre of an H i depression. In the case of Puppis A, the depression consists of two lobes, located on either side of the CCO, with possibly a blue-shifted hole, similar to that found at the position of 1E 1207.4–5209. This structure appears to be formed by the ejection of two opposing, collimated jets. This hypothesis is based on the assumption that the explosion site of Puppis A is coincident with the expansion centre of optical features suggested by Winkler et al. (1988). The proper motion of RX J0822–4300 is estimated to be arcsec yr-1. X-ray observatories currently in progress should be able to measure within the next few years if the CCO has moved from the present position, providing evidence to test this hypothesis. Observations of H i carried out with higher spatial resolution, and more sensitive X-ray observations, would be very valuable in searches for collimated outflows ejected from the CCO. The present H i observations have been used to confirm the distance of 2.2 kpc to Puppis A, derived in an earlier VLA H i absorption study (Reynoso et al., 1995). This estimate is based on a systemic velocity of km s-1 of the double lobed structure, and reinforced by the agreement between the value for the H i column density obtained by integrating the H i emission from –10 to +16 km s-1, with those derived from models for X-ray spectra (Winkler et al., 1981; Zavlin et al., 1999).
Acknowledgments
We are grateful to Naomi McClure-Griffiths, who provided data from the SGPS and assisted with their amalgamation into the ATCA data; and to Jim Caswell, Pablo Velázquez and Beate Woermann for helpful discussions. This research was partially funded through CONICET grant 4203/96, UBACYT grant A013 and by the Australian Research Council. The Australia Telescope Compact Array is funded by the Commonwealth of Australia for operation as a National Facility by CSIRO. The National Radio Astronomy Observatory is a facility of the National Science Foundation operated under a cooperative agreement by Associated Universities, Inc.
References
- Aschenbach (1993) Aschenbach B., 1993, Adv. Space Res., 13(12), 45
- Brazier & Johnston (1999) Brazier K. T. S., Johnston S., 1999, MNRAS, 305, 671
- Chatterjee & Cordes (2002) Chatterjee, S., Cordes, J. M., 2002, ApJ, 575, 407
- Dechristopher & Winkler (1994) Dechristopher B. M., Winkler P. F., 1994, BAAS, 26, 951
- Diplas & Savage (1994) Diplas A., Savage B. D., 1994, ApJS, 93, 211
- Dodson et al. (2003) Dodson, R. Lewis, D., McConnell, D., Deshpande, A. A., 2003, astro-ph/0302373
- Dubner & Arnal (1988) Dubner G. M., Arnal E. M., 1988, A&AS, 75, 363
- Dubner et al. (1991) Dubner G. M., Braun R., Winkler P. F., Goss W. M., 1991, AJ, 101,1466
- Dubner et al. (2002) Dubner G. M., Gaensler B. M., Giacani E. B., Goss W. M., Green A. J., 2002, AJ, 123, 337
- Fich, Blitz & Stark (1989) Fich M., Blitz L., Stark A. A., 1989, ApJ, 342, 272
- Frail (1998) Frail D. A., 1998, in The Many Faces of Neutron Stars, ed. R. Buccheri, J. van Paradijs, & M. A. Alpar (NATO ASI Ser. C, 515; Dordrecht: Kluwer), 179
- Frail et al. (1996) Frail D. A., Giacani E. B., Goss W. M., Dubner G. M., 1996, ApJ, 464, L165
- Frail et al. (1997) Frail D. A., Bietenholz M. F., Markwardt C. B., Ögelman H., 1997, ApJ, 475, 224
- Gaensler et al. (1999) Gaensler B. M., Brazier K. T. S., Manchester R. N., Johnston S., Green A. J., 1999, MNRAS, 305, 724
- Gaensler et al. (2000a) Gaensler B. M., Bock D. C.-J., Stappers B. W., 2000a, ApJ, 537, L35
- Gaensler et al. (2000b) Gaensler B. M., Stappers B. W., Frail D. A., Moffett D. A., Johnston S., Chatterjee S., 2000b, MNRAS, 318, 58
- Gaensler et al. (2002) Gaensler B. M., Arons J., Kaspi V. M., Pivovaroff M. J., Kawai N., Tamura K., 2002, ApJ, 569, 878
- Geppert, Page & Zannias (1999) Geppert, U., Page D., Zannias T., 1999, A&A, 345, 847
- Giacani et al. (2000) Giacani E. B., Dubner G. M., Green A. J., Goss W. M., Gaensler B. M., 2000, AJ, 119, 281
- Giacani et al. (2001) Giacani, E. B., Frail, D. A., Goss, W. M., Vieytes, M., 2001, AJ, 121, 3133
- Helfand, Gotthelf & Halpern (2001) Helfand, D. J., Gotthelf, E. V., Halpern, J. P., 2001, ApJ, 556, 380
- Hester et al. (1995) Hester J. J., et al., 1995, ApJ, 448, 240
- Hjellming & Johnston (1988) Hjellming R. M., Johnston K. J., 1988, ApJ, 328, 600
- Kaspi et al. (2001) Kaspi V. M., Gotthelf E. V., Gaensler B. M., Lyutikov M., 2001, ApJ, 562, L163
- Kaspi & Helfand (2002) Kaspi, V. M., Helfand, D. J., 2002, in Neutron Stars in Supernova Remnants, ASP Conf. Ser., Vol. 271, eds. P. O. Slane and B. M. Gaensler, p247 (astro-ph/0112322)
- McClure–Griffiths et al. (2001) McClure–Griffiths N. M., Green A. J., Dickey J. M., Gaensler B. M., Haynes R. F., Wieringa M. H. 2001, ApJ, 551, 394
- Olbert et al. (2001) Olbert C. M., Clearfield C. R., Williams N. K., Keohane J. W., Frail D. A., 2001, ApJ, 554, L205
- Pavlov et al. (1999) Pavlov G. G., Zavlin V. E., Trümper J., 1999, ApJ, 511, L45
- Pavlov et al. (2000) Pavlov, G.G., Sanwal, D., Garmire, G. P., Zavlin, V. E., Burwitz, V., Dodson, R. G., 2000, BAAS, 196, 37.04
- Pavlov et al. (2002) Pavlov, G. G., Sanwal, D., Garmire, G. P., Zavlin, V. E., 2002, in Neutron Stars in Supernova Remnants, ASP Conf. Ser., Vol. 271, eds. P. O. Slane and B. M. Gaensler, p247 (astro-ph/0112322)
- Pavlov et al. (2003) Pavlov G. G., Teter, M. A., Kargaltsev, O., Sanwal D., 2003, astro-ph/0305510
- Petre, Kuntz & Shelton (2002) Petre, R., Kuntz, K. D., Shelton, R. L., 2002, ApJ, 579, 404
- Petre et al. (1982) Petre R., Kriss G. A., Winkler P. F., Canizares C. R., 1982, ApJ, 258, 22
- Petre et al. (1996) Petre R., Becker C. M., Winkler P. F., 1996, ApJ, 465, L43
- Reynoso & Dubner (1997) Reynoso E. M., Dubner G. M., 1997, A&AS, 123, 31
- Reynoso et al. (1995) Reynoso E. M., Dubner G. M., Goss W. M., Arnal E. M., 1995, AJ, 110, 318
- Sakhinov & Smirnov (1983) Sakhibov F., Kh., Smirnov M. A., 1983, SvA, 27, 395
- Sault, Teuben & Wright (1995) Sault R. J., Teuben P. J., Wright M. C. H., 1995, in ASP Conf. Ser. 77, Astronomical Data Analysis Software and Systems IV, ed. R. A. Shaw, H. E. Payne, & J. J. E. Hayes (San Francisco: ASP), 433
- Vasisht et al. (1997) Vasisht G., Kulkarni S. R., Anderson S. B., Hamilton T. T., Kawai N., 1997, ApJ, 476, L43
- White & Long (1991) White R. L., Long K. S., 1991, ApJ, 373, 543
- Winkler et al. (1981) Winkler P. F., Canizares C. R., Clark G. W., Markert T. H., Petre R., 1981, ApJ, 245, 574
- Winkler & Kirshner (1985) Winkler P. F., Kirshner R. P., 1985, ApJ, 299, 981
- Winkler et al. (1988) Winkler P. F., Turtle J. H., Kirshner R. P., Irwin M. J., 1988, in Supernova Remnants and the Interstellar Medium, eds. R. S. Roger and T. Landecker (Cambridge University Press, Cambridge), p65
- Woermann et al. (2000) Woermann B., Gaylard M. J., Otrupcek R., 2000, MNRAS, 317, 421
- Woermann, Gaylard & Otrupcek (2001) Woermann B., Gaylard M. J., Otrupcek R., 2001, MNRAS, 325, 1213
- Zavlin et al. (1999) Zavlin V. E., Trümper J., Pavlov G. G., 1999, ApJ, 525, 959