Observational evidence for a correlation between peak-luminosities and beaming in GRBs
Abstract
We calculate the unseen-but-true GRB-event rate from a current flux-limited sample of 33 GRBs with individually measured redshifts. We consider a GRB-event rate which is proportional to the star-formation rate, in view of the GRB-SNe association in SN1998bw and GRB030329. By fitting a log-normal distribution of GRB peak-luminosities, we find a ratio for the true-to-observed GRB-event rates. This provides an independent derivation of the GRB-beaming factor obtained by Frail et al. (2001) from sources with standard GRB-energies. We discuss applications to GRB980425.
1 Introduction
New clues are emerging that long GRB are associated with supernovae (Galama et al., 1998; Bloom et al., 1999; Kulkarni et al., 2000; Reichart, 2001). This is illustrated most recently by optical emissions lines in the late-time light-curve of the HETE-II burst GRB 030329 (Stanek et al., 2003), which are remarkably similar to those observed in GRB980425/SN1998bw (Galama et al., 1998). A GRB-supernova assocation provides important support for the collapsar model of GRBs, representing a violent death of evolved massive stars (Woosley, 1993; Paccynski, 1998). The short lifespan of tens of Myrs of massive stars implies that GRBs take place in star-forming regions (Paccynski, 1998; Fruchter et al., 1999), and hence more broadly points towards an association to molecular clouds. The event rate of GRBs per unit cosmological volume is hereby expected to be correlated to the cosmic star-formation rate (e.g., Blain & Natarajan (2000); Berger et al. (2003); Choudhury & Srianand (2002)). Because observations by past and current experiments (see Table I) are flux-limited, the observed GRB-event rate is strongly biased towards events at lower redshifts.
In this letter, we calculate the ratio of unseen-to-observed GRBs. Our analysis is based on the bias in the observed GRB-event rate towards low redshift events in a flux-limited sample of 33 GRBs with individually measured redshifts. We propose to use a linear relationship for the correlation between the true-but-unseen GRB event rate and the cosmic SFR, to derive from this bias a best-fit log-normal GRB peak-luminosity function. While it is an open question to what the degree cosmological evolution of metallicity affects the SFR independently of the GRB event rate (see, e.g., Heger et al. (2002)), linear relationship between the two will serve as a leading-order approximation.
In §2, we discuss the cosmological model. §3 tabulates the current sample of 33 GRBs with individually measured redshifts. In §4, we present the best fit of the data for a log-normal distribution function, estimate the fraction of unseen-to-observed GRBs, and compare our results with the beaming factor of Frail et al.(2001), based on a sample of GRBs with achromatic breaks in their light-curves. We summarize our results and draw our main conclusions in §5.
2 The cosmological model
We model the intrinsic GRB-event rate in a flat -dominated cold dark matter cosmology with closure energy densities = 0.70 and = 0.30. These values are suggested by BOOMERANG and MAXIMA (de Bernardis et al., 2000; Hanany et al., 2000) on the power spectra of the CMB and distant Type Ia SNe (Perlmutter et al., 1999; Schmidt et al., 1998). The Hubble parameter Ho is taken to be (Freedman et al., 2001).
Porciani & Madau (2001) provide three models of the cosmic SFR up to redshifts , reflecting some uncertainties in SFR estimates. No significant changes have been noticed in application of these three models, and we present only results derived from the second model, SFR2. We have
| (1) |
by transformation of the in a matter-dominated unverse (),
| (2) |
where .
For a GRB-event rate locked to the SFR, the true event rate between and , as observed in the observer’s frame of reference, satisfies
| (3) |
where is the formation mass fraction of the source progenitors. Here, the division by accounts for time-dilatation by cosmic expansion. The element of comoving volume is
| (4) |
The GRB redshift probability density can be written as (Coward et al., 2002) Assuming that the mass fraction of GRBs progenitors is redshift independent, the scaling factor is the only free parameter of our model. For the flux-limited experiments listed in Table I we define a probability-density function of detection as a function of redshift as where the dependence on the luminosity has been integrated out in the detected event rate (Bromm & Loeb, 2002)
| (5) |
Here, refers to the intrinsic GRBs luminosity function in the BATSE energy range keV.
The luminosity threshold as a function of redshift is given by , where is the luminosity distance to a source at redshift and where denotes the sensitivity threshold of the instrument. Following (Bromm & Loeb, 2002), we take a flux-density threshold of BASTE of 0.2 .
3 A redshift sample of 33 GRBs
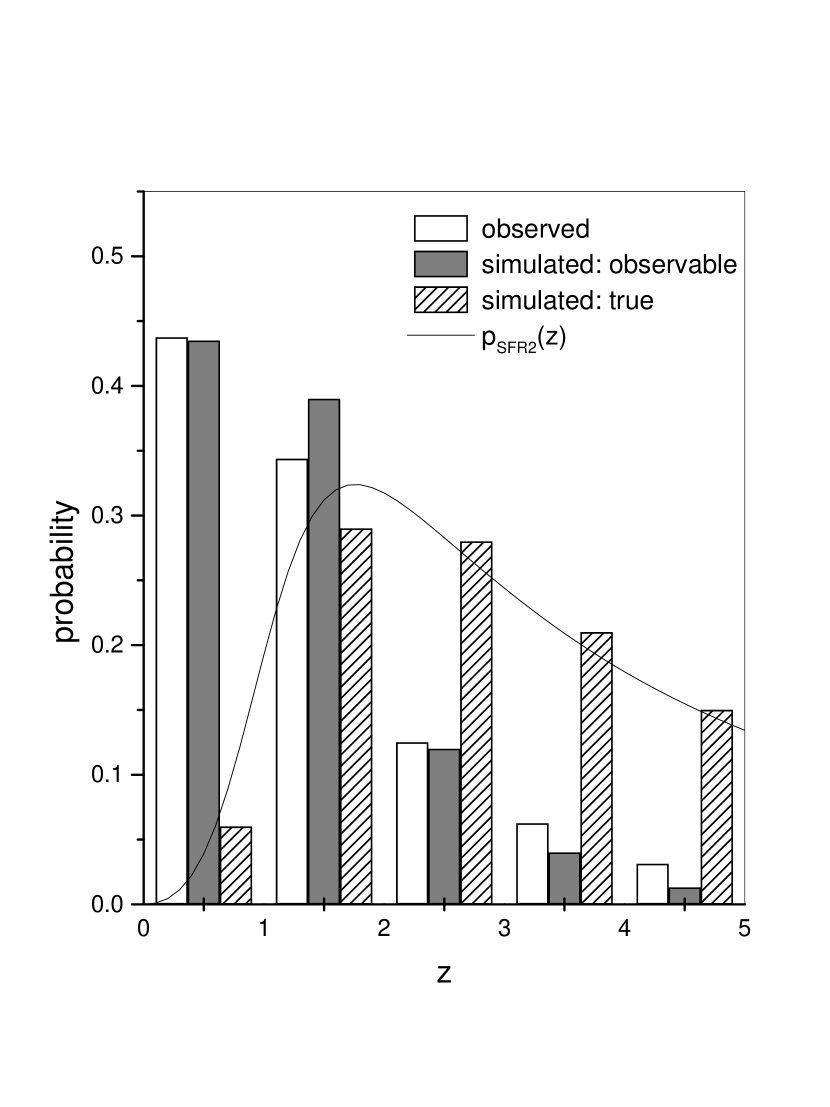
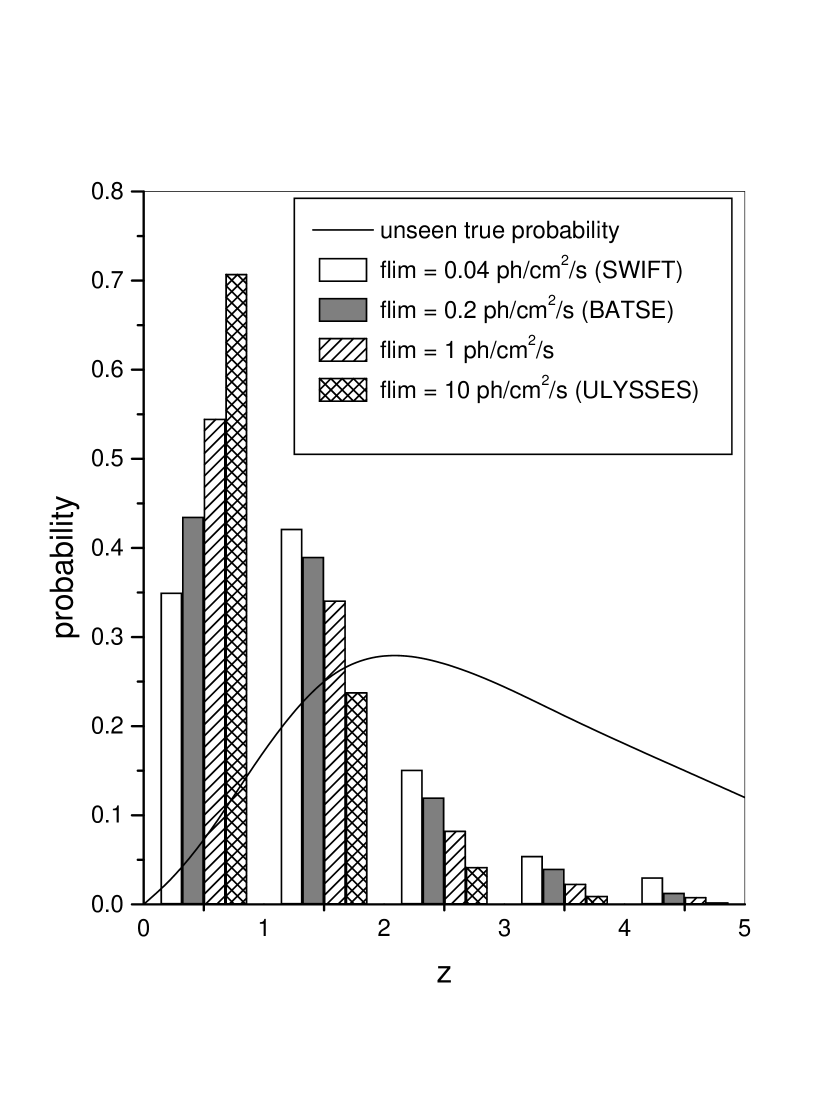
As of the time of this writing, we have 33 GRBs with individually measured redshifts (Table I). They collectively represent a variety of past and current experiments. Due to a flux threshold in each of the instruments used, the observed GRB redshift distribution is strongly biased towards low redshifts. This introduces a quantitative selection effect, relative to the redshift distribution predicted by the SFR model (Fig. 1) – the true distribution of GRB-redshifts representing what would be observed in the ideal case of a zero-flux threshold in the instruments. In view of the various instruments involved, the dependency of the observed GRB redhift-distribution function on the flux-limit is simulated in Fig. 2.
4 A fit to a log-normal distribution function
We shall assume that the GRB-luminosity function is redshift independent, i.e., without cosmological evolution of the nature of its progenitors. We take a log-normal probability density for the luminosity shape-function, with mean and width given by
| (6) |
where is normalized with respect to 1cm-2s-1. The optimized parameters of our model are
| (7) |
This notation means that the estimated parameters can be either (122,3.4), (123,3.2), (125,2.8), or (126,2.6), but not (122,2.6) for instance. Our results are compatible to the expectations of Sethi et Bhargavi (2001) who derive a log-normal luminosity function with and from a different flux-limited sample. They mentioned that because of selection effects, the inferred average luminosity over-estimates the true mean luminosity by a factor of 2 or 3, and the variance is within 40-50% of the true variance. The observed and predicted redshift distribution, based on the SFR, are shown in Fig. 1 in case of optimal parameters (7). The results indicate a good fit to the data, suggesting that selection effects are adequaly modeled. The fraction of detectable GRBs as a function of redshift
| (8) |
shows a the steep decrease as the luminosity threshold increases, making high-redshift GRBs less likely to be detected.
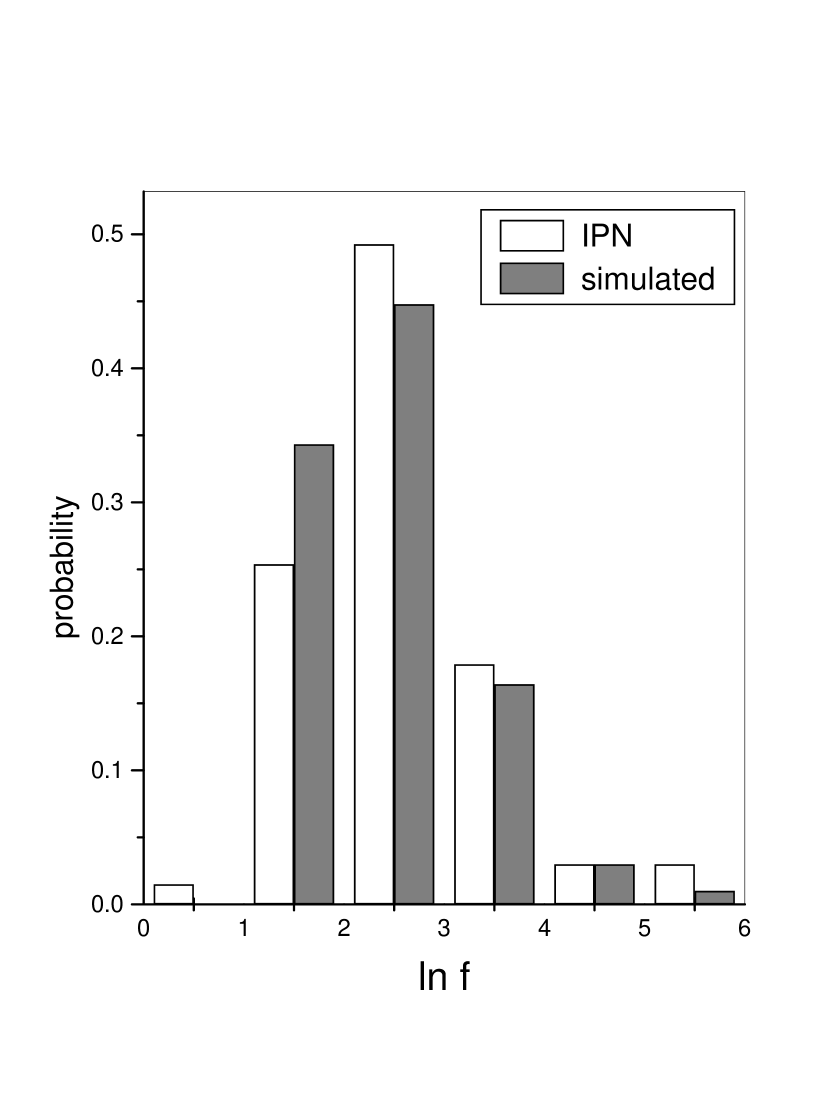
A satisfactory test for our model is provided by comparing the predicted flux distribution of GRBs above the sensitivity threshold with the peak flux distribution of a sample of 67 GRBs observed with IPN (Fig. 3). The fluxes derived from our luminosity function in 50-300 keV have been extrapolated to the IPN range of 25-100 keV, assuming an energy spectrum and using the formula given in Appendix B of Sethi et Bhargavi (2001). The conversion factor from to has been taken to be , and the sensitivity threshold equal to 5 (Hurley, private communication).
5 A correlation between and
Our estimate of the true-to-observed GRB-event rate is strikingly similar to the GRB-beaming factor of about 500 derived by Frail et al. (2001). Our analysis is independent of the mechanism providing a broad distribution in GRB luminosities. Without further input, our results may reflect (a) isotropic sources with greatly varying energy output, (b) beamed sources with standard energy output and varying opening angles, or (c) anisotropic but geometrically standard sources (Rossi et al., 2002; Zhang & Meszaros, 2002).
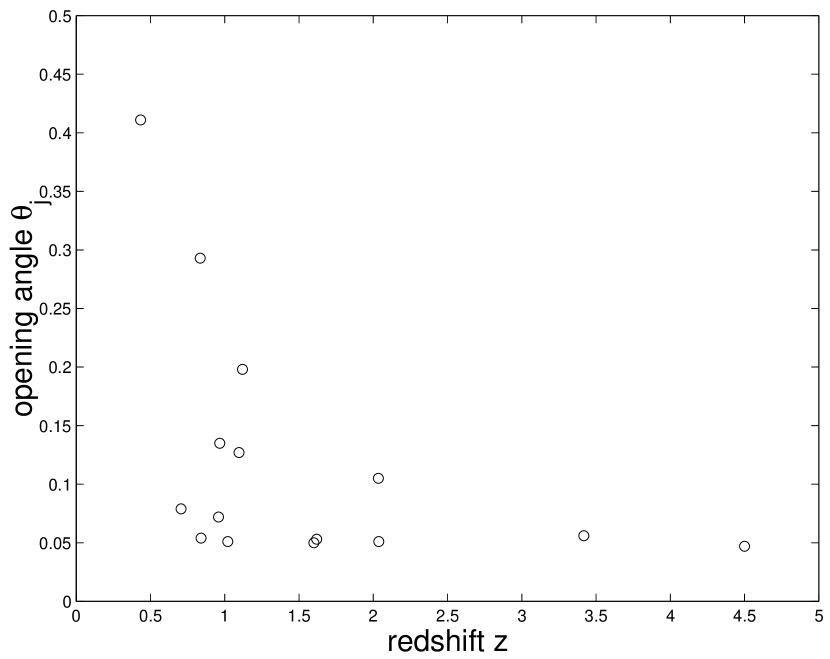
We find that the GRB peak-luminosities and beaming are correlated. To see this, we simply note that the case of no correlation between peak-luminosities and beaming give rise to an unseen-but-true GRB event rate which is times the observed rate. The true GRB-event rate hereby approaches that of Type II supernovae – we discard this possibility. A correlation between peak-luminosities and beaming is naturally expected sources (b) and (c) with standard energy output – the picture that bears out of Frail et al. (2001). This introduces a correlation between peak-luminosity and beaming factor in (b) and, for a flux-limited sample, also in (c). For a flux-limited sample, both (b) and (c) give rise to an anticorrelation between inferred beaming and distance such that to leading-order const. Fig. 4 shows that this anticorrelation holds in the sample of Frail et al. (2001). For a related discussion on estimating the GRB beaming factor from flux limited surveys, see Levinson et al. (2002).
6 Conclusions
A table of 33 GRBs with individually determined redshifts allows an estimate of the GRB-luminosity function, based on constant of proportionality between the GRB event rate and the cosmic star-formation rate. We have tested our fit by reproducing the distribution of peak luminosities in the IPN sample of 67 GRBs.
A flux-limited sample introduces a ratio of unseen GRBs, whose emissions fall below the detector threshold, to observed GRBs. A best fit analysis of the luminosity function gives . This number is both large and close to the GRB beaming factor of 500. The possibility that and are uncorrelated gives rise to prohibitively large true GRB event rates, and is discarded. The results support a relation between the peak-luminosity and the beaming factor in the context of conical or anisotropic GRB-emissions with standard GRB-energies. This points towards an anticorrelation between distance and half-opening angle, which is approximately supported by the sample of Frail et al. (2001).
The results presented here and those of Frail et al. (2001) indicate a true GRB event rate of 1 per year within Mpc. GRB980425/SN1998bw () is consistent with this true event rate. For anisotropic but geometrically standard sources, GRB980425 is hereby not anomalous, but consistent with the trend shown in Fig. 4.
References
- Berger et al. (2003) Berger, E., et al., 2003, ApJ, 588, 99
- Blain & Natarajan (2000) Blain, A.W., & Natarajan, P., 2000, MNRAS, 312, L39
- Bloom et al. (1999) Bloom, J.S., et al, 1999, Nature, 401, 453
- Bromm & Loeb (2002) Bromm, J.S & Loeb, A., 2002, ApJ, 575, 111
- Choudhury & Srianand (2002) Choudhury, T.R., & Srianand, R., 2002, MNRAS, 336, L27
- Coward et al. (2002) Coward, D.M., Burman, R.R., Blair, D.G., 2002, MNRAS, 329, 411
- de Bernardis et al. (2000) de Bernardis, P., et al, 2000, Nature 404, 995
- Frail et al. (2001) Frail, D.A., et al., 2001, ApJ, 562, L55
- Freedman et al. (2001) Freedman W., et al., 2001, Astrophys. J. 553, 47
- Fruchter et al. (1999) Fruchter, A.S., et al., 1999, ApJ, 519, L13
- Galama et al. (1998) Galama, T.J, et al, 1998, Nature, 395, 670
- Hanany et al. (2000) Hanany, S., et al, 2000, ApJ, L545, 5
- Heger et al. (2002) Heger, A., Fryer, C.L., Woosley, S.E., Langer, N., & Hartmann, D.H., 2002, submitted (astro-ph/0212469)
- Kulkarni et al. (2000) Kulkarni, S.R., et al, 2000, Proc.SPIE, 4005, 9
- Levinson et al. (2002) Levinson, A., Ofek, E., Waxman, E., Gal-Yam, A., 2002, ApJ, 576, 923
- Perlmutter et al. (1999) Perlmutter, S., et al, 1999, ApJ, 517, 565
- Porciani & Madau (2001) Porciani, C., & Madau, P., 2001, ApJ, 548, 522
- Paccynski (1998) Paczynsky B., 1998, ApJ, 494, L45
- Reichart (2001) Reichart, D.E., 2001, ApJ, 554, 643
- Rossi et al. (2002) Rossi, E., Lazzati, D., & Rees, M.J., 2002a, MNRAS, 332, 945
- Schmidt et al. (1998) Schmidt, B., et al, 1998, ApJ, 507, 46
- Sethi&Bhargavi (2001) Sethi, & Bhargavi, 2001, A&A, 376, 10
- Stanek et al. (2003) Stanek, K.Z., et al., 2003, astro-ph/0304173
- Woosley (1993) Woosley, S., 1993, ApJ, 405, 273
- Zhang & Meszaros (2002) Zhang, B., & Meszaros, P., 2002, ApJ, 571, 876
| GRB | Redshift | Photon fluxbbin cm-2s-1 | Luminosity ccPhoton luminosities in s-1 derived from the measured redshifts and observed gamma-ray fluxes for the cosmological model described in §2 | ddOpening angles in the GRB-emissions refer to the sample listed in Table I of Frail et al.(2001). | Instrument |
|---|---|---|---|---|---|
| 970228 | 0.695 | 10 | SAX/WFC | ||
| 970508 | 0.835 | 0.97 | 0.293 | SAX/WFC | |
| 970828 | 0.9578 | 1.5 | 0.072 | RXTE/ASM | |
| 971214 | 3.42 | 1.96 | SAX/WFC | ||
| 980425 | 0.0085 | 0.96 | SAX/WFC | ||
| 980613 | 1.096 | 0.5 | SAX/WFC | ||
| 980703 | 0.966 | 2.40 | 0.135 | RXTE/ASM | |
| 990123 | 1.6 | 16.41 | 0.050 | SAX/WFC | |
| 990506 | 1.3 | 18.56 | BAT/PCA | ||
| 990510 | 1.619 | 8.16 | 0.053 | SAX/WFC | |
| 990705 | 0.86 | 0.054 | SAX/WFC | ||
| 990712 | 0.434 | 11.64 | SAX/WFC | ||
| 991208 | 0.706 | 11.2* | Uly/KO/NE | ||
| 991216 | 1.02 | 67.5 | 0.051 | BAT/PCA | |
| 000131 | 4.5 | 1.5* | Uly/KO/NE | ||
| 000210 | 0.846 | 29.9 | SAX/WFC | ||
| 000301C | 0.42 | 1.32* | 0.105 | ASM/Uly | |
| 000214 | 2.03 | SAX/WFC | |||
| 000418 | 1.118 | 3.3* | 0.198 | Uly/KO/NE | |
| 000911 | 1.058 | 2.86 | Uly/KO/NE | ||
| 000926 | 2.066 | 10* | 0.051 | Uly/KO/NE | |
| 010222 | 1.477 | SAX/WFC | |||
| 010921 | 0.45 | HE/Uly/SAX | |||
| 011121 | 0.36 | 15.04* | SAX/WFC | ||
| 011211 | 2.14 | SAX/WFC | |||
| 020405 | 0.69 | 7.52* | Uly/MO/SAX | ||
| 020813 | 1.25 | 9.02* | HETE | ||
| 021004 | 2.3 | HETE | |||
| 021211 | 1.01 | HETE | |||
| 030226 | 1.98 | 0.48* | HETE | ||
| 030323 | 3.37 | 0.0048* | HETE | ||
| 030328 | 1.52 | 2.93* | HETE | ||
| 030329 | 0.168 | 0.0009* | HETE |
Figure Captions
Figure 1. Shown are three redshift distributions: the observed sample derived
from Table 1 (white), the true sample assuming the GRB event rate is
locked to the star-formation rate (hachured), and the sample of detectable
GRBs predicted by our model according to a log-normal peak-luminosity distribution
function (grey). The continuous line represents the cosmic star formation rate
according to a dominated cold dark matter universe.
Figure 2. Shown is a simulation of the redshift distribution of the
observed GRBs as a function of flux-limit, corresponding to various
instruments including the upcoming SWIFT mission. The results are
derived assuming the GRB event rate to be locked to the star-formation
rate, using the best fit log-normal peak-luminosity distribution function
used in Fig. 2. HETE-II tresholds are 0.21 (SXC), 0.07 (WXM) and 0.3 (FREGATE)
in units of cm-2s-1.
Figure 3. Shown is a comparison between the flux distributions
derived from our model (in grey) and from a sample of 67 GRBs
observed with IPN (in wite). The fit serves as a test for
our model assumptions, namely a log-normal GRB-luminosity
function and a GRB event rate locked to the star-formation rate.
Figure 4. Shown is a plot of the opening angle of GRB-emissions
versus redshift in the sample of Frail et al. (2001), as derived from achromatic breaks
in the GRB light curves. These results indicate an anticorrelation
between and . For standard GRB-energies, this introduces a peak-luminosity
function of GRBs which is correlated with the beaming factor . This
allows the beaming factor to be determined also in terms of the ratio of the
unseen-but-true GRB event rate to the observed GRB event rate, using the current
flux-limited sample of 33 GRBs with individually measured redshifts.