A high spatial resolution X-ray and H study of hot gas in the halos of star-forming disk galaxies. II. Quantifying supernova feedback
Abstract
We investigate how the empirical properties of hot X-ray-emitting gas in a sample of seven starburst and three normal edge-on spiral galaxies (a sample which covers the full range of star-formation intensity found in disk galaxies) correlate with the size, mass, star formation rate and star formation intensity in the host galaxies. From this analysis we investigate various aspects of mechanical energy “feedback” — the return of energy to the ISM from massive star supernovae and stellar winds — on galactic scales. The X-ray observations make use of the unprecedented spatial resolution of the Chandra X-ray observatory to remove X-ray emission from point sources more accurately than in any previous study, and hence obtain the X-ray properties of the diffuse thermal emission alone. Intriguingly, the diffuse X-ray properties of the normal spirals (both in their disks and halos) fall where extrapolation of the trends from the starburst galaxies with superwinds would predict. We demonstrate, using a variety of multi-wavelength star formation rate and intensity indicators, that the luminosity of diffuse X-ray emission in the disk (and where detected, in the halo) is directly proportional to the rate of mechanical energy feedback from massive stars in the host galaxies. Accretion of gas from the IGM does not appear to be a significant contributor to the diffuse X-ray emission in this sample. Nevertheless, with only three non-starburst normal spiral galaxies it is hard to exclude an accretion-based origin for extra-planar diffuse X-ray emission around normal star-forming galaxies. Larger galaxies tend to have more extended X-ray-emitting halos, but galaxy mass appears to play no role in determining the properties of the disk or extra-planar X-ray emitting plasma. The combination of these luminosity and size correlations leads to a correlation between the surface brightness of the diffuse X-ray emission and the mean star formation rate per unit area in the disk (calculated from the Far-Infrared luminosity and the optical size of the galaxy, ). Further observational work of this form will allow empirical constraints to be made on the critical star formation rate per unit disk area necessary to blow hot gas out of the disk into the halo (Mac Low & McCray, 1988). We show that a minor generalization of standard superbubble theory directly predicts a critical star formation rate per unit area for superbubble blow out from the disk, and by extension for superwinds to blow out of the gaseous halos of their host galaxy. At present there are a variety of poorly-known parameters in this theory which complicate comparison between observation and theory, making it impossible to assess the quantitative accuracy of standard superbubble blow out theory. We argue that the crucial spatial region around a galaxy that controls whether gas in starburst-driven superwinds will escape into the IGM is not the outer halo kpc from the host galaxy, but the inner few halo scale heights, within kpc of the galaxy plane. Given the properties of the gaseous halos we observe, superwind outflows from disk galaxies of mass – should still eject some fraction of their material into the IGM.
1 Introduction
Massive stars exercise a profound influence over the baryonic component of the Universe, through the return of ionizing radiation, and via supernovae (SNe), kinetic energy and metal-enriched gas, back into the interstellar medium (ISM) from which they form — usually called “feedback”. Feedback influences gas-phase conditions in the immediate environment of the clusters within which the massive stars form (McKee, 1995; Hollenbach & Tielens, 1997; Wiseman & Ho, 1998; Pudritz & Fiege, 2000), on galactic scales the phase structure and energetics of the ISM (McKee & Ostriker, 1977; Cox, 1981; Norman & Ikeuchi, 1989; Norman & Ferrara, 1996), and on multi-Mpc scales the thermodynamics and enrichment of the inter-galactic medium (IGM — e.g. see Chiang, Ryu & Vishniac 1988; Heckman, Armus & Miley 1990; Shapiro, Giroux & Babul 1994; Voit 1996; Heckman 1999; Aguirre et al. 2001).
The vast range of spatial scales involved is only one of the difficulties encountered in attempting to study feedback. Restricting the discussion to purely mechanical feedback from SNe and stellar winds (commonly termed SN feedback), a further difficulty is the broad range of complicated gas-phase physics – (magneto)hydrodynamic effects such as shocks and turbulence, thermal conduction, and non-ionization equilibrium emission processes. A final complication is that much of the energy and metal-enriched material involved is in the hard-to-observe coronal ( K) and hot ( K) gas phases, necessitating the use of space-based FUV and X-ray telescopes.
X-ray observations of the halo-regions of nearby edge-on disk galaxies provide the best single probe of the action of mechanical feedback on the galactic scale. Optical spectroscopy and imaging, sensitive to warm neutral and ionized gas with K, are a less direct probe of mechanical feedback as much of the excitation energy is supplied by ionizing radiation from massive stars (radiative feedback), even when the kinematics and spatial distribution of this gas are controlled by SN feedback. If mechanical feedback processes transport mass, newly-synthesized metals, and energy from galaxies into the IGM, then this material must pass through the halo of the host galaxy on its way into the IGM, where its properties can be ascertained before it expands and fades into observational invisibility.
Diffuse thermal X-ray emission is seen to extend to large distances ( to 20 kpc) above the planes of edge-on starburst galaxies (e.g. Fabbiano, Heckman & Keel 1990; Armus et al. 1995; Read, Ponman & Strickland 1997; Dahlem, Weaver & Heckman 1998), which also show unambiguous optical emission line evidence for energetic galactic scale outflows — “superwinds” (Heckman et al., 1990). These outflows are potentially very significant in enriching and heating the IGM (Heckman, 1999).
Both fully-numerical and semi-analytical theoretical modeling (Suchkov et al., 1994; Silich & Tenorio-Tagle, 1998; Murakami & Babul, 1999) suggest that the properties of the gaseous halos these superwinds expand into play a major role in determining the fate of the material in superwinds (i.e. escape into the IGM, or confinement and eventual return to the disk). Although simulations of starburst-driven winds should be treated with caution, given the lack of calibration against observational data, one robust result is the sensitivity of the wind properties (in particular mass and metal loss to the IGM) on the disk and halo ISM properties (e.g. De Young & Heckman, 1994; Suchkov et al., 1994; Silich & Tenorio-Tagle, 1998; Strickland & Stevens, 2000; Silich & Tenorio-Tagle, 2001). In our view, the emphasis given to galactic mass as a primary parameter influencing gas and metal ejection efficiencies (e.g. Dekel & Silk, 1986; Mac Low & Ferrara, 1999; Ferrara & Tolstoy, 2000; Ferrara et al., 2000) blinds non-expert readers to the more fundamental role played by the poorly-known disk and halo ISM distributions. The gravitational potential only enters at a secondary level, by influencing the gas distribution and finally via the escape velocity. Redressing the lack of observational knowledge about the gaseous halos that superwinds must pass through is one motivation for studying the halos of normal star-forming galaxies.
Modern theories of the ISM in normal spiral galaxies also predict hot gas in the halo, due to the interchange of material between the disk and halo through “galactic fountains” (Shapiro & Field, 1976; Bregman, 1980; de Avillez, 2000), or in a more-localized form through “chimneys” (Norman & Ikeuchi, 1989). Energy feed back into the ISM from supernovae is believed to create bubbles of hot, metal-enriched, gas, which blow out of the disk and vent their contents into the halo of the galaxy. After years or so, this material cools and falls back to the disk, possibly in a form analogous to the Galactic high velocity clouds.
Unfortunately, many of the fundamental aspects of these fountain/chimney disk/halo interaction theories are observationally unconstrained, fundamentally due to our current lack of knowledge about the X-ray properties of spiral galaxy halos. In the theoretical paradigm, fountains are primarily driven by the over-pressurized hot gas created by SNe, and the most direct diagnostic of the energetics, and elemental composition, of this gas is the thermal X-ray emission it produces.
Studies of nearby edge-on star-forming galaxies with Einstein and the ROSAT PSPC revealed only one normal spiral, NGC 891 (Bregman & Pildis, 1994), with X-ray-emitting gas in its halo111NGC 4631 is often presented as an example of a “normal” spiral galaxy with a X-ray-emitting halo (e.g. see Wang et al. 2001). However, its large-scale-height non-thermal radio halo, warm IRAS 60 to m flux ratio, high H luminosity and optically disturbed morphology show that it is a highly atypical spiral galaxy. It is a good example of a galaxy experiencing a mild, disk-wide, starburst event (Golla & Wielebinski, 1994). We believe that the ROSAT PSPC-based detection of a diffuse X-ray halo around NGC 4565, claimed by Vogler et al. (1995), is incorrect, as the archival 2.9 ksec Chandra ACIS-S observation (ObsID 404) reveals that the X-ray emission east of the nucleus (that comprised the majority of the emission originally considered to be diffuse) is due to two point sources.. Although edge-on normal spiral galaxies did not receive as much attention with Einstein & ROSAT as other classes of galaxy, those observations that were performed failed to produce believable detections of hot halo gas in other edge-on222Diffuse X-ray emission in approximately face-on star-forming galaxies (e.g. Snowden & Pietsch 1995; Cui et al. 1996; Ehle et al. 1998), can not be unambiguously associated with a hot halo, for obvious reasons. normal star-forming galaxies (Bregman & Glassgold, 1982; Vogler, Pietsch & Kahabka, 1995; Bregman & Houck, 1997; Fabbiano & Juda, 1997; Benson et al., 2000). X-ray studies of our own galaxy’s halo and disk/halo interface (e.g. Kuntz & Snowden 2000) provide information complementary to the study of other galaxies, but are difficult to perform and interpret due to our location within the disk.
More progress on investigating the disk/halo interface in normal galaxies has been made at other wavelengths, primarily in the optical, where extra-planar H emission (e.g. Dettmar, 1992; Rand, 1996; Hoopes, Walterbos & Rand, 1999; Collins et al., 2000; Rossa & Dettmar, 2003; Miller & Veilleux, 2003) and dust (Howk & Savage, 1999) has been detected in a variety of nearby, normal spiral galaxies. These studies have shown that the presence of such tracers of disk/halo interaction increases with higher levels of star-formation intensity in the underlying disk, but the mechanisms behind these phenomena, and their energetics, are still unclear.
It is also not clear to what extent fountains are a distinct phenomenon from superwinds. It is not unreasonable to think that physical conditions and kinematics of the gas making up a fountain may be quite different from that in a superwinds, despite the general similarity in driving mechanism. For example, the filling factor of the dominant X-ray-emitting plasma might be high in a fountain (Bregman, 1980), as compared to superwinds where the filling factor is low (Chevalier & Clegg, 1985; Suchkov et al., 1994; Strickland & Stevens, 2000; Strickland et al., 2000). Another intriguingly hint of a difference comes from the ROSAT PSPC-based sample of both normal spiral galaxies and starburst galaxies of all inclinations by Read & Ponman (2001). They find that the X-ray-emitting gas “in the coronal systems [i.e. galaxies assumed to have a hydrostatic hot gas corona/halo] appears to be cooler than that seen in the wind systems [i.e. starburst galaxies with superwinds]”.
Practitioners of semi-analytical (e.g. Benson et al. 2000), and numerical cosmological models (e.g. Toft et al. 2002) of galaxy formation and evolution offer a radically different origin for X-ray emitting halos around spiral galaxies. Inter-galactic gas continually flows into galactic halos, is heated in an accretion shock to the halo virial temperature (although Katz et al. (2003) discuss simulations in which only a small fraction of the accreted gas is heated to halo virial temperatures), and then cools and accretes onto the disk. These models predict red-shift zero spiral galaxy X-ray luminosities at, or just below, the ROSAT-based observational upper limits. The predicted X-ray luminosity is a strong function of the galaxy mass, , and that the temperature of the gas is similar to the halo virial temperature . The majority of the diffuse X-ray emission arises close to the disk, the X-ray surface brightness dropping off semi-exponentially with height above the disk. These halo properties should be largely independent of the host disk’s SF intensity, and the exact numerical implementation of SN feedback (J. Sommer-Larsen, 2002, private communication).
| Galaxy | (J2000) | PA | D | scale | |||||||||
|---|---|---|---|---|---|---|---|---|---|---|---|---|---|
| (h m s, ) | () | () | (km/s) | (Mpc) | (pc) | (Jy) | () | () | () | () | () | ||
| (1) | (2) | (3) | (4) | (5) | (6) | (7) | (8) | (9) | (10) | (11) | (12) | (13) | (14) |
| M82 | 09 55 51.9 +69 40 47.1a | 73b, 82c | 65d | 137a | 3.6e | 17.5 | 1313.5f | 0.97 | 5.36 | 0.75 | 0.33 | 7.0g | 1.9 |
| NGC 1482 | 03 54 39.3 -20 30 08.9h | 58i | 103j | 165k | 22.1 | 107.1 | 35.3f | 0.77 | 5.00 | 0.84 | 0.38 | N 9.4l | 3.7 |
| NGC 253 | 00 47 33.2 -25 17 16.2m | 79n, 72o | 52d, 49o | 225m | 2.6p | 12.6 | 936.7f | 0.50 | 2.10 | 0.89 | 0.58 | 3.6q | 10.6 |
| NGC 3628 | 11 20 16.95 +13 35 20.1r | 87s, 80r | 104d | 229t | 10.0u | 48.5 | 51.6f | 0.50 | 1.74 | 1.58 | 1.06 | N 2.3v | 11.3 |
| NGC 3079 | 10 01 57.8 +55 40 47.2w | 85w | 165d | 244t | 17.1 | 82.9 | 50.2f | 0.49 | 4.76 | 1.55 | 0.98 | N 9.1d | 14.1 |
| NGC 4945 | 13 05 25.3 -49 29 09.0x | 78y | 43y | 184t | 3.7 | 17.9 | 588.1z | 0.42 | 2.70 | 0.94 | 0.73 | N 2.4d | 5.2 |
| NGC 4631 | 12 42 07.2 +32 32 31.9aa | 85ab, 81ac | 86ac, 83ac | 150ab | 7.5ab | 36.4 | 82.9z | 0.40 | 1.74 | 0.62 | 0.98 | N 14.3ad | 2.6 |
| NGC 6503 | 17 49 26.4 +70 08 39.7ae | 75af | 123af | 120ag | 5.2ah | 25.2 | 10.2f | 0.35 | 0.12 | 0.14 | 0.18 | 0.76ai | 1.2 |
| NGC 891 | 02 22 33.2 +42 20 56.2aj | 89aj | 23aj | 225t | 9.6 | 46.5 | 61.1z | 0.31 | 2.47 | 1.66 | 0.78 | 3.3ae | 10.6 |
| NGC 4244 | 12 17 29.7 +37 48 20.4ak | 85ak | 48ak | 100ak | 3.6 | 17.5 | 4.2z | 0.26 | 0.04 | 0.08 | 0.42ad | 0.6 | |
Note. — Column 2: Coordinates of the dynamical center of the galaxy, where available. Column 3: Inclination. Column 4: Position angle of the galactic disk. Multiple values for the inclination and position angle are given when several values are often reported in the literature. Column 5: Inclination-corrected circular velocity within the disk. Column 6: Assumed distance. Unless a specific reference is given, distances were calculated using the galaxy recessional velocity with respect to the microwave background (de Vaucouleurs et al., 1991), and . Column 7: Physical distance corresponding to an angular size of 1 arcsecond. Column 8: IRAS flux in Janskys. Column 9: IRAS to flux ratio. Column 10: Total IR luminosity based on the observed IRAS fluxes, , where is the distance to the galaxy in Mpc (Sanders & Mirabel, 1996). Given the large angular size of these local galaxies we use IRAS fluxes from extended source analyses, the exact source of the IRAS data used is given in a case by case basis above. Where multiple measurements were available for any galaxy, we used the following sources in order of preference: Rice et al. (1988), and Soifer et al. (1989). Column 11: K-band luminosity, calculated from the K-band total magnitudes given in Jarret et al. (2003) and converted to the Cousins-Glass-Johnson system using the transformations presented in Carpenter (2001). Zero points for conversion from magnitude to flux were taken from Bessel, Castelli & Plez (1998). Note that the units are , not . Column 12: B-band luminosity from RC3 catalog magnitude (de Vaucouleurs et al., 1991), and corrected for Galactic extinction using reddening values from Burstein & Heiles (1982). Note that no correction for extinction internal to the specific galaxy has been made. Column 13: Observed H-luminosity in units of . Note these values have not been corrected for extinction. Measurements that have not been corrected for [Nii] emission are marked with a preceding . Column 14: Baryonic mass (stellar plus Hi) estimated from the K-band Tully Fisher relationship of Bell & de Jong (2001), where .
References. — (a) Weliachew, Fomalont & Greisen (1984), (b) Ichikawa et al. (1995), (c) Lynds & Sandage (1963), (d) Lehnert & Heckman (1995), (e) Freedman et al. (1994), (f) Soifer et al. (1989), (g) McCarthy, Heckman & van Bruegel (1987), (h) 2MASS Second Incremental Release, (i) Hameed & Devereux (1999), (k) Calculated assuming , using the value from Roth, Mould & Davies (1991), (l) Hameed & Devereux (1999), (m) Sorai et al. (2000), (n) Pence (1981), (o) Puche, Carignan & van Gorkom (1991), (p) Puche & Carignan (1988), (q) From H images published in Strickland et al. (2002), (r) Douglas et al. (1996), (s) Irwin & Sofue (1996), (t) Sofue (1997), (u) Soifer et al. (1987) (v) Fabbiano et al. (1990), (w) Irwin & Seaquist (1991), (x) Ott et al. (2001), (y) Koorneef (1993), (z) Rice et al. (1988), (aa) Dynamical center, Golla & Wielebinski (1994), (ab) Rand (1994), (ac) Golla (1999), (ad) Hoopes et al. (1999), (ae) Central optical & X-ray source, Lira, Johnson & Lawrence (2002), (af) de Vaucouleurs et al. (1991), (ag) Bottema & Gerritsen (1997), (ah) Karachentsev & Sharina (1997), (ai) Kennicutt (1998a). (aj) Nuclear 1.4 GHz continuum point source, Rupen (1991), (ak) Hi dynamical center, Olling (1996).
In order to investigate some of these questions we have compiled a sample of 10 edge-on star-forming galaxies which have both ground-based narrow-band optical imaging (probing extra-planar gas at ) and X-ray observations with the Chandra X-ray Observatory. The spatial resolution of the Chandra telescope ( FWHM) is an order of magnitude better than any previous or currently-existing X-ray instrument. As approximately half of the X-ray luminosity of a star-forming galaxies is due to X-ray luminous point sources, accurate studies of the X-ray diffuse emission require high spatial resolution in order to allow point source removal.
In Strickland et al. (2004, henceforth referred to as Paper I) we described the sample, the X-ray and optical data reduction performed, and presented results and interpretation of a spatial and spectral analysis of the diffuse X-ray emission.
In this paper we investigate how the empirical properties of the hot gas, in particular gas in the halos of these galaxies, correlate with the size, mass, star formation rate and star formation intensity in the host galaxies. From this analysis we investigate various aspects of mechanical energy “feedback” — the return of energy to the ISM from massive star supernovae and stellar winds — on galactic scales.
We describe the sample and their star-formation properties in § 2. In § 3 we provide a brief summary of the results from Paper I, before moving onto considering what correlations exist between the properties of the diffuse X-ray emission and other multi-wavelength properties of the galaxies in § 4. In § 5 we discuss these results with respect to various aspects of feedback-related theory, in particular the conditions necessary for blow-out of gas from the disk and halo in normal galaxies and in starbursts, and the fraction of supernova mechanical energy available to drive large-scale ISM motions. Our results and conclusions are summarized in § 6.
2 Sample galaxies
The sample is formed of seven starburst galaxies and three “normal” star-forming galaxies, all approximately edge-on () moderate luminosity (), moderate-mass ( – ) disk galaxies within a distance of . This sample contains all the disk galaxies for which Chandra ACIS data was available to us as of 2002 September, including both public data and our own propriety observations. Although the sample size is small, in particular with respect to non-starburst systems, it does span the full range of star formation activity found in disk galaxies. The starburst galaxies in our sample are all good examples of the “typical” starburst galaxy in the local universe, i.e. infrared warm galaxies with a far-infrared luminosity a few (Soifer et al., 1987). The three non-starburst systems in the sample are NGC 891, NGC 6503 and NGC 4244. NGC 891 is a well-studied spiral galaxy, believed to be similar to our own galaxy in mass and star formation rate. It is the only “normal” spiral galaxy (apart from possibly our own) for which robust evidence of extra-planar diffuse X-ray emission has been discovered (Bregman & Pildis, 1994). Both NGC 6503 and NGC 4244 are relatively low mass spiral galaxies. We refer the reader to Paper I for a more detailed discussion of the sample and the distinction between starburst and normal spiral galaxies.
Basic physical properties of the sample galaxies are shown in Table 1. We distinguish between starburst galaxies and more-normal star-forming galaxies on the basis of their IR-warmth — specifically the IRAS to flux ratio . Higher star formation rates per unit disk area lead to higher dust temperatures, and hence higher ratios, with starburst galaxies typically having . We will refer to those galaxies with as the normal spirals.
Intuitively, we would expect the effect of mechanical energy feedback on the galactic scale to depend on the total star formation rate, and/or the star formation rate per unit volume or area. Star formation and supernova rates, and rates per unit area, for the sample galaxies are given in Table 2. Note that galaxies are listed in all tables in order of decreasing ratio, i.e. approximately in order of decreasing star formation rate per unit area.
2.1 Star formation rates and intensities
We also consider two other simple, and widely-available proxies of the star-formation intensity: FIR and non-thermal radio face-on surface brightnesses, quantified for our sample in Table 2. Although somewhat simplistic estimators of SF intensity, these do have the advantages of being available for almost all local disk galaxies from uniformly-obtained datasets, and are distance-independent.
Very detailed studies of the star-formation rates, spatial distributions, and history, are available for the brightest starbursts such as M82 (Rieke et al. 1993; McLeod et al. 1993; Satyapal et al. 1997; de Grijs, O’Connell & Gallagher 2001; Förster Schreiber et al. 2001) and NGC 253 (Engelbracht et al., 1998), but measurements of similar quality are not available for many of the starburst galaxies in our sample, let alone the normal spiral galaxies. We did calculate star formation intensities for all our sample galaxies based on all available optical, NIR and radio measurements we could find in the literature, but found the scatter in estimated SF intensity for any particular galaxy to be intolerably large.
| Galaxy | SFRHα,T | SFRIR,T | K-band | |||||||||||||||
|---|---|---|---|---|---|---|---|---|---|---|---|---|---|---|---|---|---|---|
| (1) | (2) | (3) | (4) | (5) | (6) | (7) | (8) | (9) | (10) | (11) | (12) | (13) | (14) | (15) | (16) | (17) | (18) | (19) |
| M82 | 9.2 | 8.9 | 9.3 | 0.69 | 0.72 | 4745.9 | 16.60 | 1211.0 | 0.107 | 7386.8 | 14.8 | 0.26 | 8.41 | 2.04 | 8.34 | |||
| NGC 1482 | 8.6 | 2.2 | 14.1 | 0.10 | 0.66 | 136.8 | 7.93 | 503.0 | 0.100 | 236.7 | 11.3 | 1.21 | 0.46 | 1.74 | 8.27 | |||
| NGC 253 | 3.6 | 20.4 | 15.4 | 3.56 | 2.69 | 4288.3 | 2.86 | 177.1 | 0.042 | 5704.5 | 29.1 | 0.37 | 1.69 | 2.11 | 8.65 | |||
| NGC 3628 | 3.0 | 10.5 | 30.5 | 1.67 | 4.86 | 244.5 | 0.606 | 37.5 | 0.035 | 470.2 | 20.9 | 1.01 | 0.27 | 2.33 | 8.08 | |||
| NGC 3079 | 8.1 | 5.5 | 27.4 | 0.71 | 3.54 | 232.8 | 2.14 | 127.1 | 0.129 | 820.7 | 18.3 | 1.52 | 0.61 | 2.62 | 8.27 | |||
| NGC 4945 | 4.6 | 13.8 | 14.9 | 2.88 | 3.09 | 2927.7 | 4.28 | 246.5 | 0.054 | 4200.0 | 30.0 | 0.54 | 4.47 | 2.88 | 8.37 | |||
| NGC 4631 | 3.0 | 10.5 | 22.9 | 1.51 | 3.29 | 412.3 | 1.07 | 66.8 | 0.035 | 771.7 | 59.6 | 2.17 | 0.0543 | 2.48 | 7.70 | |||
| NGC 6503 | 0.20 | 5.6 | 8.4 | 0.77 | 1.18 | 55.1 | 0.492 | 16.7 | 0.0012 | 41.9 | 34.6 | 0.87 | 0.0088 | 2.97 | 8.23 | |||
| NGC 891 | 4.2 | 9.3 | 26.1 | 1.47 | 4.10 | 355.6 | 1.14 | 39.5 | 0.049 | 285.7 | 55.2 | 2.57 | 0.0234 | 3.19 | 8.19 | |||
| NGC 4244 | 0.04 | 10.2 | 10.7 | 1.85 | 1.94 | 27.2 | 0.071 | 3.5 | 0.0004 | 20.3 | 158.5 | 2.84 | 0.0003 | 4.53 | 7.72 | |||
Note. — Column 2: Lower limits on the total galactic star formation rate ( yr-1), based on the H luminosity and using the formulae given in Kennicutt (1998b). Note that no correction for extinction has been applied. Column 3: Estimated total galactic star formation rate ( yr-1), based on the IR luminosity, where SFR [], again using the Kennicutt (1998b) formulae. Columns 4 and 5: Inclination-corrected diameter of the stellar disk in arcminutes (4) and kpc (5), based on the values given in the RC3 and the distances given in Table 1. The method of Tully & Fouqué (1985) was used to correct the observed values for inclination. Columns 6 and 7: K-band half light radii in arcminutes (6) and kpc (7). Original values were taken from the 2MASS Large Galaxy Atlas (Jarret et al., 2003). Column 8: IRAS Far-IR flux , in Jy. To convert to units of multiply by . Column 9: Far-IR luminosity per unit stellar disk area , in distance-independent units of mJy arcsec-2. To convert to the commonly used units of multiply by 6.484. Column 10: One estimate of the mean galactic supernovae rate per unit area, , in units of SN Myr-1 kpc-2, is based on the star-formation rate calculated from . Column 11: Estimated total galactic core-collapse supernova rate ( yr-1), where (Heckman et al., 1990). Column 12: 1.4 GHz radio flux in mJy, based on the NVSS data. See § 2.2 for more details. Column 13: 1.4 GHz luminosity in units of Solar luminosities, where . The major-axis half-light radius, in units of arcseconds and kpc, that we derive the NVSS data is given in columns 14 and 15 respectively. Column 16: Effective 1.4 GHz surface brightness, in mJy arcsec-2. Column 17: Another estimate of the mean SN rate per unit area (again in units of SN Myr-1 kpc-2), based on the star-formation rate calculated from but using NVSS-based size . Note that NGC 4945 was not observed in the NVSS. For NGC 4945 we use the nuclear region 1.4 GHz flux and size from Elmouttie et al. (1997), whose observations had similar spatial resolution to that of the NVSS. Column 18: Logarithm of the gas consumption timescale in Myr, where , and and are the surface density of gas ( pc-2) and star-formation rate ( yr-1 kpc-2) respectively. Data are from Kennicutt (1998a), except for NGC 1482, NGC 3628, NGC 4244, NGC 4631 and NGC 4945. For these galaxies the star formation rate was estimated from the IRAS fluxes. Gas masses were obtained from Elfhag et al. (1996) for NGC 1482 (using the CO brightness to column density scaling in Kennicutt (1998a), and a radius of 2 kpc, as ISO observations by Dale et al. (2000) demonstrate that 80% of the star-formation occurs within this radius), Irwin & Sofue (1996) for NGC 3628 (central, pc, gas mass), from Olling (1996) for NGC 4244 (total HI gas mass), from Golla & Wielebinski (1994) for NGC 4631 ( gas mass for kpc) and from Dahlem et al. (1993) for NGC 4945 (molecular gas mass within central 1.1 kpc). Column 19: Logarithm of the mean mass surface density .
The FIR luminosity divided by the optical isophotal diameter (in kpc) at 25th magnitude, , is often used as a proxy for the mean star-formation rate per unit disk area in spiral galaxies (we shall occasionally refer to the star formation rate per unit disk area as the SFRI for convenience). The presence of extra-planar H and/or radio emission, and extra-planar dust, is known to qualitatively correlate with this parameter (Rand 1996, see also Dettmar 1998; Howk & Savage 1999; Rossa & Dettmar 2000; Dahlem et al. 2001). It under-estimates the true SF intensity in starburst galaxies, as the star-formation is often much more concentrated than the old stellar light measured by . This method also over-estimates the mean SF intensity in galaxies with star-formation rates somewhat less than that of the Milky Way, where an increasing fraction of is due to cool dust heated by diffuse star-light, and not by massive stars.
Non-thermal radio emission, due to synchrotron emission from relativistic electrons accelerated in supernova remnants, provides a good tracer of SF activity on galactic scales (Condon, 1992). The 1.4 GHz luminosity of a galaxy is almost directly proportional to the SF rate, which, combined with the measured angular size of the radio-emitting region, provides a good SF intensity measurement (Dahlem et al., 2001).
The radio fluxes, sizes and SF intensity values given in Table 2 are based on 1.4 GHz images from the NRAO/VLA Sky Survey (NVSS, see Condon et al. 1998), with the exception of southern galaxy NGC 4945, which lies outside the region of sky surveyed by the NVSS. A description of how these values were obtained is given in § 2.2
2.2 Radio fluxes, sizes and SF intensity measurements
Radio fluxes and half-light radii were measured from the processed NVSS 1.4 GHz radio images (http://www.cv.nrao.edu/nvss/postage.shtml). Fluxes were summed within rectangular apertures encompassing the optical disk of each galaxy, each of total width equal to the optical diameter and breadth equal to the minimum of 15 (twice the angular resolution of the NVSS) or the angular equivalent of 4 kpc, and centered on the nuclear positions given in Table 1. The major-axis half-light radii were measured from the radio flux within the disk regions defined above using -wide pixels. Inspection of the resulting radio surface brightness slices demonstrated that the fluxes at the extreme ends of the slices were in all cases statistically consistent with zero, allowing us to define the 100%-enclosed light radii as the edges of the surface brightness profiles. Given the linear, rather than radial, nature of these major-axis surface brightness profiles we obtained two half-light radii on either side of the nucleus for each galaxy, and , which were combined to give the final half light radius shown in Table 2.
We did not use the fluxes and sizes given in the NVSS Source Catalog itself, which quotes fluxes and sizes from a a 2-dimensional Gaussian model fit to the radio images. The NVSS Source Catalog underestimates the total 1.4 GHz flux from galaxies such as NGC 253, NGC 3628 and NGC 4631 by a factor , where a relatively bright compact nuclear region of radio emission is surrounded by a fainter extended radio-emitting disk, i.e. cases where a single Gaussian fit the the flux distribution does not work well.
NGC 4945 is a southern hemisphere target and hence was not observed in the NVSS. For NGC 4945 we use the nuclear region 1.4 GHz flux and size quoted in Elmouttie et al. (1997). Their observations had a similar spatial resolution to that of the NVSS, making these values a reasonably good match to the values we use for the other galaxies.
Note that the moderately-low spatial resolution of this radio data (FWHM = ) will over-estimate the spatial size of the radio emission for the more compact starbursts (and hence under-estimate the SF intensity), especially for the more distant galaxies such as NGC 3079 and NGC 1482.
3 Summary of results from Paper I
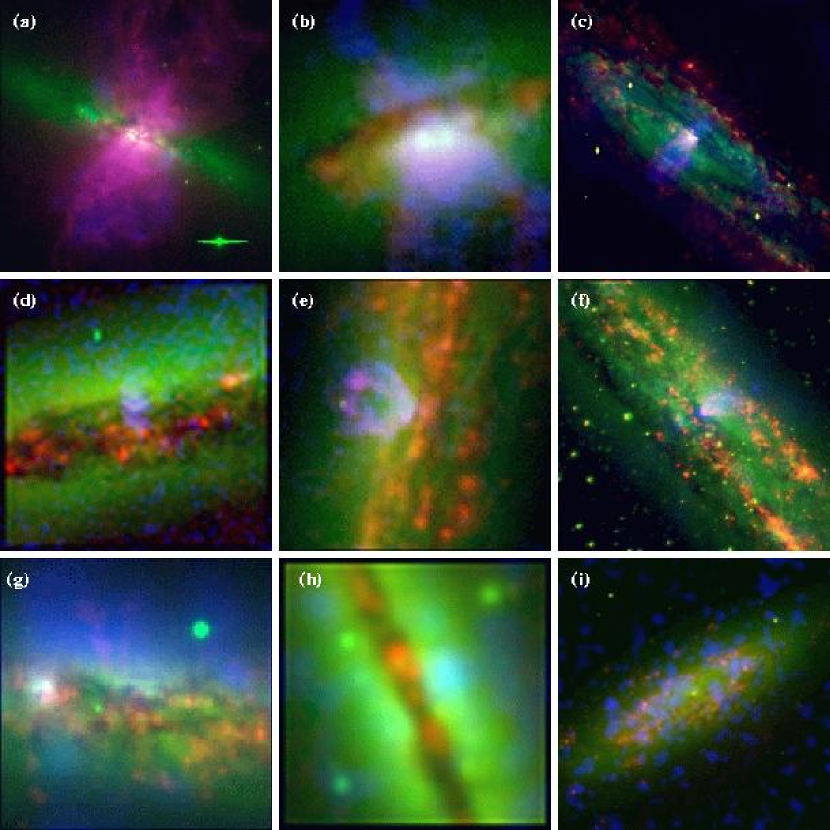
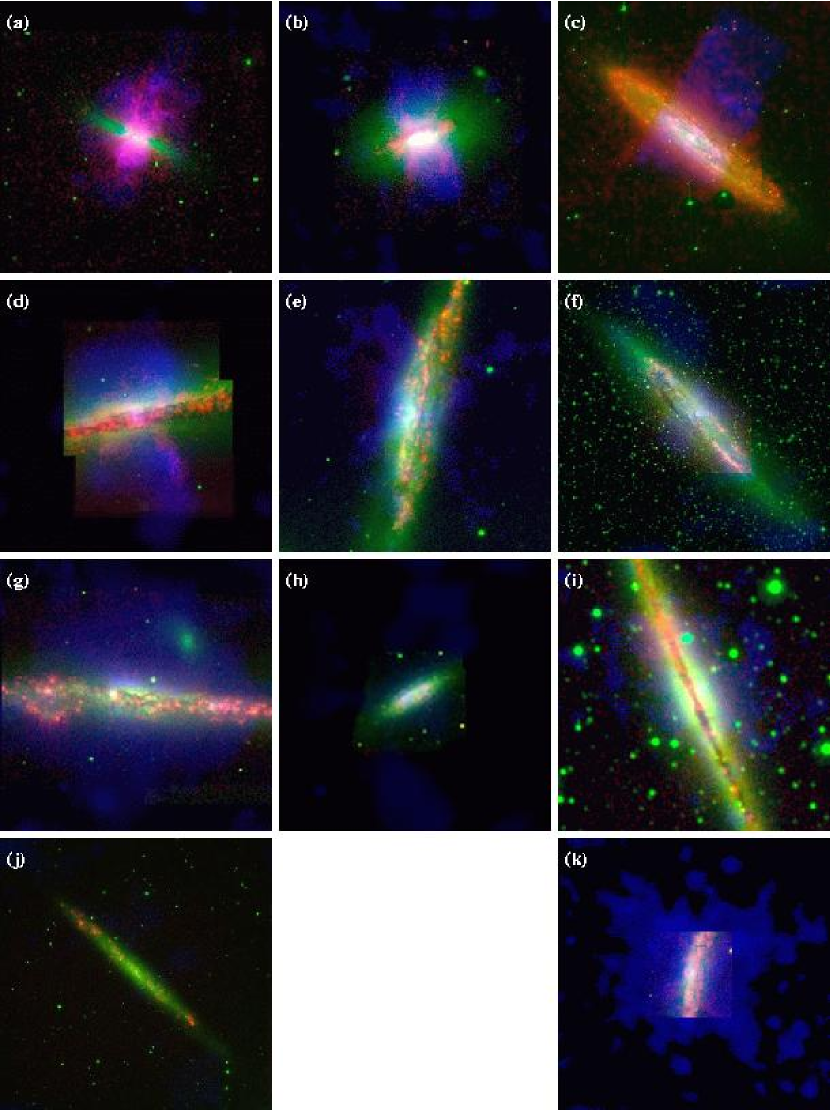
In Paper I (Strickland et al., 2004) we presented a detailed study of the diffuse X-ray emission in a sample of 10 approximately edge-on disk galaxies (7 starburst galaxies, 3 normal spirals) that span the full range of star formation found in disk galaxies. With the arcsecond spatial resolution of the Chandra X-ray telescope we were able to separate the X-ray emission from point sources from the truly diffuse component. The high spatial resolution also allowed a meaningful comparison to be made of the spatial location of the X-ray emission with respect to multi-wavelength data (in particular to ground or space-based optical imaging). In addition to a detailed discussion of each galaxy, we presented a mini-atlas of soft and hard X-ray, H and R-band images of each of the 10 galaxies, shown at a common spatial and surface brightness scale to facilitate cross-comparison. Three color composite images of the diffuse soft X-ray emission (blue) with optical H emission (red) and R-band stellar continuum emission (green) are shown in Figs. 1 and 2.
We presented a variety of quantitative measures of the spatial extent, spectral hardness, and shape of the diffuse X-ray emission, several of which can be applied to future samples of galaxies with lower S/N data. We found that the spectral properties of the diffuse X-ray emission show only weak, or some cases no, variation with increasing height (outside a heavily-absorbed, spectrally-harder region within kpc of the disk mid-plane). The vertical decrease in surface brightness of the extra-planar emission ( kpc) appears to better described by exponential (effective surface brightness scale heights are typically between 2 – 4 kpc), or Gaussian models, than the power law expected of a freely expanding fluid.
For the eight galaxies with detections of extra-planar (i.e. halo-region) diffuse emission, we find that a common spectral model, comprising a two-temperature Mekal (Mewe et al., 1995) hot plasma model with an enhanced -to-Fe element ratio, can simultaneously fit the ACIS X-ray halo-region spectra. The X-ray-derived metal abundances show super-Solar ratios of -process elements (primarily oxygen) to iron. This is consistent with the origin of the X-ray emission being either (metal-enriched) merged SN ejecta, or from shocked ambient halo ISM (with moderate depletion of refractory elements onto dust).
Although less luminous, the spatial and spectral properties of the thermal X-ray emission in the normal, non-starbursting, spiral galaxy NGC 891 are very similar to those of the starburst galaxies with superwinds.
Our favored model for the origin of the extra-planar soft X-ray emission is that SN feedback in the disks of star-forming galaxies create, via blow out and venting of hot gas from the disk, tenuous exponential atmospheres of density scale height – 8 kpc. AGN-driven winds do not appear to be significant in this sample, in that there is no obvious correlation between the presence and luminosity of any AGN and the properties of the diffuse X-ray emission. The soft thermal X-ray emission observed in the halos of the starburst galaxies is either pre-existing halo medium (which has been swept-up and shock-heated by the starburst-driven superwinds) or from a small fraction (by volume) of the merged-SN-ejecta that has been compressed near the walls of the outflow (e.g. by a reverse shock propagating back into the outflowing wind). In either case the observed exponential X-ray surface brightness distributions are an inheritance from galactic fountain activity prior to the currently-observed starburst phase. This model is based on the qualitative 2-D morphology of the diffuse X-ray and optical H emission (in particular the filamentary, occasionally limb-brightened morphology of both the X-ray and H emission), as well as interpretation of the more-quantitative minor axis surface brightness and spectral hardness profiles. An implication of this model is that galactic-scale gaseous halos may be common around star-forming disk galaxies. Observing starburst galaxies, in which superwinds “light-up” these pre-existing halos, may present the best method for studying the gaseous halos of star-forming galaxies.
| Value | Tabulated in | Description | Appears in |
|---|---|---|---|
| (1) | (2) | (3) | (4) |
| Data values tabulated in this paper. | |||
| Table 1 | Total galactic IR luminosity, derived from IRAS fluxes. | Figs. 3 and 4 | |
| Table 1 | Total galactic K-band luminosity, derived from fluxes in the 2MASS Large Galaxy Atlas. | Figs. 3 and 4 | |
| Table 1 | Total galactic B-band luminosity. Not corrected for extinction. | Figs. 3 and 4 | |
| Table 1 | Inclination-corrected peak circular velocity. | Figs. 5, 6 and 7 | |
| Table 1 | IRAS 60 to flux ratio, an indicator of the intensity of star formation. | Figs. 5 and 7 | |
| Table 1 | Galactic baryonic mass derived from the K-band Tully-Fisher relation. | Figs. 4 and 8 | |
| Table 2 | Total galactic radio luminosity at 1.4 GHz, derived from the NVSS. | Figs. 3 and 4 | |
| Table 2 | Total galactic radio flux at 1.4 GHz, derived from the NVSS. | ||
| Table 2 | Radio major-axis half light radius. | Fig. 6 | |
| Table 2 | Radio-based estimate of the star formation rate intensity. | Figs. 5 and 7 | |
| Table 2 | Total galactic IRAS FIR flux. | ||
| Table 2 | Inclination corrected optical diameter at a surface brightness of 25 magnitudes per square arcsecond. | Fig. 6 | |
| Table 2 | Commonly used proxy of the mean galactic star formation rate per unit area. | Figs. 5 and 7 | |
| K-band | Table 2 | K-band half light radius, from the 2MASS Large Galaxy Atlas. | Fig. 6 |
| Table 2 | Mean galactic mass surface density. | Fig. 6 | |
| Table 2 | Total galactic core-collapse supernovae rate, based on the total IR luminosity. | ||
| Table 2 | One estimate of the mean supernovae rate per unit disk area, where | Fig. 8 | |
| Table 2 | Another estimate of the mean supernovae rate per unit disk area, where | Fig. 8 | |
| Data values tabulated in Paper I. | |||
| Table 4 | Mean diffuse X-ray surface brightness between and the minor half light height and between . | Fig. 7 | |
| Table 4 | Height along the minor axis at which the diffuse X-ray surface brightness reaches photons s-1 cm-2 arcsec-2. | Fig. 8 | |
| Table 4 | Minor axis diffuse X-ray 95%-flux enclosed height. | Fig. 8 | |
| Table 5 | Major-axis diffuse X-ray half light radius. | Fig. 6 | |
| Table 5 | Major-axis diffuse X-ray 75%-flux enclosed radius. | Fig. 6 | |
| Table 6 | Minor-axis diffuse X-ray exponential scale height in the 0.3–1.0 keV energy band. | Figs. 6 and 8 | |
| Table 8 | X-ray luminosity weighted mean temperature. | Fig. 6 | |
| Table 8 | Mean diffuse X-ray surface brightness within the halo spectral extraction region. | Fig. 7 | |
| Table 9 | Halo region absorption-corrected X-ray flux (0.3–2.0 keV energy band). | Fig. 5 | |
| Table 9 | Halo region absorption-corrected X-ray luminosity (0.3–2.0 keV energy band). | Figs. 3 and 4 | |
| Table 9 | Disk region absorption-corrected X-ray luminosity (0.3–2.0 keV energy band). | ||
| Table 9 | Nuclear region absorption-corrected X-ray luminosity (0.3–2.0 keV energy band). | ||
| Sum of and . | Figs. 3 and 4 | ||
Note. — Column 2: Table in this paper, or paper I, in which the symbol in Column 1 is tabulated. Column 3: A short description of the mean of each symbol – see the appropriate Table for a more detailed explanation. Column 4: Figures in this paper in which the values are used. Some data values used in the figures, e.g. , are not explicitly tabulated but can calculated from data that is tabulated.
4 Correlation analysis
We shall now move onto a more-quantitative comparison of the properties of the diffuse X-ray with other properties of host galaxies. For convenience, definitions of the data values we use (from both Paper I and this paper), the table numbers from which they were extracted, and the figures in which they are used, are given in Table 3. In Paper I we considered the thermal emission from the nuclear region and the disk exterior to the nucleus separately. In this paper we will combine the X-ray luminosities of the nucleus () and the disk () to give a total X-ray luminosity from hot gas with kpc of the plane of the galaxy. For convenience we shall refer to this combination of Paper I’s disk and nuclear regions as the disk in the rest of this paper. Halo region (i.e. kpc) luminosities are used as published in Paper I.
Given the very significant absorption of the diffuse emission from NGC 4945 by the high Galactic foreground hydrogen, the low detection significance and atypical spectral hardness of the halo diffuse emission (see Paper I), we have excluded it from further analysis. In particular, it is excluded from Figs. 3 to Fig. 8.
4.1 Star-formation or galaxy mass? The physical-drivers of extra-planar X-ray emission
The only previous study quantitatively comparing the diffuse X-ray emission333Significant effort has been expended in the past comparing the multi-wavelength luminosities of galaxies in an attempt to elucidate the physical causes of the integrated X-ray emission in these systems. We refer the interested reader to Fabbiano (1989), Shapley, Fabbiano & Eskridge (2001) and Fabbiano & Shapley (2002). from late-type, star-forming galaxies with their integrated luminosities at other wavelengths is the ROSAT PSPC-based study published in Read et al. (1997) and Read & Ponman (2001). They find that the estimated total diffuse emission X-ray luminosity per unit galaxy mass (estimated from ) correlates well with , an estimator of galaxy mass for normal spirals. For starburst galaxies shows a better correlation with , i.e. with a proxy of star formation rate.
There are a number of reasons while it is worthwhile to re-examine this issue, apart from the obvious advantage of using the higher quality data from an instrument with greater sensitivity, and vastly superior capabilities of separating point-source and diffuse emission. Determining the properties of extra-planar hot gas in normal galaxies has assumed a new significance, given its importance as a diagnostic of the accuracy of theories of galaxy formation and evolution. The normal galaxy sample of Read & Ponman (2001) is largely a collection of face-on systems, with the approximately Milky-Way-like galaxy NGC 891 (van der Kruit, 1984; Wainscoat et al., 1987) being classed as a starburst on the basis of the reddening-correction-sensitive criterion used by Read & Ponman as the definition of a starburst. It is only in high inclination systems where we can separate the disk and halo diffuse components, the latter being the most interesting component in testing both SN feedback models and cosmological accretion models.
There are only three approximately edge-on normal spiral galaxies in our sample, the Milky Way-like galaxy NGC 891 and the two lower mass and lower luminosity spirals NGC 6503 and NGC 4244. These three galaxies are too small a sample on their own to establish any hard conclusions about the properties of diffuse X-ray emission in normal spiral galaxies, but in combination with the starbursts we can make a meaningful first assessment of how closely the properties of the diffuse X-ray emission in these systems resemble those of the edge-on starburst galaxies. Of course more X-ray observational study of edge-on spiral galaxies is required before we understand extra-planar hot gas in normal spiral galaxies as well as we understand the phenomenon in starbursts.

4.2 X-ray and multi-wavelength luminosities
We find reasonable correlations between the soft X-ray luminosity of both the disk and halo diffuse X-ray emission, and the total galactic FIR and 1.4 GHz radio luminosities (see Fig. 3), which are well-known measures of the total star-formation rate. In particular, note that the slope of the correlations between or and is of order unity, as expected if the diffuse X-ray emission is caused by star-formation activity.
Correlation between the X-ray luminosities and the optical B and NIR K-band luminosities (i.e. proxies for total galactic stellar mass) is somewhat weaker, in particular in the case of the halo X-ray luminosity when only detections are considered.
In Fig. 4 we plot all luminosities normalized by the stellar mass of the host galaxy. Estimates of the stellar mass of each galaxy are based on the 2MASS K-band Tully-Fisher relationship derived by Bell & de Jong 2001), and are listed in Table 1. As the K-band luminosity and are not independent variables we have not included a plot of against in this figure. Having taken out any dependence related to galaxy mass (i.e. more massive galaxies having more star-formation and more X-ray emission than small galaxies), Fig. 4 makes it clear that the diffuse X-ray luminosity per unit mass is directly proportional to star-formation rate per unit mass.


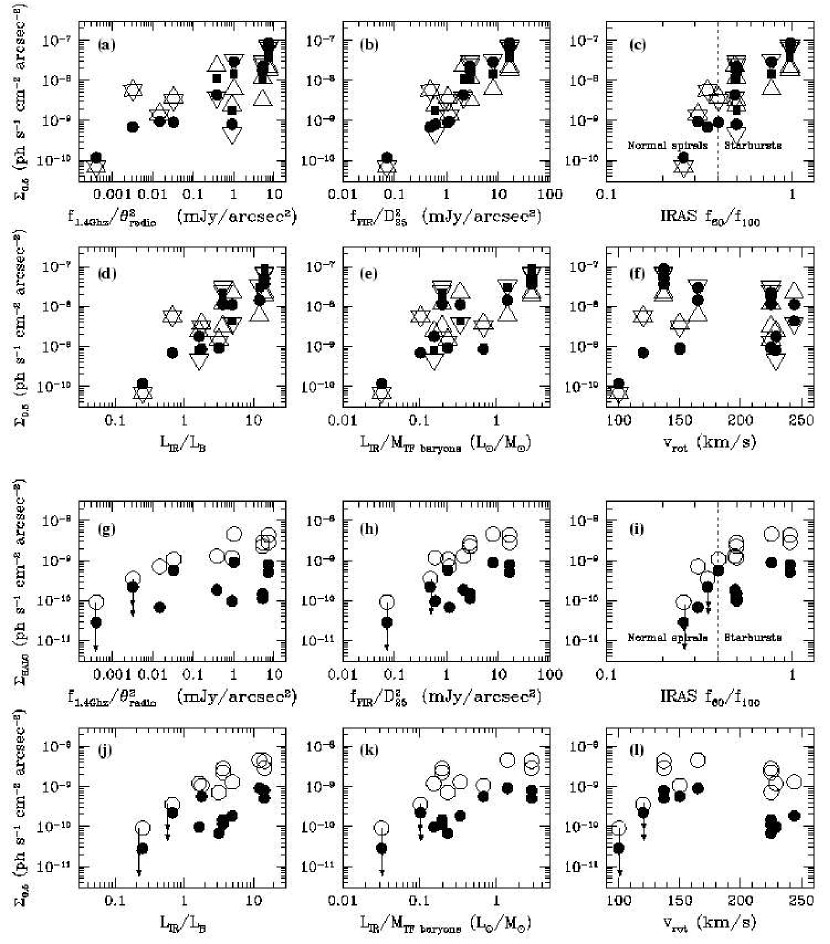
In Fig. 5 we plot the ratio of the absorption-corrected X-ray flux from the halo to the host galaxy’s FIR or radio flux, against estimators of the star-formation rate per unit disk area from radio and FIR observations, and the galaxy circular velocity. From panels a and b of this figure, it is apparent that all galaxies with detected extra-planar X-ray emission have a similar ratio, of approximately ( dex). The mechanical energy injection rate from supernovae and stellar winds in the starburst is , where is the fraction of mechanical energy thermalized (Heckman et al., 1990). This implies that the halos of these starburst galaxies, along with the normal spiral galaxy NGC 891, radiate an approximately fixed fraction of the mechanical energy supplied by stellar feedback within the disk, in the 0.3–2.0 keV X-ray band. For any realistic value of , i.e. , we re-derive the well-known result that superwinds radiate a negligible fraction of their energy budget in soft X-rays (we discuss this further in § 5.1.3).
Perhaps the most interesting implication of Fig. 5 is that the X-ray luminosity per unit star formation rate is independent of the star formation intensity (star formation rate per unit disk area), over many orders of magnitude variation in star formation rate per unit area. In other words, the efficiency of converting supernova mechanical power into X-ray emission appears to be independent of the original supernova rate per unit area or volume.
It is also interesting that the normal spiral NGC 891 is so similar to the starbursts in this regard. Fig. 5 also makes it clear that the non-detections of diffuse emission in the halos of NGC 6503 and NGC 4244 are not particularly constraining – given their low FIR and radio brightness we would expect any diffuse X-ray emission generated by star-formation activity to be as faint or fainter than our existing limits.

4.3 The size of the X-ray emitting regions
The major-axis X-ray half-light radii (tabulated in Table 5 of Paper I) provide a convenient measure of the radial size of the diffuse X-ray emission in and near the plane of each galaxy (as a large fraction of the diffuse X-ray emission comes from kpc of the plane). To reduce the influence of absorption on the measured sizes we plot derived from the medium energy band (1.0–2.0 keV) against various simple measures of the radial extent of strong star-formation (), the extent of the old stellar population ( and the K-band ), and the galactic mass (circular velocity ) in Fig. 6a – d. The radial extent measure correlates weakly with , and K-band , and not at all with . The 75%-enclosed light radius shows a somewhat better correlation with and the K-band . Quantitatively, the diffuse X-ray radial extent is closest to the size of the non-thermal radio emission , as expected if the diffuse X-ray emission is generated by mechanical feedback from massive stars. The X-ray emission is more centrally concentrated than the radio emission, although this may due to the low spatial resolution of the NVSS data.
In contrast, the vertical extent of the diffuse X-ray emission in the halo appears independent of . We have only shown the effective halo exponential scale height in Fig. 6e – h, but the other tracers of minor axis extent, such as or , produce very similar looking plots. Instead of correlating with local measures of where the energy is injected (such as ), the distribution of X-ray-emitting gas at kpc depends on the total size of the host galaxy, given the approximately linear relationship between and and/or K-band . More quantitatively, Kendall’s Tau statistic (Press et al., 1992) is only for the correlation between and ( from zero correlation, equivalently probability of the correlation being spurious ), whereas the stronger correlations mentioned above have between and (), between the K-band and () and between and ().
Panel j of Fig. 6 plots against the ratio of the luminosity-weighted mean halo temperature to the mean mass surface density in the disk (note that the vertical component of the gravitational force is proportional to ). The correlation not particularly strong, in fact with a ( for zero correlation, ) it is weaker than the correlations between and or . This suggests that the X-ray temperature and scale height are not as directly related as would be the case for simple vertical hydrostatic equilibrium where .
We also investigated the relationship between and the ratio of (panel k of Fig. 6). If the vertical support of the gas now visible in X-ray emission was originally due to semi-turbulent gas motions, then we might expect the vertical velocity dispersion to be proportional to the rotational velocity of the galaxy (as found for the stellar vertical velocity dispersion, e.g. van der Kruit & de Grijs 1999). Evidence in support of this scenario is lacking in the current data, as the correlation is weak, ().
4.4 The brightness of the diffuse X-ray emission, compared to star-formation intensities and galaxy masses
The presence of correlations between the halo X-ray luminosity and total star-formation rate, and the vertical extent of the X-ray-emitting gas to the total size of the host galaxy, should automatically lead to correlations between the diffuse X-ray surface brightness and estimates of the star formation rate per unit area (star formation rate intensity, SFRI) in the host galaxy.
This is indeed what we find, as shown in Fig. 7. In panels a through e we plot a variety of proxies for the SFRI, and in panel f the circular velocity, against the mean diffuse X-ray surface brightness within the half-light height . Panels g through l repeat this, this time using the halo region surface brightness obtained within the fixed physical-size apertures used in the halo-region spectral fitting.
Although the half light heights are typically only kpc or so, is still a measure of the brightness of gas associated with the minor axis outflow in the starburst galaxies of this sample. We have demonstrated in this and previous papers that the brightest diffuse X-ray emission is directly associated with optically-emitting gas for which unambiguous kinematic evidence of minor-axis outflow exists (e.g. , in Heckman et al., 1990; McKeith et al., 1995; Shopbell & Bland-Hawthorn, 1998). In the normal spirals, NGC 891, NGC 6503 and NGC 4244, there is no existing kinematic evidence for outflow, and hence one might expect to be more of a measure of the brightness of the hot gas within the disk (as opposed to lying in projection within 2 kpc of the mid-plane), and also the mean brightness of unresolved point sources.
Note that the correlation between , or , and the FIR SFRI (Fig. 7b and h, where the angular size is that of the old stellar population, and hence independent of the angular size of the main star forming region in the host galaxy) are better than the correlations between or and the NVSS 1.4 GHz SFRI (Fig. 7a and g, where is a direct, although low spatial resolution, measure of the size of regions in which SNe are occurring). This is due to the better correlation between the vertical extent of the extra-planar emission with the total size of the host galaxy, than with the radial size of the main star-formation regions (as discussed in § 4.3).
The ordinate values in panels d, e, j and k of Fig. 7 are, to first order, star formation rate per unit galactic mass. These panels, along with panels f and l (which plot and against the circular velocity ), show that the brightness of the diffuse X-ray emission does not correlate with galactic mass, and hence is genuinely caused by star formation. It is therefore not the case that the correlation in panels a through c, and g through h, is spurious and arises simply because more massive galaxies, which can hold more hot gas in their potential wells, also have more star-formation in total.
Again, it is intriguing that there is no obvious transition in X-ray surface brightness between the normal and starbursting spirals – the normal spirals follow the trends one could extrapolate on the basis of the starburst galaxies alone. The sample of non-starburst disk galaxies we have available to compare against the starbursts is very small, but no good reasons exist as yet to believe that these galaxies are peculiar.
In summary, these results validate the basic assumption that the presence of extra-planar diffuse X-ray emission is driven by star-formation processes in the underlying disk, but that the large-scale structure of the host galaxy also plays a strong role in determining the properties and distribution of the resulting extra-planar emission.
In Fig. 8 we show the observed vertical extent of the diffuse X-ray emission against estimates of the SFRI (recast in terms of supernova rate per unit area ) and total galactic mass for the galaxies of our sample. We estimate the supernova rate based on the IRAS FIR flux. Dividing this SN rate by the inclination corrected value gives , the mean SN rate per unit area of the entire disk. If instead we use the approximate diameter of the non-thermal radio emission we obtain (See Tables 1 and 2 for the origin of these values). It is clear that there is no correlation between the vertical extent of the diffuse X-ray emission and the SN rate per unit area in the host galaxy, except that galaxies with lower SN rate per unit area than NGC 891 have no detected extra-planar X-ray emission. This is similar to other studies of extra-planar emission at radio and optical wavelengths. Dahlem, Lisenfeld & Golla (1995) found no correlation between the vertical scale height of non-thermal radio emission and the star formation rate per unit area in a sample of edge-on disk galaxies (see also Dahlem et al., 2001). In a H imaging study of edge-on disk galaxies Miller & Veilleux (2003) also find no correlation between scale heights and the star formation rate per unit disk area.
Fig. 6, in combination with Fig. 8, implies that the density scale height of the X-ray emitting material depends on the absolute size of the host galaxy, and not on the spatial distribution or intensity of star formation within it. Note that this is not a statement regarding the absolute physical extent of superwinds, which almost certainly is much greater than the region probed by current observations (and which will physically depend on the total amount of energy deposited by SNe and the density of the IGM).
We were initially motivated to investigate the quantitative relationship between the extra-planar X-ray properties and the SFRI indicators and by optical studies of the eDIG (see Dettmar, 1992; Rand, 1996; Hoopes et al., 1999; Rossa & Dettmar, 2003, among others). These had demonstrated the presence of extra-planar optical emission correlated with , in the sense that galaxies with high values of were more likely to show evidence of eDIG. Combined with the studies of Lehnert & Heckman (1995, 1996); Dahlem et al. (2001) that demonstrate that IR-warm galaxies with are extremely likely to have extra-planar emission, kinematic evidence of outflow and/or non-thermal radio halos, we expected a correlation between high star formation rate per unit area and the luminosity and extent of diffuse X-ray emission in disk galaxy halos.
Nevertheless, in the X-ray band it appears that the correlation we have found between the surface brightness of the diffuse X-ray emission and star formation rate per unit area is the combination of two independent effects:
-
1.
A relatively uniform efficiency of converting mechanical energy to X-ray emission (§ 4.2), i.e. , the exact physics of which is not fully understood.
-
2.
The vertical extent of the X-ray emission is directly related to the size of the host galaxy, or the K-band half-light radius (§ 4.3), possibly for the reasons discussed below.
This does not mean that the SFRI is not an important parameter, in particular when considering the conditions necessary to drive gas into the halo of a galaxy (as we shall discuss below), but that other parameters play a significant role in shaping the emission we see.
In terms of the interpretation of the extra-planar X-ray and H emission presented in Paper I (and summarized in § 3), item 2 above can be explained if disk galaxies have gas throughout their halos, with vertical density scale heights approximately similar to the optical diameter of the host galaxy. Depending on the exact model assumed the mass of gas in the halo of a Milky Way-like galaxy prior to any starburst is a few times to a few times (see models 4 and 5 in Strickland et al. 2002).
4.5 Limits placed on cosmological accretion models for the origin of hot gas in the halos of normal galaxies
Without deep X-ray observations of a larger sample of edge-on normal spiral galaxies it is difficult to critically test cosmological accretion models of the type presented by Toft et al. (2002), and Sommer-Larsen et al. (2003). Excluding the starbursts from consideration for the time being being, we would expect halo 0.3–2.0 keV X-ray luminosities of order , 0.20 and for NGC 891, NGC 6503 and NGC 4244 respectively, based on the Toft et al. model.
These luminosities are based on converting the bolometric luminosity as a function of rotation velocity quoted in Toft et al. (2002) into Chandra energy band soft X-ray luminosities. Here we have assumed the X-ray emission has a fixed temperature of 0.16 keV (the virial temperature for the NGC 891 halo . The observed luminosity-weighted mean temperature obtained for NGC 891 is keV), a metal abundance (the conversion between the used by Toft et al. and 0.3–2.0 keV energy band is largely independent of ), and is described by an exponential surface brightness profile with a fixed surface brightness scale height of 2 kpc (as Toft et al. 2002 do not provide any measure of how the characteristic size of the X-ray emission varies with galaxy rotation velocity). For such a distribution a fraction of the total luminosity arises in gas at kpc. Toft et al. (2002)’s predicted bolometric luminosity (0.012-12.4 keV energy band) of (scatter dex) thus converts to a total 0.3–2.0 keV X-ray luminosity (i.e. integrated over all heights ) of (for simplicity we ignore the fact that the halo temperature should vary with rotation velocity as approximately , as hence even lower X-ray fluxes would be expected in the 0.3–2.0 keV energy band for NGC 6503 and NGC 4244).
The predicted accreted halo luminosities given in the first paragraph of this section should be compared the to the observed values of for N891 and upper limits of and for NGC 6503 and NGC 4244 respectively (see Table 9 of Paper I). This comparison indicates that the predicted accretion-model X-ray luminosity for a galaxy like NGC 891 is close to that value observed, and that the NGC 4244 and NGC 6503 observations are not deep enough to strongly constrain the accretion model. It is worth noting that it is far from clear what fraction of the gas accreted from the IGM by disk galaxies is heated to the halo virial temperature (see for example Katz et al. 2003 and references therein for a theoretical perspective).
Although, based on luminosity alone, some fraction of the X-ray emission in the halo of NGC 891 might be due to gas accreted from the IGM, we find the reasoning presented in § 4.2, 4.3 and 4.4 more compelling as evidence that the extra-planar X-ray emission in NGC 891 is associated with, and dominated by, feedback from star-formation. This apparent commonality of normal spirals with starbursts, based on the properties of their extra-planar emission, might be an artifact of the small number statistics. Deep X-ray observations of other edge-on normal spirals, spanning a broad range of star-formation rates, are clearly necessary before firmer conclusions can be drawn. Nevertheless, a robust finding of a smooth transition in the halo gas properties from normal to starburst galaxies would have major implications for understanding the large-scale structure of the ISM and stellar feedback processes in galaxies.

5 Comparison the theoretical models of mechanical energy feedback from massive stars
5.1 Disk blow-out energy requirements
In a seminal paper, Mac Low & McCray (1988) considered, both analytically and numerically, the amount of mechanical energy that supernovae and stellar winds need to supply for a superbubble to blow-out of the stratified atmosphere of a galactic disk. Blow out occurs if the dense shell of swept-up gas marking the outer boundary of a superbubble ceases to decelerate and begins to accelerate down the density gradient. At this point Rayleigh-Taylor instabilities set in and rapidly fragment the superbubble shell, leading to the venting of the hot high pressure gas from the interior of the bubble out into the surrounding medium. As this venting of hot gas (the gas blowing out) occurs when the outer shell fragments and breaks up the term “breakout” is often used synonymously with blow out. This theory, with minor alterations, has been widely used since that time, in particular with respect to assessing the the prospects for metal ejection from galaxies (e.g. Koo & McKee, 1992; Martin, 1996; Mac Low, 1996; Tenorio-Tagle, 1996; Silich & Tenorio-Tagle, 1998; Mac Low & Ferrara, 1999; Ferrara & Tolstoy, 2000; Ferrara, Pettini & Shchekinov, 2000; Silich & Tenorio-Tagle, 2001). Note that blow out of a superbubble from the disk ISM of a galaxy does not automatically imply that gas escapes into the IGM — more mechanical work must be done by the vented hot gasses to move any gaseous halo medium. Simulations of superwinds show that these hot gasses blow new bubbles in the halo, sweeping the ambient halo gas up into new shells (e.g. Tomisaka & Bregman, 1993; Suchkov et al., 1994; Strickland & Stevens, 2000). We shall address this in § 5.2.
Mac Low & McCray demonstrate that whether or not a bubble blows/breaks out of a given atmosphere depends only on the mechanical energy input rate, i.e. mechanical luminosity, driving the bubble, and the pressure and scale height of the ambient ISM the bubble is expanding into — for convenience we re-derive this result below. For such an important theoretical construct, there has been surprisingly little in the way of observational testing and calibration. Heckman et al. (1990) demonstrated that the energy injection rates in starburst galaxies exceeded this critical blow-out luminosity (hereafter ), but is is not clear from that work (and other comparisons to starbursting galaxies e.g. Martin 1996) what the lowest mechanical energy injection rate is that leads to blow-out in real galaxies.
In this section we shall use the observationally determined presence of hot gas in the halos of our sample galaxies as empirical evidence for blow-out from the disk, and compare the estimated rates of SN energy return in disks of these galaxies to theoretical values of . At present the observational results do not strongly constrain the theory. When larger samples of edge-on spirals have had deep X-ray observations made of them the promise of this method should be realized.
5.1.1 The critical mechanical luminosity for disk blow-out
The theoretical critical mechanical luminosity required for blow-out is based on the following concepts. If, in a stratified disk with a vertical gas density distribution , an expanding superbubble or SN remnant has an expansion velocity (the shell expansion velocity) greater than the sound speed in the ambient ISM by the time it reaches a vertical height of order the scale height of the disk, then the dense shell will begin to accelerate. At this time the bubble or remnant shell will fragment due to Rayleigh-Taylor instabilities. The hot, high pressure, plasma interior to the shell will vent out through the fragmented shell into the surrounding medium, i.e. the halo for blow out from the disk of a galaxy. The dense fragments of the superbubble shell will be carried out along with the hot gas, in fact the ram pressure of the hot gas streaming past them will accelerate the shell fragments to higher velocities than the original shell expansion velocity (see e.g. Chevalier & Clegg, 1985; Heckman et al., 1990, 2000).
If instead , the bubble’s expansion will continue to decelerate and eventually coast to a stop without blowing out. Radiative cooling will eventually lead to depressurization of the bubble interior, followed by the collapse of the bubble, in addition to damage caused by galactic differential rotation and random ISM motions.
A more formal analysis identifies at as the critical requirement for blow-out in a single-phase exponential atmosphere (see Ferrara & Tolstoy, 2000), numerically verified by simulations showing blowout occurring once the bubble reaches a height of (Mac Low & McCray, 1988; Mac Low, McCray & Norman, 1989)
For a bubble driven by a constant mechanical luminosity into a medium of uniform and constant ambient density (Castor, McCray & Weaver, 1975; Weaver et al., 1977), the radius and shell expansion velocity as a function of time are
| (1) |
and
| (2) |
where . Rearranging these equations gives us the expansion velocity at the point that the bubble radius is 3H:
| (3) |
where is a numerically-determined correction factor to account for the vertical decrease in density leading to bubble expansion velocities greater than in the constant density case. Using a code that numerically integrates the appropriate equations of motion (Strickland & Stevens, 1999), we find 444Ferrara & Tolstoy (2000) present a purely analytical derivation of including the effect of the density decline, but we find this method over-predicts by a factor 3.7 over our numerical result (even when errors in their equations 24 and 25 are corrected for). We speculate that this discrepancy is due to their neglect of the inertia of the cold shell in their calculation of the shock velocity..
The resulting minimum mechanical luminosity required to blow out of this atmosphere, , is
| (4) |
where is the thermal pressure in the ambient ISM. Note that this luminosity is a factor lower than the critical luminosity derived by Mac Low & McCray (1988), i.e. blow-out from the disk is slightly easier. Converting to units more appropriate for the disk of a normal spiral,
| (5) |
where and . More energy is needed to blow out of a starburst region, where measured ISM pressures reach K cm-3 (McCarthy et al., 1987; Heckman et al., 1990; Lehnert & Heckman, 1996).
5.1.2 Disk blow out due to individual stars clusters, or through cooperation between multiple clusters?
With respect to blow out from the disk of normal star forming galaxies is it commonly assumed that each superbubble is powered by a single star cluster. In contrast, it has long been recognized that superwinds from galaxies with nuclear starbursts are powered by the collective energy return from the massive stars within the entire starburst region, typically a few hundred parsecs in size. This is a well established observational result that can be demonstrated in various ways, e.g. the superwind pressure profiles in Heckman et al. (1990) and Lehnert & Heckman (1996) demonstrate that mass and energy are being injected relatively uniformly over a region equal in size to the starburst region. Another example is that the edges of best-resolved superwind outflows, in galaxies such as M82 and NGC 253, matching up well to the edges of the nuclear starburst regions (Strickland & Stevens, 2000; Strickland et al., 2000). This is by no means surprising, as star clusters tend themselves to cluster spatially just as massive stars tend to form within clusters, with starbursts representing the extreme of the phenomenon (one can describe the M82 starburst as R136’s within a region only 2–3 times larger than 30 Doradus, see O’Connell et al. 1995). Furthermore, Meurer et al. (1995) demonstrate that only a fraction % of the massive stars within nearby starburst regions are associated with very massive clusters, there being a substantial population of massive stars in starburst regions not associated with obvious clusters (see also Tremonti et al., 2001; Chandar et al., 2003).
The question arises whether superbubbles can be cooperatively driven by massive stars in multiple stellar clusters in situations less extreme than those in nuclear starbursts, i.e. in disk-wide starbursts or even in normal star forming galaxies? This process need not be as efficient or as common as in the nuclear starbursts, but it might occur often enough to be significant in terms of the disk/halo interstellar interaction. There are a number of reasons why it is worthwhile to consider such a scenario. Firstly, individual clusters that are massive enough to drive a superbubble capable of blowing out of the disk of a normal spiral galaxy on their own are relatively rare, as we show in § 5.1.2. If only one or two such clusters exist in a galaxy at any given time it would be difficult to sustain a galaxy-wide fountain-driven hot halo (assuming that these are not extremely peculiar spiral galaxies). Secondly multi-dimensional simulations of the ISM with energy return by SNe and stellar clusters show that bubbles do merge, and once merged can potentially become powerful enough to escape the disk (de Avillez, 2000). A third issue, related to the first, is that the normal spiral galaxy NGC 891 has a very similar ratio of halo-region X-ray luminosity to FIR luminosity (i.e. total star formation rate) to the starbursts with superwinds, implying a similar total efficiency in converting the initial supernova mechanical energy into soft X-ray emission. If cooperative action does not occur in normal spirals and only the most massive cluster drive bubbles that blow out of the disk, then a smaller fraction of the massive stars forming in NGC 891 would be responsible for the hot gas its the halo. To achieve a ratio similar to that in the starbursts would then require fine tuning the physical processes in the halo of NGC 891 to be more efficient at radiating soft X-rays, despite the other similarities to the extra-planar X-ray emission from the starbursts.
A final reason to consider blow out due to collective superbubble driving is that it naturally leads to an analytical formulation in which there is a critical star formation rate (or supernova rate) per unit area necessary for blow out. From the stand point of observational studies of galaxies beyond the local group it is much easier to estimate a mean star formation per unit area than to measure the properties of individual stellar clusters. Indeed, individual star clusters are likely be heavily obscured in the edge-on galaxies where the presence of extra-planar hot gas is empirical evidence for blow out from the disk. Furthermore estimates of the star formation rates in these galaxies may only be available using low spatial resolution FIR observations. As we shall discuss later, this formulation remains useful when considering blow out from the halo even if cooperative action does not apply to superbubble blow out from the disk.
Energy return from non-interacting star clusters Let us now consider what the mass is of an OB association that contains enough massive stars enough to power a superbubble capable of blowing out of a disk of a normal spiral galaxy, assuming that only a single cluster can power a specific superbubble. The critical energy given in Eqn. 5 can be recast in terms of the number of massive stars formed in the cluster, and from that in terms of star cluster mass. Assuming all stars in a cluster form instantaneously, then the period over which energy injection occurs corresponds to the lifetime of the least massive star to undergo core collapse, i.e. stars with initial masses , which is – Myr. The energy injection rate over this period is approximately constant, see e.g. Leitherer & Heckman (1995). The time needed for a bubble with to expand to the point it breaks out of the disk is similar to this time period, validating the assumption of continous energy injection in the formulae used to derive . We assume that each SNe returns of mechanical energy to the ISM, where the thermalization efficiency is the fraction of the initial kinetic energy per supernova that can be used to drive a bubble, i.e. the energy fraction not radiated away prior to each young remnant overlapping with other SN remnants. We further assume a Salpeter IMF with upper and lower mass limits of 100 and respectively, which gives one massive star per of stars formed. Where we to assume a more realistic IMF extending down to the hydrogen burning limit (e.g. that of Kroupa, Tout & Gilmore, 1993) we would get less SNe per mass of stars formed, i.e. the cluster masses required for disk blow out would be larger and hence blow out rarer.
The Milky Way has a gaseous scale height of – kpc in the neutral ISM (Dickey & Lockman, 1990; Sembach & Danks, 1994), and between 0.5 – 1.5 kpc for the free electrons tracing the warm ionized component (Reynolds, 1989; Nordgren, Cordes & Terzian, 1992). The mean number density and thermal pressure in normal star-forming spiral like the Milky Way or NGC 891 are and (Ferrière, 2001; Wolfire et al., 2003). Assuming kpc, and then in a typical region of a normal spiral galaxy. This correspond to the energy return from SNe, or a cluster mass of . A canonical value of the supernova thermalization efficiency under normal interstellar conditions is (Thornton et al. 1998, note that is expected to be higher in regions of higher star formation rate per unit volume such as star clusters e.g. Larson 1974; Cantó et al. 2000). These results are consistent with those of Ferrara et al. (2000), who also considered blow out from the disk assuming that superbubbles can only be blown by a single star cluster. For galaxies with star formation rates equivalent to the normal spiral galaxies we are discussing they derived a critical number of SNe for blow out similar to, or larger than, the number we derive above.
Star clusters as massive as are not common in normal, non-starbursting, galaxies. By way of comparison consider the masses of the most spectacular and massive star clusters in the Local Group. The Arches cluster in the Galactic center, although containing % of all the Wolf-Rayet stars in the Galaxy, has a mass (Figer et al., 2002). The R136 cluster in the 30 Doradus nebula of the LMC has an estimated initial mass of (Malamuth & Heap, 1994), or , upper limit (Brandl et al., 1996). The entire Orion Nebula Cluster, has a total gravitating mass of (Hillenbrand & Hartmann, 1998). From this it is clear that the most massive, most populous, star clusters are capable of driving superbubbles powerful enough to blow out of normal spiral galaxy disks on their own, unless is of order unity.
How common are such clusters, and what fraction of massive stars form in these massive clusters? The number of massive stars per star cluster appears to follow a power law such that the number of of clusters with massive stars is proportional to (see Oey et al., 2003, and references therein). We will treat this as a continuous distribution with limits and for computational convenience, as the results from the exact solution (see Oey et al., 2003) are essentially identical in the regime we consider. The fraction of star clusters containing or more massive stars is thus . If we generously assume that even normal galaxies can potentially form star clusters with masses up to , then . Assuming a lower will reduce . For cluster thermalization efficiencies of 0.1, 0.3 and 1.0 the required number of SN for disk blow out are 1090, 327 and 109 respectively, with corresponding cluster masses of and . For these three efficiencies the fraction of star clusters powerful enough to blow out of the disk of a normal spiral galaxy are and respectively. In other words it is rare to find a star cluster that is capable of driving, on its own, a superbubble that can blow out of the disk of a normal spiral galaxy.
Collective energy return over galactic scales Motivated by the preceding arguments we explore the requirements for blow out from the disk of normal spirals in a scenario at the opposite extreme from isolated, non-interacting star cluster, model commonly adopted. We shall assume that separate star clusters can cooperatively blow a single bubble, just as starburst regions drive a single superbubble and then superwind. This gives rise to a critical star formation rate (or supernova rate) per unit area necessary for blow out, which is a number that is easier to empirically constrain in edge-on disk galaxies (e.g. see Table 2) than the masses of specific clusters.
Mac Low & McCray (1988) find that at blowout the radius of the superbubble within the disk is . We therefore assume that some significant fraction of all SNe due to massive star formation within an area of the disk can contribute energetically to creating a blowout, i.e. .
| (6) |
where is the SN rate per unit disk area, and is the kinetic energy return per SN event.
Note that hydrodynamical simulations demonstrate that the expansion of a wind-blown bubble or superbubble is relatively insensitive to the spatial distribution of the energy injection within it (e.g. Strickland & Stevens, 1998, 2000), for the reasons discussed by Mac Low & McCray (1988). We can thus continue to use the standard expansion laws despite having a more randomly distributed source of mechanical power.
Physically is the thermalization efficiency within individual clusters where radiative losses are small (e.g. Cantó et al., 2000), while represents the effective efficiency of combining the energy output from the multiple clusters within the area of disk that can possibly contribute to a bubble just about to blow out. Theoretically, both and are functions of the star formation rate, as supernovae alter the porosity of the ISM, and hence alter radiative energy losses and the effectiveness of collective action (Larson, 1974). Relatively little theoretical work has been done with the aim of estimating for realistic cluster conditions, and this theoretical work has not been tested against observation in any meaningful way. Although simulations of the ISM that include interacting superbubbles do exist (e.g. de Avillez, 2000), these tend not to discuss the energetic efficiency with which separate bubbles merge. One situation somewhat similar to that we envisage can be found in a numerical simulation of a primordial galaxy by Mori, Ferrara & Madau (2002). They simulated bubbles blown by 90 star clusters spread over a region kpc in radius and measured the fraction of the total mechanical energy injected by SNe escaping into the IGM to be – %, depending on the initial conditions used. Their simulation effectively assumed , and their galaxy is not exactly comparable to a present day spiral disk (e.g. it lacks a halo), but these results imply – (in our model is the fraction of available SN mechanical power released within the disk that is available to drive the final bubble that blows out, but less than this fraction of energy will reach the halo due to radiative energy losses that would occur even in the absence of superbubble merging and collective action). One would expected to be of this order in normal disk galaxies. Physically the primary radiative energy losses in two merging bubbles would come from the colliding shells, as these are dense and hence will be efficient radiators if shocked in the collision. However, only % of the total mechanical energy originally fed into a superbubble is thought to be contained in the shell, the majority of the energy () residing in the hot interior and % being lost during shell formation (Mac Low & McCray, 1988). The hot gas in merging bubbles is unlikely to suffer significant additional radiative losses, given its low density. For starbursts, where the evidence for effective collective action is best, may be of order unity, as the higher SN rate per unit volume should lead to higher ISM porosity and hence efficient thermalization (e.g. Larson, 1974). In other words the net efficiency throughout the entire starburst region might be comparable to the thermalization efficiency immediately within a dense star cluster (e.g. Cantó et al., 2000). By way of comparison the SN rate per unit volume in the center of M82 is approximately two orders of magnitude higher than the SN rate per unit volume in the simulations of Mori et al. (2002) that we discuss above.
Combining Eqn. 6 with Eqn. 4, we obtain the critical SN per unit disk area for blow out from the disk, , to be
| (7) |
Note that this is no longer dependent on the scale height. Large gaseous scale heights do not inhibit blow out as the bubble can draw mechanical energy from a correspondingly larger region of disk. Scaling to more convenient units,
| (8) |
or alternatively
| (9) |
For the purposes of comparing observation with theory should ideally be calculated on a location-by-location basis within a given galaxy, based on the local supernova rate , or star formation rate, summed within an area , where is the appropriate gas density scale height for the region we are interested in assessing blow out from (be it the thin molecular disk, the more extended Reynolds layer, or the halo itself) — i.e. some knowledge of the scale height is still required.
5.1.3 Constraints on feedback efficiencies from the observed luminosities
Both the standard bubble blow out theory presented in § 5.1.1 and the slightly modified version above depend strongly on the efficiency of mechanical energy feedback through terms such as and . Theoretical work suggests these efficiencies depend on the local star formation rate through the porosity of the ISM (Larson, 1974), but the exact values are hard to quantify and there is little agreement between different groups (e.g. contrast Strickland (2002) with Recchi, Matteucci & D’Ercole (2002)).
Adopting a different approach, we can crudely constrain the net mechanical energy feedback efficiency by relating the rate of mechanical energy injection into the halo to the observed X-ray luminosities. From the relationship between the FIR luminosity and SN rate given in Heckman et al. (1990), , we obtain that the rate of mechanical energy injection into the halo is
| (10) |
where we ignore energy losses due to superbubble shell formation and any superbubble merging that occurs (see § 5.1.2). Including these radiative losses might reduce by a factor , and lead to a similar increase in the estimated efficiencies, if analytical theory and numerical models of winds are right (see e.g. Strickland & Stevens, 2000).
Direct observation of the volume-filling high-pressure gas that drive superwinds would be the best method of measuring the supernova thermalization efficiency. In the absence of this we are forced to estimate from a theoretically-determined relationship between the X-ray luminosity and the mechanical power actually driving the wind. The fraction depends on the physical process responsible for the soft X-ray emission, e.g. non-radiative wind shocks, or possibly conductive interfaces between hot and cold gas. For X-ray emission from conductive interfaces (Weaver et al., 1977; Chu & Mac Low, 1990), which is the mechanism that has been most extensively explored to date, depends only weakly on the ambient density and the value of the thermal conductivity ( scales almost exactly in proportion to , and increases weakly for higher ambient density or thermal conductivity). We calculated for conditions appropriate for superwinds using the code described in Strickland & Stevens (1999), which numerically solves the Weaver et al. (1977) model and uses the Mewe et al. (1995) hot plasma code to calculate the X-ray emission. For in the range to , gas densities in the range to , ages in the range to Myr and values of the thermal conductivity in units of the Spitzer conductivity 0.1 to 10, we find a mean (with a scatter dex). In our hydrodynamical simulations of superwinds (Strickland & Stevens, 2000), which do not include thermal conduction, we find a similar fraction of the mechanical energy emerging in the soft X-ray band (again with a significant scatter, depending on the exact initial conditions assumed).
For the time being we shall assume that is a reasonable estimate of the fraction of the wind mechanical power that is radiated in the soft X-ray band. Combining this with Equation 10 we obtain
| (11) |
The typical ratio we observe is , with the range being – , which this implies with a range of 0.14 – 0.48. The normal spiral galaxy NGC 891 has one of the lowest ratios in the sample, with , and thus a lower than average value for (NGC 891 is the lowest if we exclude the somewhat doubtful detection of halo emission from NGC 4945, although it is only a factor lower than the mean ratio). a lower than average value for .
5.1.4 Comparison to observations
If, as seems most probable, the origin of the diffuse extra-planar X-ray emission around disk galaxies is due to SN feedback, then empirically assessing whether significant blow out from the disk has occurred is simple. It effectively reduces to identifying which galaxies have diffuse X-ray emission at kpc (i.e. several disk scale heights). With a sample of edge-on galaxies, some of which have extra-planar hot gas and other which do not, and with reasonable estimates of the star formation or SN rate per unit area for each galaxy we can then empirically determine (a) whether there is a critical SN rate per unit area () above which blow out from the disk occurs, and if so (b) the value of this critical SN rate per unit area.
In principle we could compare the empirically derived value of with the theoretical value (e.g. Equ. 8), and hence test whether the theory is correct or not. In practice it is currently impossible to use this method to meaningfully test superbubble blow out theory due to a mixture of theoretical and observational uncertainties.
The primary theoretical uncertainties are in the mechanical energy thermalization efficiency for individual star clusters and efficiency of cooperation between multiple clusters . The largest uncertainties in these parameters exist the for star forming conditions in.normal disk galaxies, i.e. galaxies that probably span the critical threshold in star formation rate per unit area for disk blow blow out.
Observational difficulties include uncertainties in estimating the star formation or supernova rates, and more significantly the uncertainties in the effective area and hence the mean SN rate per unit area.
Currently it is only practical to estimate the total supernova rate of each of these galaxies (or other edge-on disk galaxies that will be observed with Chandra or XMM-Newton). This prevents us from calculating in the location-by-location manner described in § 5.1.2555We note that H imaging could be used to evaluate on a location-by-location basis within the same galaxy, although this method has typically been used on to calculate mean galactic SFRI values and blow-out thresholds (e.g. Rossa & Dettmar, 2003). H emission in the disk is typically much more radially extended than the regions responsible for driving the outflow (the exception being M82, where star-formation is now confined solely to the nuclear region), i.e. star formation in some regions of the disk is occurring at rates per unit area below the critical value. This is graphically illustrated in Fig. 1 and 2. Of course, H measurements suffer the weakness that they systematically underestimate the true SFRI in the regions with the highest star formation rates due to the associated higher levels of extinction.. Nor do we have exact measures of the scale height of the disk ISM, and depends sensitively on the assumed scale height. Considering the issue of disk blow out, the ISM scale height is likely to be of order a few hundred parsecs to a kiloparsec or two. As this is similar to the magnitude of (see Table 2), one could argue that it is reasonable to use as a plausible to use when assessing disk blow out (this value is denoted as in Table 2 and in Fig. 8). In contrast the diameter (typically – kpc) is commonly used when estimated mean galactic star formation rates per unit area in optically-based studies of extra-planar warm ionized gas (e.g. Rand, 1996; Hoopes et al., 1999; Collins et al., 2000; Rossa & Dettmar, 2003; Miller & Veilleux, 2003). This leads to estimated mean SN rates per unit area orders of magnitude lower (this value is denoted as in Table 2 and in Fig. 8).
From Fig. 8 it appears that all galaxies with SN Myr-1 kpc-2 have diffuse extra-planar X-ray emission, indicative of disk blow out. Let us assume that the divide between disk blow out and superbubble confinement occurs at or near this value of . As the galaxy with the lowest value that also has detected extra-planar emission is the normal spiral galaxy NGC 891, let us assume that , and . Thus equation 8 would then predict disk blow out for SN Myr-1 kpc-2, a factor lower than the observationally-estimated value, apparently a strong discrepancy between blow out theory and observations. However, if we use instead, then galaxies with SN Myr-1 kpc-2 appear to have disk blow out, apparently in good agreement with blow out theory.
In summary, although it is relatively easy to empirically determine that a galaxy has blown hot gas out of the disk into the halo, a quantitative comparison to theory is much more difficult. With the present uncertainties it is not clear whether the energy requirements for superbubble blow out that the standard theory predicts (with or without allowing for collective energy return from multiple clusters) are accurate, even to within an order of magnitude. More theoretical and observational study is required before we can meaningfully test superbubble blow out theory:
-
1.
X-ray observations must be deep enough to rule out significant amount of hot gas in the halos of low SF rate galaxies, so that we can be certain that blow out from the disk has not occurred (see § 4.2).
-
2.
Observational estimates of star formation or supernova rates per unit area should ideally use spatially resolved estimates of the star formation rate, and more importantly, observed disk gaseous scale heights (see § 5.1.2).
-
3.
We need more theoretical study of the energetic efficiencies of mechanical feedback in clusters and in the realistic multi-phase ISM, in order to understand how and depend on the star formation intensity and local ISM properties (see § 5.1.3).
5.2 Ejection of metal-enriched gas into the IGM by superwinds
Much of the preceding discussion as revolved around the blow out of superbubbles from the disk of normal star forming galaxies. We now wish to briefly turn to the issue of ejection of hot, metal-enriched, gas into the IGM from starburst-driven superwinds.
5.2.1 The plausibility of halo blow-out
Material blowing out from the disk does not automatically escape into the IGM, as it must work against the obstacle provided by gas in the halo before being able to reach the IGM, as mentioned in § 1.
Based on the observed X-ray surface brightness profiles of the extra-planar emission of the galaxies within this sample, it is appropriate to represent the original halo gas distribution as an exponential with density scale height – kpc, i.e. twice the observed surface brightness scale height. Note that optical studies of the extra-planar emission from warm ionized gas in normal and some starburst galaxies also indicate exponential gas distributions with very similar scale heights (Hoopes et al., 1999; Collins et al., 2000; Miller & Veilleux, 2003).
For such a stratified halo gas distribution the standard superbubble blow out energy requirements can be applied (this time with respect to halo blow out) to any bubble or wind that manages to blow out of the disk. Simulations of superwinds clearly show that the halo medium is swept-up into a new shell surrounding the hot gas vented from the disk (Suchkov et al., 1994; Strickland & Stevens, 2000). We will assume that superbubble blow out theory is correct for the remainder of this section. Note that this directly implies that the critical region of space around a galaxy that can prevent escape into the IGM is within ( – 24 kpc) of the mid-plane, a region that can be probed by existing observational methods. We need not concern ourselves about the density and pressure of gas at larger, kpc, distances from the host galaxy666 This is true unless the galaxy happens to be in a high density environment such as a cluster or compact galaxy group, where the pressure and density of the inter-cluster or inter-group medium may be significant, in which case the arguments of Silich & Tenorio-Tagle (1998); Murakami & Babul (1999); Silich & Tenorio-Tagle (2001) apply..
We can now apply the arguments of § 5.1 to halo blow out. The proportionality between the halo region X-ray flux and the IRAS FIR flux (and hence the total galactic SF rate) strongly suggests that the halo can draw on mechanical energy from a significant fraction of the entire star-forming disk. If the SN rate per unit area in the disk is sufficient to blow out from the disk, then the collective blow-out model can be applied to the hot gas now in the halo. The appropriate scale height to use is that of the halo gas density distribution , either directly measured from the X-ray data or estimated using empirical results of § 4.3. There we showed that (or the K-band half light radius ). Thus the appropriate mean supernova rate per unit area to calculate for assessing halo blow out is proportional to .
The only significant differences from the case of assessing disk blow out are then as follows:
-
1.
The appropriate density and pressure are that of the halo, evaluated at the galactic mid-plane (e.g. see Shull & Slavin 1994). For typical galactic environments now and at high redshift, the density and pressure of any bound, non-transient, halo medium will be less than those in disk.
-
2.
The additional energy losses during disk blow must be accounted for. In the starbursts, a good case can be made that radiative losses are negligible, based both on the observational lack of significant X-ray, O VI and optical emission (Heckman et al., 1990, 2001; Hoopes et al., 2003). In the high resolution hydrodynamical simulation of Strickland & Stevens (2000) % of the mechanical energy injected within the disk is transported into the halo.
- 3.
Making full use of this to assess blow out from the halos of galaxies requires that we know the critical SN rate per unit area for disk blow out. Nevertheless, with an observationally-calibrated theory of this sort it will be possible to assess whether gas can blow out into the IGM. What this analysis does indicate is that extended gaseous halos around normal star-forming galaxies (excluding galaxies in dense gaseous environments such as clusters) do not automatically prevent outflows from reaching the IGM. The total power requirements for blowing out of a gaseous halo will more somewhat more exacting than for simply blowing gas out of the disk, but this is not surprising, nor a significant problem given the SN rates in nuclear starbursts. Nevertheless the most important point we wish readers to extract from this discussion is that the critical region of space around a galaxy that can prevent escape into the IGM is most probably within ( – 24 kpc) of the mid-plane, which is a region well probed by existing observational methods.
5.2.2 Requirements for escape into the IGM
Unambiguous observational proof of ejection of material into the IGM by outflows requires kinematic evidence of outward motion at at heights above the mid-plane of the host galaxy (where is the escape velocity at that location, and not the escape velocity from the center of the halo, and is the density scale height of the gaseous halo)777Note that , and preferably the summed thermal and kinetic energy, must be assessed on a phase-by-phase basis. The cool shell velocity (as used by, for example Ferrara & Tolstoy, 2000; Ferrara et al., 2000), or the temperature of the X-ray emitting plasma (e.g. Wang et al., 1995; Martin, 1999), are not particularly meaningful tools for assessing whether gas will be retained. The energy per particle in the hot phases is much greater than that of the cool shell material, and it is likely that the kinetic energy of the X-ray-emitting hot gas can exceed its thermal energy several times (Strickland & Stevens, 2000). 888We wish to emphasize that gas motions at velocities less than the local escape velocity do not necessarily mean that the gas will be retained by the host galaxy. The gaseous phases in superwinds for which kinematics are available are entrained into the wind, either by Kelvin-Helmholtz instabilities along the wall of the outflow, or as fragments of the original superbubble shell that fragmented at disk blow out. Their motions are not ballistic, as they are embedded in the higher velocity fluid of merged supernova ejecta. Following blow out from the disk their kinematics are no longer determined by the standard Weaver et al. (1977) wind-blown bubble model.. This is observationally challenging, especially given that the most interesting, i.e. metal-enriched, gas phases are very tenuous, and very hot and highly ionized. Such observations, even of the denser phases, are unlikely to be accomplished for many years. Nevertheless, what the theoretically-and-observationally motivated argument in the preceding section demonstrates is that it is likely that starburst galaxies, even ones as massive as , and possibly some normal spiral galaxies, do eject material into the IGM. This is consistent with the effective yields and metal-loss scenario presented by Garnett (2002) and Tremonti et al. (in preparation). Put another way, we regard escape as an eminently plausible fate for at least some fraction of the material in superwinds, as currently there are no convincing theoretically or observationally-motivated ways to absolutely prevent escape.
6 Summary
Making use of the detailed measurements of the diffuse X-ray emitting gas in and around the sample of seven starburst and three normal edge-on spiral galaxies presented in Paper I, we have investigated how the properties of this hot gas correlate with the size, mass, star formation rate and star formation intensity in the host galaxies. Although not a large sample, these galaxies do span the full range of star formation activity found in spiral galaxies. The three normal spirals are too small a sample on their own to establish any hard conclusions about the properties of diffuse X-ray emission in normal spiral galaxies, but in combination with the starbursts we can make a meaningful initial assessment of how closely the properties of the diffuse X-ray emission in these systems resemble those of the edge-on starburst galaxies.
We demonstrate that the extra-planar (i.e. halo-region) diffuse X-ray emission in the starburst galaxies is ultimately driven by star formation activity within the disk, i.e. through starburst-driven superwinds. Accretion of gas from the IGM, or AGN-driven winds (see Paper I), do not appear to be significant in this sample.
Considering both the starburst and normal spiral galaxies, larger galaxies show more radially and vertically extended diffuse X-ray emission, but beyond this correlation we find no evidence that galactic mass plays any part in determining the diffuse hot phase in the disks and halos of these galaxies. The extent of the diffuse X-ray emission parallel to the plane of the host galaxy correlates well with estimates of the extent of star formation within the disk, further evidence that the soft thermal X-ray emission is a result of mechanical energy feedback from massive stars. The vertical extent of the diffuse X-ray emission correlates best with the absolute size of the host galaxy, as if the emitting gas fills the halo. Exponential scale heights are similar to those found in the extra-planar warm ionized gas from optical for samples of star forming disk galaxies.
The luminosity of the diffuse X-ray emission, both within the disk and halo, is determined primarily by the rate of mechanical energy injection due to SNe in each galaxy (which is correlated to the star-formation rate). The surface brightness of the extra-planar diffuse X-ray emission correlates with the star formation rate per unit area in the underlying disk, but this correlation is a combination of the previously mentioned luminosity and size correlations.
The properties of the diffuse X-ray emission in the normal spiral galaxies is very similar to that found in the starburst superwind galaxies. In fact, one could successfully predict the diffuse X-ray properties of all three normal galaxies in this sample based on extrapolating the X-ray properties of the starburst galaxies to the lower star formation intensities seen in the normal galaxies. The close similarity in the halo-region diffuse X-ray emission in the starburst (with superwinds) and the Milky-Way-like normal spiral NGC 891 (most probably having a star-formation-fed galactic fountain) is intriguing, and deserves more study. Is it simply due to similar, micro-physical, emission mechanisms, or does the similarity extend to the macroscopic hydrodynamics at work over multi-kpc scales? The current sample of edge-on normal spiral galaxies observed by Chandra or XMM-Newton is small, so it is still possible that it is purely a coincidence that the three normal spirals we have studied lie on trends extrapolated from the starbursts. With the larger sample of observations available with next few years we should finally be able to typify the properties of diffuse thermal X-ray emission in normal spirals in the way we have with starburst galaxies.
We also consider what the observed extra-planar diffuse X-ray emission can tell us about the both the efficiency of massive star mechanical feedback on galactic scales, and the accuracy of standard theoretical models of superbubble blow out from disk galaxies.
We find the ratio of the halo-region diffuse X-ray flux to the host galaxy’s total FIR flux is typically , to within a factor two, for both the starburst galaxies and NGC 891. This ratio is independent of the star formation rate per unit area or the mass of the host galaxy.
It has long been clear that starburst-driven superwinds are powered by the collective mechanical energy input from massive stars within the entire starburst region. In contrast superbubble blow out from the disk ISM of normal star forming galaxies is usually considered in the context of bubbles being powered by a single star cluster, in which only very rare, very massive, star clusters are powerful enough to drive a bubble that can blow out of a disk (Ferrara & Tolstoy, 2000; Ferrara et al., 2000). We argue that there are a variety of good reasons to consider some level of cooperative or collective action between multiple clusters in normal star forming galaxies, i.e. when considering blow out of gas from the disk a significant fraction of all SN energy with a disk area can be used to blow a superbubble. We show that a minor generalization of the Mac Low & McCray (1988) superbubble model to allow for such collective action directly predicts a critical star formation rate per unit area for superbubble blow out from the disk, a formulation particularly useful for comparison to observations of edge-on star forming galaxies.
The standard theory of superbubble blow out developed by Mac Low & McCray is widely used in astronomy, largely in relation to mass and metal loss from galaxies, but has had little in the way of observational testing. The presence of hot gas in the halo of a star forming galaxy is direct evidence for blow out of superbubbles from the disk of the host galaxy (in cases where the emission can be shown to be related to SF activity in the underlying disk). Further observational study of edge-on normal spiral galaxies in the ways presented in this paper, and in Paper I, will allow empirical constraints to be made on the critical star formation rate per unit disk area necessary to blow hot gas out of the disk into the halo. In principle these empirical measurements could be used to test superbubble blow out theory. We discuss and emphasize several observational and theoretical issues that must be overcome before superbubble blow out theory can be practically tested.
Finally, we apply this collective-action blow out theory to superwinds blowing out from the extended gaseous halos of their host galaxies, as our and other workers observational results strongly suggest the gaseous halos of star forming galaxies are well represented as exponential atmospheres. It is important to note that blow out from the halo into the IGM is energetically more difficult that blow out from the disk into the halo. The existing uncertainties in the accuracy of blow out theory prevent robust quantitative assessment of whether the metal enriched gas powering superwinds escapes into the IGM. Nevertheless, we argue that is is still probable that the hot, metal-enriched gas in superwinds does escape into the IGM, even for galaxies as massive as – in normal environments (i.e. not in dense galaxies groups or clusters). Irrespective of the quantitative uncertainties associated with disk and halo blow out, we wish to emphasize that the distribution of gas in the halos of star forming galaxies observed in the optical and in the soft X-ray band implies that the crucial spatial region around a galaxy that controls whether gas will escape into the IGM is not the outer halo kpc from the host galaxy. Instead it is the inner few halo scale heights, within kpc of the galaxy plane, a region well probed by existing observational methods.
Within the next few years it will be possible to calibrate theories of disk and halo blow out and mechanical energy feedback against observations of local star-forming galaxies, and thus make meaningful inferences about the enrichment of the IGM by outflows, and the influence of massive star feedback on cosmological scales.
References
- Aguirre et al. (2001) Aguirre, A., Hernquist, L., Schaye, J., Weinberg, D.H., Katz, N. & Gardner, J., 2001, ApJ, 560, 590
- Armus et al. (1995) Armus, L., Heckman, T.M., Weaver, K.A. & Lehnert, M.D., 1995, ApJ, 445, 666
- de Avillez (2000) de Avillez, M.A., 2000, MNRAS, 315, 479
- Murakami & Babul (1999) Murakami, I. & Babul, A., MNRAS, 309, 161
- Bell & de Jong (2001) Bell, E.F. & de Jong, R.S., 2001, ApJ, 550, 212
- Benson et al. (2000) Benson, A.J., Bower, R.G., Frenk, C.S. & White, S.D.M., 2000, MNRAS, 314, 557
- Bessel et al. (1998) Bessel, M.S., Castelli, F. & Plez, B., 1998, A&A, 333, 231
- Bottema & Gerritsen (1997) Bottema, R. & Gerritsen, J.P.E., 1997, MNRAS, 290, 585
- Brandl et al. (1996) Brandl, B., Sams, B.J., Bertoldi, F., Eckart, A., Genzel, R., Drapatz, S., Hofmann, R., Löwe, M. & Quirrenbach, A., 1996, ApJ, 466, 254
- Bregman (1980) Bregman, J.N., 1980, ApJ, 236, 577
- Bregman & Glassgold (1982) Bregman, J.N. & Glassgold, A.E., 1982, ApJ, 263, 564
- Bregman & Houck (1997) Bregman, J.N. & Houck, J.C., 1997, ApJ, 485, 159
- Bregman & Pildis (1994) Bregman, J.N. & Pildis, R.A., 1994, ApJ, 420, 570
- Burstein & Heiles (1982) Burstein, D. & Heiles, C., 1982, AJ, 87, 1165
- Cantó et al. (2000) Cantó, J., Raga, A.C. & Rodríguez, L.F., 2000, ApJ, 536, 896
- Carpenter (2001) Carpenter, J.M., 2001, AJ, 121, 2851
- Castor, McCray & Weaver (1975) Castor, J., McCray, R., Weaver, R., 1975, ApJ, 200, L107
- Chandar et al. (2003) Chandra, R., Leitherer, C., Tremonti, C. & Calzetti, D., 2003, 586, 939
- Chevalier & Clegg (1985) Chevalier, R. & Clegg, A., 1985, Nature, 317, 44
- Chiang et al. (1988) Chiang, W.-H., Ryu, D. & Vishniac, E.T., 1988, PASP, 100, 1386
- Chu & Mac Low (1990) Chu, Y.-H. & Mac Low, M.-M., 1990, ApJ, 365, 510
- Collins et al. (2000) Collins, J.A., Rand, R.J., Duric, N. & Walterbos, R.A.M., 2000, ApJ, 536, 645
- Condon (1992) Condon, J.J., 1994, ARA&A, 30, 575
- Condon et al. (1998) Condon, J.J., Cotton, W.D., Greisen, E.W., Yin, Q.F., Perley, R.A., Taylor, G.B., Broderick, J.J., 1998, AJ, 115, 1693
- Cox (1981) Cox, D.P., ApJ, 245, 534
- Cui et al. (1996) Cui, W., Sanders, W.T., McCammon, D., Snowden, S.L. & Womble, D.S., 1996, ApJ, 468, 102
- Dahlem et al. (1993) Dahlem, M., Golla, G., Whiteoak, J. B., Wielebinski, R., Huettemeister, S. & Henkel, C., 1993, A&A, 270, 29
- Dahlem et al. (2001) Dahlem, M., Lazendic, J.S., Haynes, R.F., Ehle, M. & Lisenfeld, U., 2001, A&A, 374, 42
- Dahlem et al. (1995) Dahlem, M., Lisenfeld, U. & Golla, G., 1995, ApJ, 444, 119
- Dahlem et al. (1998) Dahlem, M., Weaver, K.A. & Heckman, T.M. 1998, ApJS, 118, 401
- Dale et al. (2000) Dale, D.A., et al. , 2000, AJ, 120, 583
- de Grijs et al. (2001) de Grijs, R., O’Connell, R.W. & Gallagher, J.S., 2001, AJ, 121, 768
- Dekel & Silk (1986) Dekel A., Silk J., 1986, ApJ, 303, 39
- Dettmar (1992) Dettmar, R.-J., 1992, Fundamentals of Cosmic Physics, 15, 143
- Dettmar (1998) Dettmar, R.-J., 1998, in The Local Bubble and Beyond, D., Breitschwerdt, M.J., Freyberg, & J. Truemper, (Springer-Verlag: Berlin Heidelberg New York), 527
- de Vaucouleurs et al. (1991) de Vaucouleurs G., de Vaucouleurs A., Corwin Jr. H.G., Buta R.J., Paturel G. & Fouque P., 1991, Third Reference Catalogue of Bright Galaxies (RC3) (Springer-Verlag: New York)
- De Young & Heckman (1994) De Young, D.S. & Heckman T.M., 1994, ApJ, 431, 598
- Dickey & Lockman (1990) Dickey, J.M. & Lockman, F.J., 1990, ARA&A. 28, 215.
- Douglas et al. (1996) Douglas, J.N., Bash, F.N., Arakel Bozyan, F., Torrence, G.W., Wolfe, C., 1996, AJ, 111, 1945
- Ehle et al. (1998) Ehle, M., Pietsch, W., Beck, R. & Klein, U., 1998, A&A, 329, 39
- Elfhag et al. (1996) Elfhag, T., Booth, R.S., Hoglund, B., Johansson, L.E.B. & Sandqvist, Aa., 1996, A&AS, 115, 439
- Elmouttie et al. (1997) Elmouttie, M., Haynes, R.F., Jones, K.L., Ehle, M., Beck, R., Harnett, J.I. & Wielebinski, R., 1997, MNRAS, 284, 830
- Engelbracht et al. (1998) Engelbracht, C.W., Rieke, M. J., Rieke, G.H., Kelly, D.M., Achtermann, J.M., 1998, ApJ, 505, 639
- Fabbiano (1989) Fabbiano, G. 1989, ARA&A, 27, 87
- Fabbiano et al. (1990) Fabbiano, G., Heckman, T.M., Keel, W.C., 1990, ApJ, 355, 442
- Fabbiano & Juda (1997) Fabbiano, G. & Juda, J.Z., 1997, ApJ, 476, 666
- Fabbiano & Shapley (2002) Fabbiano, G. & Shapley, A., 2002, ApJ, 565, 908
- Ferrara et al. (2000) Ferrara, A., Pettini, M. & Shchekinov, Y., 2000, MNRAS, 319, 539
- Ferrara & Tolstoy (2000) Ferrara, A. & Tolstoy, E., 2000, MNRAS, 313, 291
- Ferrière (2001) Ferrière, K.M., 2001, Rev. Mod. Phys., 73, 1031
- Figer et al. (2002) Figer, D.F., et al. , 2002, ApJ, 581, 258
- Förster Schreiber et al. (2001) Fr̈ster Schreiber, N.M., Genzel, R., Lutz, D., Kunze, D. & Sternberg, A., 2001, ApJ, 552, 544
- Freedman et al. (1994) Freedman, W.L., et al. , 1994, ApJ, 427, 628
- Garnett (2002) Garnett, D.R., 2002, ApJ, 581, 1019
- Golla (1999) Golla, G., 1999, A&A, 345, 778
- Golla & Wielebinski (1994) Golla, G. & Wielebinski, R., 1994, A&A, 286, 733
- Hameed & Devereux (1999) Hameed, S. & Devereux, N., 1999, AJ, 118, 730
- Heckman (1999) Heckman, T.M., 1999, Ap&SS, 266, 3
- Heckman et al. (1990) Heckman, T. M., Armus, L., & Miley, G. K. 1990, ApJS, 74, 833
- Heckman et al. (2000) Heckman, T.M., Lehnert, M.D., Strickland, D.K. & Armus, L., 2000, ApJS, 129, 493
- Heckman et al. (2001) Heckman, T.M., Sembach, K.R., Meurer, G.R., Strickland, D.K., Martin, C.L., Calzetti, D. & Leitherer, C., 2001, ApJ, 554, 1021
- Hillenbrand & Hartmann (1998) Hillenbrand, L.A. & Hartmann, L.W., 1998, ApJ, 492, 540
- Hollenbach & Tielens (1997) Hollenbach, D.J. & Tielens, A.G.G.M., 1997, ARA&A, 35, 179
- Hoopes et al. (2003) Hoopes, C.G., Heckman, T.M., Strickland, D.K. & Howk, J.C., 2003, ApJ, 596, L175
- Hoopes et al. (1999) Hoopes, C.G., Walterbos, R.A.M. & Rand, R.J., 1999, ApJ, 552, 669
- Howk & Savage (1999) Howk, J.C. & Savage, B.D., 1999, AJ, 117, 2077
- Ichikawa et al. (1995) Ichikawa, T., Yanagisawa, K., Itoh, N., Tarusawa, K., van Driel, W. & Ueno, M., 1995, AJ, 109, 2038
- Irwin & Seaquist (1991) Irwin, J.S. & Seaquist, E.R., 1991, ApJ, 371, 111
- Irwin & Sofue (1996) Irwin, J.S. & Sofue, Y., 1996, ApJ, 464, 738
- Jarret et al. (2003) Jaaret, T.H., Chester, T., Cutri, R., Schneider, S. & Huchra, J.P., 2003, AJ, 125, 525
- Karachentsev & Sharina (1997) Karachentsev I.D. & Sharina M.E., 1997, A&A, 324, 457
- Katz et al. (2003) Katz, N., Keres, D., Davé. R. & Weinberg, D.A., 2003, in “The IGM/Galaxy Connection: The Distribution of Baryons at z=0”, Eds. J.L. Rosenberg & M.E. Putman (Kluwer: Dordrecht), 185
- Kennicutt (1998a) Kennicutt, R.C., 1998a, ApJ, 498, 541
- Kennicutt (1998b) Kennicutt, R.C., 1998b, ARA&A, 36, 189
- Koo & McKee (1992) Koo, B.-C. & McKee, C.F., 1992, ApJ, 388, 93
- Koorneef (1993) Koorneef, J., 1993, ApJ, 403, 581
- Kroupa et al. (1993) Kroupa, P., Tout, C.A., & Gilmore, G., 1993, MNRAS, 262, 545
- van der Kruit (1984) Kruit, P.C. van der, 1984, A&A, 140, 470
- van der Kruit & de Grijs (1999) Kruit, P.C. van der, & de Grijs., R., 1999, A&A, 352, 129
- Kuntz & Snowden (2000) Kuntz, K.D. & Snowden, S.L., 2000, ApJ, 543, 195
- Larson (1974) Larson, R.B., 1974, MNRAS, 169, 229
- Lehnert & Heckman (1995) Lehnert, M. & Heckman, T.M., 1995, ApJS, 97, 89
- Lehnert & Heckman (1996) Lehnert, M. & Heckman, T.M., 1996, ApJ, 472, 546
- Leitherer & Heckman (1995) Leitherer, C. & Heckman, T.M., 1995, ApJS, 96, 9
- Lira et al. (2002) Lira, P., Johnson, R. & Lawrence, A., 2002, submitted to MNRAS(astro-ph/0206123)
- Lynds & Sandage (1963) Lynds, C.R. & Sandage, A.R., 1963, ApJ, 137, 1005
- McCarthy et al. (1987) McCarthy, P.J., Heckman, T.M. & van Breugel, W. 1987, AJ, 92, 264
- McKee (1995) McKee, C.F., 1995, in ASP Conf Series 80, The Physics of the Interstellar Medium, A. Ferrara, C.F. McKee, C. Heiles & P.R. Shapiro (San Francisco: ASP), 292
- McKee & Ostriker (1977) McKee, C.F. & Ostriker, J.P., 1977, ApJ, 218, 148
- McKeith et al. (1995) McKeith, C.D., Greve, A., Downes, D. & Prada, F., 1995, A&A, 293, 703
- McLeod et al. (1993) McLeod, K.K., Rieke, G.H., Rieke, M.J. & Kelly, D.M., 1993, ApJ, 412, 111
- Mac Low (1996) Mac Low, M.-M., 1996, in “The Interplay between Massive Star Formation, the ISM, and Galaxy Evolution,” eds. D. Kunth et al. , (Paris: Editions Frontières), 169
- Mac Low & Ferrara (1999) Mac Low, M.-M. & Ferrara, A., 1999, ApJ, 513, 142
- Mac Low & McCray (1988) Mac Low, M.-M. & McCray, R., 1988, ApJ, 324, 776
- Mac Low et al. (1989) Mac Low, M.-M., McCray, R., & Norman, M.L., 1989, ApJ, 337, 141
- Malamuth & Heap (1994) Malumuth, E.M. & Heap, S.R., 1994, AJ, 107, 1054
- Martin (1999) Martin, C.L., 1999, ApJ, 513, 156
- Martin (1996) Martin, C.L., 1996, ApJ, 465, 680
- Meurer et al. (1995) Meurer, G.R., Heckman, T.M., Leitherer, C., Kinney, A., Robert, C & Garnett, D.R., 1995, AJ, 110, 2665
- Mewe et al. (1995) Mewe R., Kaastra J. S., Liedahl D. A., 1995, Legacy, 6, 16
- Miller & Veilleux (2003) Miller, S.T. & Veilleux, S., 2003, ApJS, 148, 383
- Mori et al. (2002) Mori, M., Ferrara, A. & Madau, P., 2002, ApJ, 571, 40
- Nordgren et al. (1992) Nordgren, T.E., Cordes, J.M. & Terzian, Y., 1992, AJ, 104, 1465
- Norman & Ferrara (1996) Norman, C.A. & Ferrara, A., 1996, ApJ, 467, 280
- Norman & Ikeuchi (1989) Norman, C. A. & Ikeuchi, S., 1989, ApJ, 345, 372
- O’Connell et al. (1995) O’Connell, R.W., Gallagher, J.S., Hunter, D.A. & Colley, W.N., 1995, ApJ, 446, L1
- Oey et al. (2003) Oey, M.S., King, N.L. & Parker, J.Wm., 2003, AJ, in press (astro-ph/0312051)
- Olling (1996) Olling, R.P., 1996, AJ, 112, 457
- Ott et al. (2001) Ott, M., Whiteoak, J.B., Henkel, K. & Wielebinski, R., 2001, A&A, 372, 463
- Pence (1981) Pence, W.D., 1981, ApJ, 247, 473
- Press et al. (1992) Press, W.H., Teukolsky, S.A., Vetterling, W.T. & Flannery, B.P., 1992, in Numerical Recipes in FORTRAN: The Art of Scientific Computing – Second Edition (New York: Cambridge University Press), 637
- Puche & Carignan (1988) Puche, D., Carignan, C., 1988, AJ, 95, 1025
- Puche, Carignan & van Gorkom (1991) Puche, D., Carignan, C., van Gorkom, J.H., 1991, AJ, 101, 456
- Pudritz & Fiege (2000) Pudritz, R.E. & Fiege, J.D., 2000, in ASP Conf. Series 168, New Perspectives on the Interstellar Medium, A.R. Taylor, T.L. Landecker & G. Joncas, (San Francisco: ASP), 235
- Rand (1994) Rand, R., 1994, A&A, 285, 833
- Rand (1996) Rand, R.J., 1996, ApJ, 462, 712
- Read & Ponman (2001) Read, A.M. & Ponman, T.J., 2001, MNRAS, 328, 127
- Read et al. (1997) Read, A.M., Ponman, T.J., Strickland, D.K., 1997, MNRAS, 286, 626
- Recchi et al. (2002) Recchi, S. Matteucci, F. & D’Ercole, A., 2002, in “Chemical Enrichment of the ICM and IGM,” Eds. R. Fusco-Femiano & F. Matteucci, (ASP: San Francisco), 387
- Reynolds (1989) Reynolds, R.J., 1989, ApJ, 339, L29
- Rice et al. (1988) Rice, W., Lonsdale, C.J., Soifer, B.T., Neugebauer, G., Kopan, E.L., Llyod, L.A., deJong, T. & Habing, H.J., 1988, ApJS, 68, 91
- Rieke et al. (1993) Rieke, G.H., Loken, K., Rieke, M.J. & Tamblyn, P., 1993, ApJ, 412, 99
- Rossa & Dettmar (2003) Rossa, J. & Dettmar, R.-J., 2003, A&A, 406, 493
- Rossa & Dettmar (2000) Rossa, J. & Dettmar, R.-J., 2000, A&A, 359, 433
- Roth et al. (1991) Roth, J., Mould, J.R. & Davies, R.D., 1991, AJ, 102, 1303
- Rupen (1991) Rupen, M.P., 1991, AJ, 102, 48
- Sanders & Mirabel (1996) Sanders, D.B. & Mirabel, I.F., 1996, ARA&A, 34, 749
- Satyapal et al. (1997) Satyapal, S., Watson, D.M., Pipher, J.L., Forrest, W.J., Greenhouse, M.A., Smith, H.A., Fischer, J. & Woodward, C.E., 1997, ApJ, 483, 148
- Sembach & Danks (1994) Sembach, K.R. & Danks, A.C., 1994, A&A, 289, 539
- Shapiro & Field (1976) Shapiro, P.R. & Field, G.B., 1976, ApJ, 205, 762
- Shapiro et al. (1994) Shapiro, P.R., Giroux, M.L. & Babul, A., 1994, ApJ, 427, 25
- Shapley et al. (2001) Shapley, A., Fabbiano, G. & Eskridge, P., 2001, ApJS, 137, 139
- Shopbell & Bland-Hawthorn (1998) Shopbell, P.L., Bland-Hawthorn, J., 1998, ApJ, 493, 129
- Shull & Slavin (1994) Shull, J.M. & Slavin, J.D., 1994, ApJ, 427, 784
- Silich & Tenorio-Tagle (1998) Silich, S.A. & Tenorio-Tagle, G., 1998, MNRAS, 299, 249
- Silich & Tenorio-Tagle (2001) Silich, S.A. & Tenorio-Tagle, G., 2001, ApJ, 552, 91
- Snowden & Pietsch (1995) Snowden, S.L. & Pietsch, W., 1995, ApJ, 452, 627
- Sofue (1997) Sofue, Y., 1997, PASJ, 49, 17
- Soifer et al. (1989) Soifer, B.T., et al. , 1989, AJ, 98, 1766
- Soifer et al. (1987) Soifer, B.T., Sanders, D.B., Madore, B.F., Neugebauer, G., Danielson, G.E., Elias, J.H., Lonsdale, C.J. & Rice, W.L., 1987, ApJ, 320, 238
- Sommer-Larsen et al. (2003) Sommer-Larsen, J., Toft, S., Rasmussen, J., Pedersen, K., Gotz, M. & Portinari, L., 2003, Ap&SS, 284, 693
- Sorai et al. (2000) Sorai, K., Nakai, N., Kuno, N., Nishiyama, K. & Hasegawa, T., 2000, PASJ, 52, 785
- Strickland (2002) Strickland, D.K., 2002, in “Chemical Enrichment of the ICM and IGM,” Eds. R. Fusco-Femiano & F. Matteucci, (ASP: San Francisco), 387
- Strickland et al. (2003) Strickland, D.K., Heckman, T.M., Colbert, E.J.M., Hoopes, C.G. & Weaver, K.A., 2003, in “A Massive Star Odyssey, from Main Sequence to Supernova,” Eds. K.A. van der Hucht, A. Herrero & C. Esteban (ASP: San Francisco), 612
- Strickland et al. (2004) Strickland, D.K., Heckman, T.M., Colbert, E.J.M., Hoopes, C.G. & Weaver, K.A., 2003, ApJS, in press (Paper I)
- Strickland et al. (2002) Strickland, D.K., Heckman, T.M., Weaver, K.A., Hoopes, C.G. & Dahlem, M., 2002, ApJ, 568, 689
- Strickland et al. (2000) Strickland, D.K., Heckman, T.M., Weaver, K.A. & Dahlem, M., 2000, AJ, 120, 2965
- Strickland & Stevens (1998) Strickland, D.K. & Stevens, I.R., 1998, MNRAS, 297, 747
- Strickland & Stevens (1999) Strickland, D.K. & Stevens, I.R., 1999, MNRAS, 306, 43
- Strickland & Stevens (2000) Strickland, D.K. & Stevens, I.R., 2000, MNRAS, 314, 511
- Suchkov et al. (1994) Suchkov, A.A., Balsara, D,S., Heckman, T.M., Leitherer, C., 1994, ApJ, 430, 511
- Tenorio-Tagle (1996) Tenorio-Tagle, G., 1996, AJ, 111, 1641
- Thornton et al. (1998) Thornton, K., Gaudlitz, M., Janka, H.-Th. & Steinmetz, M., 1998, ApJ, 500, 95
- Toft et al. (2002) Toft, S., Rasmussen, J., Sommer-Larsen, J. & Pedersen, K., 2002, MNRAS, 335, 799
- Tomisaka & Bregman (1993) Tomisaka, K., & Bregman, J.N., 1993, PASJ, 45, 513
- Tremonti et al. (2001) Tremonti, C., Calzetti, D., Leitherer, C. & Heckman, T.M., 2001, ApJ, 555, 322
- Tremonti et al. (in preparation) Tremonti, C.A., et al. , in preparation
- Tully & Fouqué (1985) Tully, R.B. & Fouqué, P., 1985, ApJS, 58, 67
- Vogler et al. (1995) Vogler, A., Pietsch, W. & Kahabka, P., 1995, A&A, 305, 71
- Voit (1996) Voit, G.M., 1996, ApJ, 465, 548
- Wainscoat et al. (1987) Wainscoat, R.J., de Jong, T. & Wesselius, P.R., 1987, A&A, 181, 225
- Wang et al. (2001) Wang, Q.D., Immler, S., Walterbos, R., Lauroesch, J.T. & Breitschwerdt, D., 2001, ApJ, 555, L99
- Wang et al. (1995) Wang, Q.D., Walterbos, R.A.M., Steakley, M.F., Norman, C.A. & Braun, R., 1995, ApJ, 439, 176
- Weaver et al. (1977) Weaver R., McCray R., Castor J., Shapiro P., Moore R., 1977, ApJ, 218, 377
- Weliachew, Fomalont & Greisen (1984) Weliachew, I., Fomalont, E.B. & Greisen, E.W., 1984, A&A, 137, 335
- Wiseman & Ho (1998) Wiseman, J.J. & Ho, P.T.P., 1998, ApJ, 502, 676
- Wolfire et al. (2003) Wolfire, M.G., McKee, C.F., Hollenbach, D. & Tielens, A.G.G.M., 2003, ApJ, 587, 278