On the origin of the X-rays and the nature of accretion in NGC~4261
We report on the X-ray properties of the radio galaxy NGC~4261, combining information from the XMM-Newton, Chandra, and BeppoSAX satellites. Goals of this study are to investigate the origin of the X-rays from this low-power radio galaxy and the nature of the accretion process onto the central black hole. The X-ray spectrum of the nuclear source extending up to 100–150 keV is well described by a partially covered (covering factor 0.8) power law with a photon index absorbed by a column density . The X-ray luminosity associated with the non-thermal component is . The nuclear source is embedded in a diffuse hot gas ( keV), whose density profile implies a Bondi accretion rate of . For the first time rapid X-ray variability is detected in a low-power radio galaxy at more than 99% confidence level. The observed X-ray spectral and variability properties indicate the accretion flow as the most likely origin of the bulk X-ray continuum. This conclusion is strengthened by energetic considerations based on a comparison between the X-ray luminosity and the kinetic power of the jet, which also suggest that the Bondi accretion rate overestimates the actual accretion rate onto the black hole.
Key Words.:
Galaxies: active – Galaxies: nuclei – X-rays: galaxies1 Introduction
One of the most interesting issues of extragalactic astrophysics is the condition of matter near black holes. The importance of this issue is stressed by the recent discovery from HST and ground-based observations that most nearby galaxies harbor supermassive black holes (e.g., Gebhardt et al. 2000, Ferrarese et al. 2001). Together with independent evidence that weak nuclear activity is common in both spirals and ellipticals (Low-Ionization Nuclear Emission-Line Regions, hereafter LINERs; e.g., Heckman 1980), this underlines a fundamental link between “normal” and active galaxies. Since accreting supermassive black holes are widely believed to be responsible for the nuclear activity in active galactic nuclei (AGN), one naturally wonders why intense activity is limited to a minority of galaxies. Inefficient accretion onto the central black hole is generally considered as the most likely explanation. This could be due either to radiatively inefficient advection (or convection) dominated accretion flows (e.g., Narayan 2002), or to unsteady feedback-modulated accretion (e.g., Binney & Tabor 1995, Ciotti & Ostriker 2001), which can stop or decrease to a low duty cycle the accretion onto the massive black hole.
Weak AGN may represent the link between powerful AGNs and “normal” galaxies. Therefore, an important role in understanding the nature of accretion around massive black holes can be played by the the study of weak AGNs at X-ray energies, where the combination of spatial, spectral, and temporal analyses offer an ideal means by which we can understand the physics of their central engines and in particular the accretion process onto their black holes.
The nearby (=0.0074) giant elliptical NGC~4261 (3C270) contains a supermassive black hole with (Ferrarese, Ford, & Jaffe 1996). It is one of a handful of nearby early-type galaxies where low-luminosity nuclear activity is detected. It is classified as a Fanaroff-Riley I (FR I) radio galaxy, with a compact core and twin jets extending E-W, oriented at ∘ with respect to the line of sight (Piner, Jones, & Wehrle 2001). Optical spectroscopy reveals a LINER in the nucleus of the galaxy (Ho, Filippenko, & Sargent 1995). HST/STIS ultraviolet images of NGC~4261 show the presence of a jet-like structure on pc scales with position angle consistent with the orientation of the radio and X-ray jets (Chiaberge et al. 2003). In the X-ray band, diffuse thermal emission plus a non-thermal nuclear component is present at low energies in ROSAT images (Worrall & Birkinshaw 1994). More recently, Chandra spectral results have been reported by Chiaberge et al. (2003), showing a continuum described by a flat power law with photon index and an excess column density of N cm-2. Marginal evidence for an unresolved Fe line was previously claimed from a 40 ks ASCA exposure (Sambruna, Eracleous, & Mushotzky 1999). These spectral properties and the presence of an unresolved Fe K line at 6.9 keV have been confirmed by Sambruna et al. (2003; hereafter Paper I) using XMM-Newton data, which also show evidence for significant variability on short time scales.
| Satellite | Instrument | Observation Date | Exposure | Count Rate | Extraction Radius |
|---|---|---|---|---|---|
| [yy/mm/dd] | [ks] | ||||
| Chandra | ACIS-S3 | 00/05/06 | 32.0a | 2′′ | |
| BeppoSAX | MECS23 | 00/12/27 | 67.4 | 2′ | |
| XMM-Newton | EPIC pn | 01/12/16 | 21.3a | 20′′ |
a Effective exposure after excluding times of background flares.
In this paper, we present a detailed study of the X-ray nuclear and circumnuclear properties of NGC~4261, combining the complementary capabilities of XMM-Newton, Chandra, and BeppoSAX. The main questions addressed in this study are 1) What is the origin of the X-ray emission from this galaxy? In particular, concerning the nuclear emission, are the bulk of the X-rays due to the inner jet or is the accretion process responsible for them? 2) What is the nature of the accretion process at work in the nucleus of NGC~4261?
In we describe the observations and data reduction. In we perform a spatial analysis of the circumnuclear region utilizing Chandra data. In and we carry out temporal and spectral analyses, respectively. In we discuss the nuclear properties inferred from the X-ray data and compare them with the jet properties on pc scales derived from radio observations. Finally, in , we summarize the main conclusions. Throughout the paper we use a Friedman cosmology with . With these cosmological parameters, 1′′=141 pc at the distance of NGC~4261.
2 Observations and data reduction
Table 1 summarizes the X-ray observations of NGC~4261 carried out with Chandra, BeppoSAX, and XMM-Newton. The background-subtracted count rates are given in column 5. Details are given below for each satellite.
2.1 XMM-Newton
We observed NGC~4261 with XMM-Newton on 2001 October 16
for a duration of ks with the EPIC pn, and
for ks with EPIC MOS1 and MOS2. All of the EPIC cameras were
operated in full-frame mode with a medium filter. The recorded events
were reprocessed and screened with the latest available release of the
XMM-Newton Science Analysis Software (SAS 5.3.3) to remove known hot
pixels and other data flagged as bad; only data with FLAG=0 were
used. Investigation of the full–field light curves revealed the
presence of two periods of background flaring; these events were
screened reducing the effective total exposures to ks for the
EPIC pn and ks for the MOS cameras.
Background data were extracted from source-free circular regions
on the same chips containing the source. There
are no signs of pile-up in the pn or MOS cameras
according to the SAS task epatplot. With an
extraction radius of 20′′ the detected count rates in the energy
range 0.3–10 keV are for the
MOS1, for the MOS2, and
for the pn.
The spectra were rebinned such that each spectral bin contains at least 20 counts in order to apply minimization, and fitted using the XSPEC v.11 software package (Arnaud 1996). The quoted errors on the derived best-fitting model parameters correspond to a 90% confidence level for one interesting parameter (i.e., a criterion) unless otherwise stated. The latest publicly available responses were used. The same procedure was applied to the Chandra and BeppoSAX data.
2.2 Chandra
NGC~4261 was observed with Chandra on 2000 May 6.
The observations
were carried out in a subarray mode (frametime 1.8 s) to
minimize the possible pile-up of the nucleus. The data reduction was
performed with CIAO v. 2.3 and CALDB v. 2.18. The data
were reprocessed with acis_process_events and screened to
exclude periods of flaring background, reducing the effective exposure
to ks.
In order to take
into account the continuous degradation of the ACIS quantum efficiency
(QE) due to molecular contamination of the optical blocking filters,
we applied ACISABS 111see the Chartas & Getman model description at
www.astro.psu.edu/users/chartas/xcontdir/xcont.html to
the ancillary response function (ARF) file.
The
S3 background-subtracted count rate in the 0.35–9 keV energy band is
.
2.3 BeppoSAX
BeppoSAX observed NGC~4261 with the Narrow Field Instruments, LECS (0.1–4.5 keV) and MECS (1.3–10 keV), and with the PDS (15–220 keV) on 2000 December 27, with effective exposures of 19.6 ks, 67.4 ks, and 32.6 ks, respectively. The LECS and MECS are imaging instruments, while the PDS is a phoswich detector system. The observations were performed with 2 active MECS units. Standard data reduction techniques were employed, following the prescription given by Fiore et al. (1999). LECS and MECS spectra and light curves were extracted from regions with radii of 4′ and 2′, respectively, in order to maximize the accumulated counts at both low and high energies. An inspection of the MECS f.o.v. argues against the presence of confusing bright sources in the PDS data. Background spectra were extracted from high Galactic latitude “blank” fields, whereas for the light curves a source-free region in the field of view was used. The background-subtracted count rates are for the LECS in the 0.1–4.5 keV band, for the MECS in the 2–10 keV band, and for the PDS in the 15–150 keV energy band.
3 Spatial Analysis
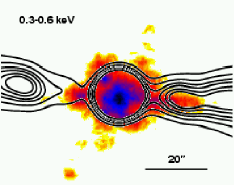
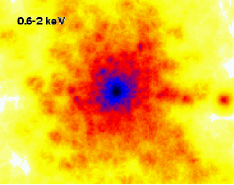
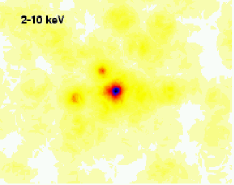
With its subarcsecond spatial resolution, Chandra provides us with the opportunity to take a direct look at the faint nuclear emission and to disentangle the different X-ray components in NGC 4261. Figure 1 shows four adaptively smoothed images of NGC~4261 in different energy bands as seen by ACIS-S3. In the ultrasoft range (0.3–0.6 keV, top left panel), the X-ray emission is preferentially distributed along the jet direction indicated by the VLA radio contours superimposed. It is worth noticing that Chandra detects an X-ray jet on kpc scales, i.e., on scales larger than the jet-like feature observed in the UV ( pc; Chiaberge et al. 2003), and much larger than the VLBA radio jet ( pc; Piner et al. 2001).
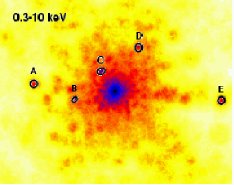
In the 0.6–2 keV range (top right panel), the radiation is uniformly distributed on kpc scales (20′′ corresponds to a distance of 2.8 kpc). The hard X-rays (2–10 keV, bottom left panel) are consistent with a point-like source. Finally, several point-like sources (bottom right panel) are found with wavdetect in the circumnuclear region of NGC~4261. Details about source detection and the serendipitous sources’ properties are reported in the Appendix. Three of these sources are located within 20′′ of the nucleus of NGC~4261 and therefore fall in the XMM-Newton extraction region. However, their contribution to the X-ray flux is negligible: the brightest source (source C) contributes only of the total counts, while the remaining sources contribute less than .
A more quantitative method to derive information from the photon spatial distribution is to extract a radial profile. Using the ciao tools dmextract and dmtcalc, we extracted the azimuthally-averaged radial profile of the circumnuclear region out to 100′′ (corresponding to 14 kpc). A series of annular regions, with an increment of the radius of 2′′, was used to extract the non-background-subtracted radial profile in the 0.3–2 keV range.
To determine the physical properties of the extended X-ray emission, we fitted the surface–brightness profile with a -model (e.g., Cavaliere & Fusco-Femiano 1976) of the form
| (1) |
The energy-dependent PSF (see Donato et al. 2003 for details on its derivation) and the background were explicitly included in the fit. The result is shown in Figure 2.

The best-fit values (, 46 d.o.f.) for the -model are , , and ′′. The quoted errors are 1. The value of is consistent with typical values for gas confined in nearby elliptical galaxies (e.g., Forman et al. 1985). On the other hand, the core radius is considerably smaller than the value inferred from ROSAT PSPC data by Worrall & Birkinshaw (1994) with fixed at 2/3. This is likely due to the different spatial resolutions of the two instruments: the Chandra ACIS-S with its subarcsecond resolution can resolve emission on very small scales, whereas the ROSAT PSPC with a PSF FWHM of 25′′ can only detect extended emission on group scales.
The physical parameters of the extended emission can be obtained by de-projecting the surface-brightness profile. With this method we can derive the corresponding density profile (see, e.g., Ettori 2000):
| (2) |
This relation assumes isothermal, hydrostatic equilibrium in spherical symmetry. We adopted the cooling function value (e.g., Sarazin 1988) for the hot gas temperature and the abundances derived from the spectral analysis. The resulting central particle density is .
4 Temporal Analysis
| Energy band | Radius | (22 d.o.f.) | a (%) | |
|---|---|---|---|---|
| 10′′ | 1.74 | 1.2% | ||
| 0.3–10 keV | 20′′ | 1.85 | 0.6% | |
| 30′′ | 1.60 | 2% | ||
| 0.3–0.8 keV | 20′′ | 2.03 | 0.2% | |
| 0.8–2 keV | 20′′ | 1.03 | 36% | |
| 2–10 keV | 20′′ | 1.14 | 24% |
a The errors on are calculated as in Edelson et al. (2002) and should be considered conservative estimates of the true uncertainty.
As shown in Paper I, rapid variability is present in the nucleus of NGC~4261. To investigate further the short-term variability only EPIC pn data are useful. The reason why MOS data cannot increase the photon statistics is the following: the MOS cameras share with the Reflection Grating Spectrometers (RGS1 and RGS2, respectively) the focal planes of their respective X-ray telescopes. As a consequence, they suffer from low photon statistics and their intensity variations are basically statistical fluctuations randomly distributed. Thus the net effect of adding the MOS light curves to the pn one results in an overall decrease of the level of variability.

In the following, therefore, we will use data only from the pn camera (0.3–10 keV). To examine the influence of the extraction radius on the variability we extracted pn light curves from circular regions of radii ranging between 10′′ and 30′′. According to a test, the flux variability is most pronounced when the extraction radius is 20′′. This choice represents a compromise between the necessity to increase the photon statistics and to minimize the contribution of the extended emission, which is particularly important at soft energies (see Figure 1). We then extracted energy-selected light curves in the ultra-soft (0.3–0.8 keV), soft (0.8–2 keV), and hard (2–10 keV) energy bands. In Table 2 we summarize the results of the short-term variability analysis obtained using time bins of 1000 s.
Figure 3 shows the background-subtracted light curve from the EPIC pn in the total energy range 0.3–10 keV (top panel). The bottom panel shows a plot of the hardness ratio, defined as the ratio of the 2–10 keV count rate to the 0.3–0.8 keV count rate, versus time. Low-amplitude variations are present in both cases, confirming our previous results (Paper I). Applying a test against the hypothesis of constancy, we find that variability is highly significant in both light curves: probabilities of 0.6% and 3% are found for the flux and hardness ratio, respectively.

The background count rate is as low as 5% of the average source count rate and, after removing two large flares, is consistent with the hypothesis of being constant, according to a test. To investigate the presence of possible systematic effects in the variability analysis, we extracted light curves from the only additional point-like source located on CCD4, and from two of the brightest serendipitous sources located in the EPIC f.o.v. far from CCD edges (RA=, DEC=+51′04.75′′, RA=, DEC=+42′02.73′′, and RA=, DEC=+49′04.8′′, respectively). All the sources are times fainter than the central source, and none of them is significantly variable according to testing.
The variability in different energy bands can be characterized by means of the fractional variability parameter, . The latter is a common measure of the intrinsic variability amplitude relative to the mean count rate, corrected for the effect of random errors, i.e.,
| (3) |
where is the variance, the unweighted mean count rate, and the mean square value of the uncertainties associated with each individual count rate. Using different binning times ranging between 200 s and 1000 s, we calculated in the 0.3–0.8 keV band and in the keV band. For any binning time, is larger than . For example, for 200 s and for 1000 s, respectively, while for 200 s and for 1000 s bins.
Spectral variations are also present, as shown in Figure 3. An interesting trend may be present when the hardness ratio is plotted versus the total count rate. This is illustrated in Figure 4, which shows the presence of a marginally significant anti-correlation between the hardness ratios and the total intensity. To quantify the degree of linear correlation between and the mean count rate, we calculated the linear correlation coefficient and computed the chance probability that a random sample of uncorrelated pairs of measurements would yield a linear correlation coefficient equal or larger than , finding .
5 Spectral Analysis
5.1 The X-ray continuum
In Paper I, we presented an analysis of the EPIC pn spectrum from
0.3–10 keV. It was best-fit by a model consisting of a
thermal component related to the diffuse halo, dominating from
0.6–2 keV; a heavily absorbed power law above 2 keV, of nuclear
origin; and a second unabsorbed power law dominating the ultra-soft
0.3–0.8 keV emission, with the photon index tied to that of the hard power
law.
The two power-law model mimics a partial-covering model. This
represents the physical situation of an absorber only partially
covering the nucleus, with the softer power law representing the
fraction of the flux which “leaks through” the patchy medium
(e.g., Holt et al. 1980). We therefore investigated the
combined spectra from the pn, MOS1, and MOS2 cameras (after checking the
consistency of each spectrum individually) using a thermal
model plus a partially absorbed power law.
Specifically, we fitted the XMM-Newton EPIC data from 0.3–10 keV with the
following model: a thermal component, parameterized by apec in
XSPEC, plus a partially absorbed power law, parameterized by
zpcfabs(powerlaw), plus a uniform screen of absorbing gas with its
column density fixed to the Galactic value (), acting
on all
components. The data with the best-fit model and the residuals are
shown in Figure 5 (top panel), while the best-fit
parameters with their 90% uncertainties
are listed in Table 5. Line-like residuals are present at keV;
however, adding a Gaussian line at that energy does not improve the fit
significantly. The 0.3–10 keV unabsorbed flux
associated with the thermal component is , whereas the flux associated with the power-law
component is .
| Parameter | XMM-Newton | Chandra |
|---|---|---|
| (keV) | ||
| 1 () | 1 | |
| CvrFract | ||
| (keV) | ||
| (keV) | ||
| EW (eV) | ||
| line flux () | ||
| 400.91/359 | 76.15/71 | |
| Counts | 11708 | 222 |
| 8.6 | 3.6 | |
| 8.3 | 9.5 |
We find that the same continuum model fits the Chandra ACIS-S data from 0.3–9 keV. The results of this spectral fit along with the intrinsic luminosities are also listed in Table 5, for direct comparison with XMM-Newton, and the residuals are shown in Figure 5 (middle panel).
The XMM-Newton and Chandra best-fit parameters are consistent within the 90% errors, with the exception of the temperature of the diffuse halo, which is slightly lower in the Chandra spectral fit. This is likely due to a shallow temperature gradient in the circumnuclear region very close to the central source. Indeed, dividing the inner 30′′ into six annular regions and comparing the spatially-resolved Chandra spectra, we find a shallow temperature gradient with going from 0.6 to 0.8 keV but with large uncertainties due to the limited statistics. The larger keV luminosity measured by XMM-Newton can be ascribed to the larger extraction area (20′′ vs. 2′′) used, meaning a stronger contribution from the thermal component that actually peaks in the soft X-ray range.
The Chandra data were previously analyzed by Chiaberge et al. (2003). These authors found that a single absorbed power law plus a thermal plasma best-fits the S3 data (). The different spectral results can be partially ascribed to the different processing of the data: 1) we use the latest released calibration files (CALDB v2.18); 2) we apply ACISABS to the ARF file to account for the degradation of the QE due to molecular contamination; 3) we did not convolve our spectral model with pileup in XSPEC, because, according to a test with PIMMS, the pile-up in NGC~4261 is less than 5%. In any case, from the statistical point of view our fit is significantly better than that of Chiaberge et al. (2003).


We also tried to fit the data with more complex spectral models, e.g., pexrav or the ionized-disk reflection model of Ross & Fabian (1993). However, the fit did not improve.
The spectral analysis of the BeppoSAX data is inconclusive. The spectrum fitted by a thermal component ( keV) plus an absorbed power law (, ) gives a reduced of for 49 d.o.f. Similar results are obtained using more complex spectral models. The low value of indicates that the fit is dominated by the large statistical errors due to the poor photon statistics. However, it is important to point out that the PDS detected the source up to energies higher than 100 keV at more than a 3 confidence level. The flux is in the 10–100 keV range, implying an intrinsic luminosity of .
5.2 The Fe line
Another important result of Paper I was the detection of an unresolved Fe K line at 7 keV in the EPIC pn data. Unfortunately, due to their limited sensitivity, the MOS data do not provide any constraint on the Fe K line (Fig. 5). In Figure 6, we show the contours at 68%, 90%, 95%, and 99% confidence level from the EPIC pn data for the line flux versus width. It is apparent that the line is detected at 95% confidence and is not significantly resolved. A broad line cannot be excluded.

As mentioned in Paper I, no Fe line is detected in the Chandra ACIS S3 data, with an EW upper limit of 320 eV. On the other hand, the BeppoSAX MECS data show evidence for the Fe line, as indicated by the excess in the residuals around 6–8 keV (see Fig. 5, bottom panel). Adding a Gaussian model with the width fixed at the best-fit value from the EPIC pn data to the best-fit MECS continuum gives a slight improvement in the fit ( for two additional parameters). The line parameters are consistent with those from the EPIC pn, keV, eV. Thus, we confirm the previous claim based on a 40 ks ASCA exposure that an Fe line is present in the spectrum of NGC 4261 (Terashima et al. 2002; Sambruna et al. 1999). The line energy is consistent with emission from Fe XXVI. However, as discussed in Paper I, the origin of the line and the nature of the reprocessor are still unclear. A deeper exposure with the EPIC pn is necessary to study the line profile in more detail.
6 Discussion
6.1 Summary of X-ray Results
We first summarize the main observational results that will be relevant for the discussion of the nuclear properties of NGC 4261.
From the deprojected density profile (Eq. 2) and the spectral analysis of the diffuse halo, one can place an upper limit on the accretion rate from the interstellar medium onto the central black hole by applying the Bondi theory of spherical accretion (Bondi 1952). Specifically, the Bondi accretion rate can be written (see, e.g., Di Matteo et al. 2003)
| (4) |
where is the accretion radius, the sound speed, and the density at the accretion radius. According to the above definition of and using the best-fit gas temperature, keV (see ), the accretion radius of NGC~4261 is located at 0.4′′ pc. Extrapolating the density profile to this distance, we derive . This value can be used to calculate the expected accretion luminosity. Assuming a canonical radiative efficiency of 10%, we find .
From the best-fit spectral model, after correcting for the covering fraction and the local absorption, the keV luminosity associated with the nuclear non-thermal component is . The estimate of the X-ray luminosity can be further increased to by extending the spectrum up to 100 keV, as observed with the PDS aboard BeppoSAX. It is worth noticing that the non-thermal luminosity is times smaller than the accretion luminosity inferred assuming .
The main results of the timing analysis are 1) the presence of rapid variability on time scales of a few ks; 2) the fact that the variability is more pronounced in the ultra-soft 0.3–0.8 keV energy band than in the hard 2–10 keV energy band; and 3) the possible existence of an anti-correlation between the hardness ratio and the total count rate.
6.2 Properties of the VLBI Jet
One of the goals of this paper is to determine the extent to which the jet contributes to the nuclear X-ray emission from NGC 4261. In this section, we investigate the properties of the pc-scale jet focusing on its energetic requirements.
It is generally believed that the most important power content of extragalactic jets is not in the form of internal random energy giving rise to observed radiation, but in the form of kinetic power associated with particles and magnetic fields. This requirement comes from the power budget of extended radio structures, which need an average supply greater than the luminosity generated by the jet at all scales (e.g., Rawlings & Saunders 1991; Ghisellini & Celotti 2001).
The total power transported by the flow is thus a fundamental property for the discussion of jet energetics. An estimate of the minimum jet kinetic power can be obtained following the method of Gliozzi, Bodo & Ghisellini (1999). This method assumes that the energy flux flowing through the cross-section of the jet is carried by particles, , and magnetic fields, , where is the radius of the jet cross-section, the bulk Lorentz factor, , the comoving particle density, the mean Lorentz factor of the electrons, and the magnetic energy density. The quantity is either the proton mass in the case of “normal” plasma, or the positron mass for pairs. A lower limit on the electron density can be estimated from the observed synchrotron emission . Approximating the VLBA jet as a cylinder of radius and length , the number density of leptons producing the observed radiation is ), where is averaged over the relativistic electron distribution, is the Doppler factor, and is the Thomson cross-section. As the kinetic power associated with the particles has a dependence on the magnetic field, , the total kinetic power can be minimized with respect to the magnetic field, . This yields a value of the magnetic field corresponding to the minimum power.
In blazars, where jets on pc-scales are unresolved due to the small viewing angle, the jet parameters have to be inferred indirectly by modelling the spectral energy distributions (SED) with specific models (e.g., Tavecchio et al. 2000). On the other hand, in the case of NGC~4261 the pc-scale jet parameters are obtained directly from VLBA observations (Jones & Wehrle 1997; Piner, Jones, & Wehrle 2001). The jet spectral index is (, and therefore the index of the electron energy distribution is . The jet velocity and inclination to the line of sight are and 63∘, respectively; as a consequence the bulk Lorentz factor is and the Doppler factor is . The synchrotron luminosity derived from radio data is . Note that a possible contribution from the UV jet is less than 10% of the radio luminosity (Chiaberge et al. 2003). A negligible contribution to the synchrotron luminosity is expected from the X-rays on a twofold basis: 1) the steepness of the electron energy distribution, and 2) the fact that the SED of NGC~4261 has a secondary broad peak located in the X-ray range (Lewis et al. 2003). From the VLBA images the jet has transverse and longitudinal dimensions of mas and mas, which correspond to cm and cm after deprojecting the longitudinal dimension.
The main uncertainties in deriving the jet kinetic luminosity are the low- and high-energy cutoffs in the electron energy distribution, and , respectively. An upper limit can be determined assuming that the radio-to-UV emission is due to synchrotron emission from the same electron population. This is a reasonable assumption for a mildly relativistic jet, as inferred from the VLBA observations of NGC 4261 (see Chiaberge et al. 2003 for a detailed discussion of the UV jet). Given the steep electron energy distribution, most of the energy is stored in low-energy electrons, and therefore the low-energy cutoff plays a more important role than . Since there is no direct and secure way to set a lower limit on , we carried out the calculation of assuming ranging between 1 and 30 (typical values inferred by blazar SED modelling; e.g., Tavecchio et al. 2000), and we evaluated the influence of the low-energy cutoff on and .
The magnetic field corresponding to the minimum power is mG, for a “normal” plasma and . A somewhat lower value, mG, is found assuming . Similar values are found in the case of pair plasma: mG. With a magnetic field strength equal to , the particle kinetic power and the Poynting flux are nearly equal, and the total power ranges between and for normal and pair plasmas, respectively. Slightly lower values are found assuming a low energy cut-off of 30.
The jet kinetic power must be multiplied by two to take into account the contribution from the counter-jet. It is worth noticing that while the values of are of the same order as the ones derived for blazars, the kinetic luminosity is significantly lower. This is due to the low value of inferred from the VLBA observations; assuming , as in blazars, the kinetic luminosity increases by several orders of magnitude () and becomes consistent with the values typically inferred for BL Lacs.
6.3 Origin of the nuclear X-ray emission
The strong correlation between radio and X-ray core fluxes found in low-luminosity (Fabbiano et al. 1984; Canosa et al. 1999) and high-luminosity (Worrall et al. 1994; Hardcastle et al. 1998) radio galaxies has often been used to argue in favor of a common origin from the unresolved base of the jet for the emission at the two wavelengths (e.g., Hardcastle & Worrall 1999 and references therein). More recently, a jet origin for the X-rays was claimed for several low-power radio galaxies observed with Chandra (Pellegrini et al. 2003; Fabbiano et al. 2003; Chiaberge et al. 2003).
We note the following:
1) While the strong correlation between radio
and X-ray fluxes does suggest a physical connection, it does
not necessarily imply a common jet origin of the two fluxes. Indeed,
accretion onto compact objects and relativistic jets seem to be
correlated phenomena (e.g. Begelman, Blandford & Rees 1984).
As a consequence,
at some level, a correlation between the jet and the
disk-corona222For simplicity, we
use the term “disk corona” to indicate any type of accretion flow at work
around the black hole. flux is expected.
2) The claim of a jet origin for the X-rays, in addition to the radio-X-ray correlation, is based on spectral results. However, a common problem affecting the study of AGN is spectral degeneracy: the same spectrum can be equally well described by quite different spectral models. This is exacerbated in the case of low-power radio galaxies, due to their low signal-to-noise ratio X-ray spectra. For example, in the case of NGC~4261, the photon index is consistent with inverse Compton emission from a jet but also with an advection dominated accretion flow (ADAF) model. It is worth noticing that Fabbiano et al. (2003) fit satisfactorily the radio-to-X-ray SED of the low-luminosity radio galaxy IC~1459 with a jet-dominated model. However, as already highlighted by Di Matteo et al. (2001a) for several nearby galaxies, this simply indicates that analytical ADAF models are unable to account for the high radio flux and that an additional contribution, possibly from a small-scale radio jet, is required. It does not necessarily imply that a pure jet model is the solution. In fact, this latter model, tentatively applied to higher quality and much broader bandpass energy spectra, is far from being widely accepted yet (e.g., Zdziarski et al. 2003).
In order to break the spectral degeneracy, one needs to exploit additional information coming, for example, from temporal analysis. Relying upon timing and spectral variability results from long monitoring campaigns of two powerful broad-line radio galaxies (BLRG; 3C~390.3 and 3C~120), Gliozzi, Sambruna & Eracleous (2003) concluded that the X-ray emission is not dominated by jets. Both BLRGs display typical X-ray behavior observed in Seyfert galaxies, namely a softer X-ray spectrum with increasing flux (e.g., Petrucci et al. 2000; Vaughan & Edelson 2001; Papadakis et al. 2002) and a larger variability amplitude in soft X-rays (Nandra et al. 1997; Markowitz & Edelson 2001). Moreover, jet-dominated sources, i.e., blazars, typically show the opposite temporal and spectral behavior: the X-ray spectrum hardens when the flux increases and the variability amplitude increases toward higher energies (see, e.g., Zhang et al. 1999; Fossati et al. 2000). In the case of NGC~4261, the temporal and spectral variability behavior similar to that shown by 3C~390.3 and 3C~120 (although with a lower statistical significance) is suggestive evidence that most of the X-rays originate from the disk-corona system. This favors the conclusion that the jet is not the dominant mechanism producing the X-rays in the nucleus of NGC 4261.
This conclusion is independently confirmed if we compare the jet kinetic power with the X-ray luminosity. Let us assume that most of the X-rays originate from the jet; this would lead to the unphysical conclusion that the radiative power of the jet is more important than its kinetic power. This would be at odds with the energetic requirements of the lobes (see §6.2). One can object that the estimated represents only the minimum value for the kinetic power of the jet, and that, if the jet is not in equipartition, this value can significantly increase. However, one must keep in mind that 1) moderate departures from equipartition do not increase by orders of magnitude (Ghisellini & Celotti 2001); 2) typical values for the kinetic-to-radiative luminosity ratio in radio-loud AGNs are estimated to be (see, e.g., Celotti & Fabian 1993).
6.4 Nature of the accretion flow
Before starting the discussion on the nature of the accretion flow, it is necessary to emphasize the distinction between radiatively inefficient accretion flow (RIAF) and ADAF models. The former class describes the properties of rotating accretion flows where very little of the accretion energy is radiated away, whereas ADAF models are simple analytical models for the dynamics of RIAF models. The most relevant difference is that ADAF models predict that the rate at which gas accretes onto the black hole is comparable to the Bondi accretion rate; therefore, the low luminosity in ADAF models is just due to very low radiative efficiency. On the other hand, time-dependent numerical simulations of RIAF models indicate that , implying that the observed low luminosity is also due to a low accretion rate, rather than just a low efficiency. For a more detailed discussion of RIAF models see, e.g., Quataert (2003).
Recently, Chandra studies of the nature of the accretion flows in several giant elliptical galaxies have returned some controversial results on the relation between and . For example, Di Matteo et al. (2001b, 2003) question whether is a reliable estimate of and whether the ADAF model is a viable solution for NGC~6166 and M87. In this latter case, if feedback effects from the base of the jet on the accretion flow are taken into account, can be as low as . Also Loewenstein et al. (2001) conclude that must be significantly smaller than to find X-ray fluxes in agreement with the values observed by Chandra for NGC~1399, NGC~4472, and NGC~4636. On the other hand, Pellegrini et al. (2003) and Fabbiano et al. (2003), investigating respectively IC~4296 and IC~1459, conclude that can be a reliable estimate of . However, the authors exclude the ADAF scenario on the basis of SED considerations, in particular the high radio-to-X-ray flux ratio, favoring instead a jet-dominated model.
In the case of NGC~4261, on the basis of the Chandra data alone and according to the Bondi theory, the first conclusion is that the black hole is not fuel-starved (). Given that the expected accretion luminosity (assuming a canonical efficiency of 10%) is much higher than the disk-corona luminosity, we would be tempted to conclude that accretion is radiatively inefficient. Indeed, using the results derived by Loewenstein et al. (2001) for NGC~1399 (which has and similar to those of NGC~4261), by applying the basic ADAF model, we can conclude that the 2–10 keV luminosity of NGC~4261 is roughly consistent with . Therefore, disregarding the problem of the high radio-to-X-ray flux ratio, possibly solved by ascribing to the base of the jet most of the core radio emission (see e.g., Di Matteo et al. 2001a), at the zeroth order an ADAF (+ radio jet) seems to be an acceptable solution.
An independent way to test whether is a reliable estimate of is based on a comparison between the accretion rate and outflow rate, , which can be derived from the kinetic energy of the jet: . Assuming = and the value of the kinetic power derived in , the conclusion would be that . This value seems low considering that studies of the jet-disk luminosities of the BL Lac class (the parent population of FR I according to the unification models; e.g., Urry & Padovani 1997) indicate that the channelling of matter from the accretion flow into the jet outflow seems to be particularly efficient. For example, Maraschi & Tavecchio (2003) find that for BL Lacs . Applying this result to NGC~4261 with , , and given by the above formula, we obtain an unphysically low radiative efficiency, .
Further independent evidence that the derived for NGC~4261 is unreasonably small comes from MHD simulations that show that most of the inflowing flow is lost in a magnetically driven wind (e.g., Stone & Pringle 2001; Hawley & Balbus 2002). As a consequence, energetic considerations favor a RIAF model, where the intrinsically low luminosity of NGC~4261 is explained in terms of low accretion rate coupled with a moderately low radiative efficiency.
Additional important pieces of information can come from the XMM-Newton observations, in particular from the temporal analysis. Even though, historically, rapid X-ray variability in AGN has been associated with standard accretion disks, ADAF models can also account for such variability if the X-rays are produced by Compton process in the inner region of the accretion flow. The rapid flux variations detected from NGC~4261 indicate that such variability can actually occur also in low-power AGNs and that RIAF models should account for this temporal behavior consistently. Indeed, the rapid X-ray flares observed from Sgr have been recently interpreted by Yuan et al. (2003) in the framework of radiatively inefficient accretion flow models.
7 Summary and Conclusions
We have presented XMM-Newton, Chandra, and BeppoSAX observations of the
low-power FR I radio galaxy NGC~4261, host of a supermassive
black hole and an optical LINER. The main findings can be
summarized as follows:
Several spatial components are present in the X-ray image: an
unresolved nuclear region, present in all energy bands; a diffuse hot
halo, dominating the 0.6–2 keV emission; a double-sided kpc-scale jet;
and several point-like sources. The jet and the point sources give a
negligible contribution to the X-ray flux in the XMM-Newton aperture.
The surface brightness of the extended circumnuclear emission is well fitted
with a -model (, ′′). Combining these
results with the spectral analysis ( keV) and using the Bondi
theory, an accretion rate of
is found, corresponding to an accretion luminosity of for a radiative efficiency of 10%.
The spectrum of the nucleus is well described from 0.3–10 keV by a
power law with , partially covered by cold gas
(CvrFract, ), plus a highly ionized unresolved iron line at
keV. The presence of a line is confirmed by BeppoSAX, which also detects
at the 3 level high-energy emission up to 100–150 keV.
The total non-thermal luminosity in the 0.3–10 keV band is
1.2 (
between 0.3 and 100 keV), which is more than 2 orders of magnitude lower than
the expected accretion luminosity.
Significant flux and spectral variations of the nuclear X-ray emission
were detected with EPIC. The variability is more pronounced
in the soft band (0.3–0.8 keV), and the hardness ratio appears to be
anti-correlated with the count rate. We conclude that most of the nuclear X-ray
emission is related to the accretion flow and that the base of the jet is not the dominant source of X-rays from the nucleus of NGC 4261.
Energetic arguments based on the jet kinetic power support this conclusion
and suggest that the Bondi accretion rate overestimates (presumably by orders
of magnitude) the actual accretion rate onto the black hole. Therefore, the low
X-ray luminosity of NGC~4261 can be explained in terms of low accretion rate
coupled with a moderately low radiative efficiency, not just a very low efficiency
as hypothesized by ADAF models.
These results suggest some general conclusions. Although great
progress in the study of accretion in AGN is made by comparing spectral models
with the data, spectral results alone cannot unequivocally constrain
the origin of the X-rays and the nature of the accretion onto the
central black hole. This is especially true for low-power radio galaxies,
whose low signal-to-noise spectra can be acceptably fitted with
completely different physical models. Spectral analysis is further
complicated by the presence of several distinct components
contributing to the total X-ray emission.
Major progress in the understanding of accretion phenomena can only be
reached by combining spectral results with independent information
from spatial and timing analyses. To this aim, constraints from
both Chandra and XMM-Newton are needed.
APPENDIX
Serendipitous sources in the Chandra field
The Chandra ACIS-S image of NGC~4261 in the 0.3–10 keV energy range
(Figure 1, bottom right panel)
reveals the presence of several off-nuclear point sources.
We used the CIAO tool
wavdetect to search for serendipitous X-ray sources in the
f.o.v
| Source | RA | DEC | Counts a | D b |
| (J2000) | (J2000) | [0.35–9 keV] | [′′] | |
| A | +49′32′′ | 26 | ||
| B | +49′27′′ | 13 | ||
| C | +49′36′′ | 7.5 | ||
| D | +49′43′′ | 15.5 | ||
| E | +49′27′′ | 34 |
a For comparison, the number of counts found in the
central 2′′ source region is .
b Distance in arcsecond from NGC~4261.
The algorithm returns a list of elliptical regions that define the positions and the shapes of the detected sources (see Table 4). We next used the coordinates from wavdetect and its associated error regions to search for optical counterparts on ESO archival plates and HST images. However, none of the five serendipitous sources has an apparent optical counterpart. Source has enough counts for temporal and spectral analyses. The spectrum, which extends only in the 0.5–1.5 keV range, is well fitted by a simple power law () absorbed by Galactic , with an absorbed flux of . The light curve is consistent with the source flux being constant ().
Acknowledgements.
We are grateful to T. Cheung, M. Chiaberge, T. Di Matteo, D. Donato, M. Eracleous, J. Krolik, Alex Rinn, and F. Tavecchio for helpful discussions. Financial support from NASA LTSA grants NAG5-10708 (MG, RMS) and NAG5-13035 (WNB) is gratefully acknowledged. Funds were also provided by NASA grant NAG5-10243 (MG, RMS) and by the Clare Boothe Luce Program of the Henry Luce Foundation (RMS).References
- (1) Arnaud, K. 1996, in ASP Conf. Ser. 101, Astronomical Data Analysis Software and Systems V, ed. G. Jacoby & J. Barnes (San Francisco: ASP), 17
- (2) Begelman, M.C., Blandford, R.D., & Rees, M.J. 1984, Rev. Mod. Phys., 56, 255
- (3) Binney, J, & Tabor, G. 1995, MNRAS, 276, 663
- (4) Bondi, H. 1952, MNRAS, 112, 195
- (5) Canosa, C.M., Worrall, D.M., Hardcastle, M.J., & Birkinshaw, M. 1999, MNRAS, 310, 30
- (6) Cavaliere, A., & Fusco-Femiano, R. 1976, A&A, 49, 137
- (7) Celotti, A., & Fabian, A.C. 1993, MNRAS, 264, 228
- (8) Chiaberge, M., Gilli, R., Macchetto, F.D., Sparks, W.B., & Capetti, A. 2003, ApJ, 582, 645
- (9) Ciotti, L., & Ostriker, J.P. 2001, ApJ, 551, 131
- (10) Di Matteo, T., Carilli, C.L., & Fabian, A.C. 2001a, ApJ, 547, 731
- (11) Di Matteo, T., Johnstone, R.M., Allen, S.W., & Fabian, A.C. 2001b, ApJ, 550, L19
- (12) Di Matteo, T., Allen, S.W., Fabian, A.C., Wilson, A.S., & Young, A.J. 2003, ApJ, 582, 133
- (13) Donato, D., Gliozzi., M., Sambruna, R.M., & Pesce, J.E. 2003 A&A, in press (astro-ph/0305407)
- (14) Edelson, R., Turner, T.J., & Pounds, K. 2002, ApJ, 568, 610
- (15) Ettori, S. 2000, MNRAS, 311, 313
- (16) Fabbiano, G., Miller, L., Trinchieri, G., Longair, M., & Elvis, M. 1984, ApJ 277, 115
- (17) Fabbiano, G., Elvis, M., Markoff, S., et al., 2003, ApJ in press (astro-ph/0301297)
- (18) Ferrarese, L., Ford, H.C., & Jaffe, W. 1996, ApJ, 470, 444
- (19) Ferrarese, L, Pogge, R.W., Peterson, B.M., et al. 2001, ApJ, 555, L79
- et al. (1999) Fiore F., Guainazzi M., Grandi P., 1999, Handbook for BeppoSAX NFI spectral analysis
- et al. (1985) Forman, W., Jones, C., & Tucker, W. 1985, ApJ, 293, 102
- et al. (2000) Fossati, G., Celotti, A., Chiaberge, M., et al., 2000, ApJ, 541, 153
- (23) Gebhardt, K., Kormendy, J., Ho, L.C., et al. 2000, ApJ, 543, L5
- (24) Ghisellini, G., & Celotti, A. 2001, MNRAS, 327, 739
- (25) Gliozzi, M., Bodo, G., & Ghisellini, G. 1999, MNRAS, 303, L37
- (26) Gliozzi, M., Sambruna, R.M., & Eracleous, M. 2003, ApJ, 584, 176
- (27) Hardcastle, M.J., Lawrence, & C.R. Worrall, D. M. 1998, ApJ, 504, 743
- (28) Hardcastle, M.J., & C.R. Worrall, D. M. 1999, MNRAS, 309, 969
- (29) Hawley, J.F., & Balbus, S.A., 2002, ApJ, 573, 738
- (30) Heckman T.M., 1980, A&A, 87, 152
- (31) Ho, L. C., Filippenko, A. V., & Sargent, W. L. W. 1995, ApJS, 98, 477
- (32) Holt, S.S., Mushotzky, R.F., Boldt, E.A., et al. 1980 ApJ, 241, 13L
- (33) Jones, D.L., & Wehrle, A.E. 1997, ApJ, 484, 186
- (34) Lawrence, A. 1999, AdSpR, 23, 1167
- (35) Lewis, K.T., Eracleous, M., & Sambruna, R.M. 2003 ApJ in press (astro-ph 0304399)
- (36) Loewenstein, M., Mushotzky, R.F., Angelini, L., Arnaud, K.A., & Quataert, E. 2001, ApJ, 555, 21L
- (37) Maraschi, L., & Tavecchio, F. 2003, ApJ in press (astro-ph/0205252)
- (38) Markoff, S., Falcke, & H. Fender, R. 2001, A&A, 372, 25
- (39) Markowitz, A., & Edelson, R. 2001, ApJ, 547, 684
- (40) Nandra, K., George, I.M., Mushotzky, R.F., Turner, T.J., & Yaqoob, T. 1997, ApJ, 476, 70
- (41) Narayan, R. 2002, Lighthouses of the Universe. Proceedings of the MPA/ESO, ed. M. Gilfanov, R. Sunyaev, & E. Churazov, 405
- (42) Papadakis, I.E., Petrucci, P.O., Maraschi, L., et al. 2002, ApJ, 573, 92
- (43) Pellegrini, S., Venturi, T., Comastri, A., et al. 2003, ApJ, 585, 677
- (44) Petrucci, P.O., Haardt, F., Maraschi, L., et al. 2000, ApJ, 540, 131
- (45) Piner, B.G., Jones, D.L., & Wehrle, A.E. 2001, ApJ, 122, 2954
- (46) Quataert, E. 2003, Astron. Nachr., 324, 3 (astro-ph/0304099)
- (47) Rawlings, S.G., & Saunders, R.D.E. 1991, Nature, 349, 138
- (48) Ross, R.R. & Fabian, A.C., 1993, MNRAS, 261, 74
- (49) Sambruna, R.M., Eracleous, M., & Mushotzky, R. 1999, ApJ, 526, 60
- et al. (2003) Sambruna, R.M., Gliozzi, M., Eracleous, M., Brandt,W.N., & Mushotzky, R. 2003, ApJ, 586, 37
- (51) Sarazin C.L., 1988, X-ray emission from clusters of galaxies, Cambridge University Press
- (52) Stone, J.M., & Pringle, J.E. 2001, MNRAS, 322, 461
- et al. (2000) Tavecchio, F., Maraschi, L., Ghisellini, G., et al. 2000b, ApJ, 543, 535
- (54) Terashima, Y., Iyomoto, N., Ho, Luis C., & Ptak, A.F. 2002, ApJS, 139, 1
- (55) Urry, C.M., & Padovani, P. 1995, PASP, 107, 803
- (56) Vaughan, S., & Edelson, R. 2001, ApJ, 548, 694
- (57) Worrall, D.M., & Birkinshaw, M. 1994, ApJ, 427, 134
- (58) Worrall, D.M., Lawrence, C.R., Pearson, T.J., & Readhead, A.C.S. 1994, ApJ, 420, L17
- (59) Yuan, F., Quataert, E., & Narayan, R. 2003, ApJ submitted (astro-ph/0304125)
- (60) Zdziarski, A.A., Gilfanov, M., Lubiński, P., & Revnivtsev, M. 2003, MNRAS in press (astro-ph/0209363)
- (61) Zhang, Y.H., Celotti, A., Treves, A., et al. 1999, ApJ, 527, 719