On the Structure and Kinematics of Nebulae around LBVs and LBV Candidates in the LMC
We present a detailed analysis of the morphology and kinematics of nebulae around LBVs and LBV candidates in the Large Magellanic Cloud. HST images and high-resolution Echelle Spectra were used to determine the size, shape, brightness, and expansion velocities of the LBV nebulae around R 127, R 143, and S 61. For S Dor, R 71, R 99, and R 84 we discuss the possible presence of nebular emission, and derive upper limits for the size and lower limits on the expansion velocities of possible nebulae. Including earlier results for the LBV candidates S 119 and Sk we find that in general the nebulae around LBVs in the LMC are comparable in size to those found in the Milky Way. The expansion velocities of the LMC nebulae, however, are significantly lower—by about a factor of 3 to 4—than those of galactic nebulae of comparable size. Galactic and LMC nebulae show about the same diversity of morphologies, but only in the LMC do we find nebulae with outflow. Bipolarity—at least to some degree—is found in nebulae in the LMC as well as in the Milky Way, and manifests a much more general feature among LBV nebulae than previously known.
Key Words.:
Stars: evolution – Stars: mass-loss – ISM: bubbles: jets and outflows1 Introduction
The most massive stars we know and observe have masses above M☉ and start as main sequence O stars with luminosities of L☉. They inhabit the very upper left part of the Hertzsprung-Russell Diagram (HRD). After a hot main sequence phase the stars evolve quickly towards cooler temperatures and turn into supergiants within few 106 years. Instead of evolving further towards the red, the most massive stars enter a phase of very high mass loss (about 10M☉yr-1) and reverse their evolution back towards hotter effective temperatures. In this phase the stars are known as Luminous Blue Variables (LBVs). The position of the turning point, and therefore of the LBVs (in quiescence) in the HRD, depends on the star’s luminosity, and defines the location of the Humphreys-Davidson limit (e.g. Humphreys & Davidson 1979, 1994; Langer et al. 1994).
Strong stellar winds and possible giant eruptions in the LBV phase peel off more and more of the stellar envelope, and lead to the formation of circumstellar LBV nebulae (e.g. Nota et al. 1995; Weis 2001). These LBV nebulae are small, typically between 0.2 and about 2 pc, and can therefore only be studied in our galaxy and, with the higher resolution of the Hubble Space Telescope (HST), in a few neighboring galaxies such as the Large Magellanic Cloud (LMC). Our knowledge about the evolution of the most massive stellar objects in general, and in the LBV phase in particular, is sparse. It is not known what leads to the very high mass loss rates in these objects and what triggers the giant eruptions. These, however, are essential questions to understanding the stellar evolution of massive stars. To gain insight into the LBV phase and especially the formation of LBV nebulae, we studied the nebulae around LBVs in the LMC. These LBV nebulae have formed under different conditions, namely at lower metalicity, than those in the Milky Way, and are therefore of great interest. So far the LBV nebulae in the Magellanic Clouds are the only nebulae, other than the galactic ones, which we are able to resolve spatially. In this paper we will compare the morphology and kinematics of nebulae around LBVs in the LMC with those in our Galaxy.
Only a few LBVs are known (roughly 40, several of which are still marked as candidates), of which 10 are in our Galaxy and 10 in the LMC. According to Humphreys & Davidson (1994), the following objects in the LMC are LBVs: S Dor, R 143, R 127, R 110, R 71, HDE 269582, and LBV candidates: S 119, S 61, R 84, R 99. We will add Sk to the list of candidates (now numbering 11 LBVs/LBV-candidates in the LMC) for reasons discussed in Weis et al. (1997), and strengthened in Weis & Duschl (2002), where this object was analyzed in detail. Among the LBVs in the LMC, R 143, R 127, S 119, S 61, and Sk are known to possess a circumstellar nebula. In this paper we present a study of LBVs and LBV candidates in the LMC, concentrating especially on the analysis (morphology and kinematics) of the nebulae—if present—using high-resolution Echelle spectra and Hubble Space Telescope images. The stars R 110 and HDE 269582 had to be excluded from this work due to a lack of data. Spectra and HST images of the LBV candidate S 119 have been previously analyzed (Weis et al. 2003). The results will be added and put into context with this work in the final discussion section. In the following we always assume a distance to the LMC of 50 kpc (see e.g. Kov acs 2000; Panagia et al. 1991; Westerlund 1990).
2 Observations and data reduction
2.1 Imaging with the HST
To study the morphology of the quite small nebulae around LBVs, images from the HST are especially useful. The following objects have been observed with the HST (see Table 1) and analyzed in this paper: R 127, R 143, S 61, R 71, S Dor, R 99. For S 119, see Weis et al. (2003). For R 110, R 84, HDE 269582, and Sk, no HST observations exist so far.
All objects were observed with the Wide Field Planetary Camera 2 (WFPC2). The F656N filter was selected and mimics quite well an Hα filter, since the radial velocities of the LMC stars is roughly 250 km s-1, and therefore Hα is within the maximum throughput of the filter. All available data were retrieved from the STScI data archive and reduced with the usual routines in STSDAS/IRAF. All (typically there were 4 images) longer exposures (500 s) of one object were combined and cosmic-ray cleaned. Information about the HST datasets are compiled in Table 1. The images were not rotated, to ensure the full resolution was maintained. The celestial directions are therefore indicated in the images. The roll angle of the HST images are also given in the last column of Table 1. All HST images were taken with the relevant stars centered on the PC chip, which has a sampling of 0.0455″/pixel. Most figures shown here of the stars and nebulae contain only this PC section. In the case of R 143 and R 99, nevertheless, the full mosaiked images are shown to discuss the stars and nebulae in context with the surrounding ISM. The sampling of those images is lower with 0.0996″/pixel. For S Dor, R 71, and R 99 we subtracted the Point Spread Function (PSF), which was generated with the Tiny Tim (Krist 1995) software for the corresponding positions and filters of each star. In all cases we tended to slightly oversubtract to make sure that possible residuals are real.
| star | HST image | HST Prog. | Echelle Spectra | NTT image | CTIO image | HST roll angle |
| R 127 | F656N | 6540 | 5 | - | - | 147.34° |
| R 143 | F656N | 6540 | 6 | - | Hα | 145.97° |
| S 61 | F656N | 6540 | 3 | - | - | 145.01° |
| S Dor | F656N | 6540 | 1 | - | Hα | 17.41° |
| R 71 | F656N | 6540 | 1 | - | - | 21.23° |
| R 99 | F656N | 6540 | 1 | Hα/EMMI | - | 148.58° |
| R 84 | - | - | 1 | Hα/EMMI and SUSI | - | - |
| S 119 | F656N | 6540 | 5 | - | - | 148.5° |
| Sk | - | - | 5 | - | Hα | - |
2.2 Imaging with the 0.9 m-CTIO-telescope
In addition to retrieving the HST images, we also obtained ground-based observations made with the 0.9 m-telescope at the Cerro Tololo Inter-American Observatory. These images were taken with an Hα filter, which contained the [N ii]-lines at 6548 Å and 6583 Å. The filter was centered on 6563 Å, and the FWHM was about 75 Å. The images were calibrated with bias and sky flatfield frames of the corresponding nights. The seeing was about 14, and the nights were photometric. Exposure times ranged between 600 s and 900 s for a single image. The scale for all images is 0397 per pixel. All images from the 0.9 m-telescope are displayed with north to the top and east to the left.
2.3 Imaging with the ESO NTT
We used the ST-ECF/ESO archive to obtain Hα or [N ii] images of the LBVs, for which no HST images are available, or additional information on the larger environment would be useful for interpreting our long-slit Echelle data.
The first archival data set was observed with the red arm of the EMMI multimode focal reducer instrument mounted at the ESO NTT 3.5 m-telescope. The filter used in these observations was an Hα filter (ESO #596) with a central wavelength of 6547Å and a FWHM of 73 Å. The EMMI red arm gives a pixel scale of with the 24 m pixel CCD (ESO #36). Due to limitations from the optical set-up, the usable field size was . Seeing during the observations was , and the expose time was 100 s for both fields. We reduced the data in the standard manner using IRAF. Cosmic rays were corrected on the science frames using the LA-COSMIC IRAF scripts, which perform cosmic ray detection using a Laplace filter technique (van Dokkum 2001).
The second archival data set was observed with the SUSI imager, also at the ESO NTT. A chronographic unit was inserted, which resulted in a round field with an occulting bar running across the field. The set-up and reduction of the data are the same as already reported in e.g. Weis (2000). Integration time of the R 84 Hα image was 1000 s, and the seeing was . The cosmic ray hits were corrected using the LA-COSMIC IRAF scripts.
As for the CTIO 0.9 m data, all ESO NTT images are displayed with north to the top and east to the left.
2.4 Long-slit Echelle spectroscopy
High-resolution long-slit Echelle observations were made with the Echelle spectrograph on the 4 m-telescope at the Cerro Tololo Inter-American Observatory in order to study the kinematics of the nebulae around R 127, R 143 and S 61. Spectra of S Dor, R 71, R 84, and R 99 were also taken, in order to search for nebular emission possibly connected to the star. All observations were made using the same configuration. In this set-up for the Echelle spectrograph we replaced the cross-disperser by a flat mirror and inserted a post-slit Hα filter (6563/75 Å) for order selection. The long-slit, which resulted from this configuration, was vignetted to a length of . The spectral region that was covered contained the Hα line as well as two [N ii] lines at 6548 Å and 6583 Å. We used the 79 l mm-1 Echelle grating with a slit-width of 150 m, corresponding to an instrumental FWHM at the Hα line of about 8 km s-1. The data were recorded with the long focus red camera and a pixel CCD, with a pixel size of 0.08 Å pixel-1 along the dispersion and 026 pixel-1 on the spatial axis. The seeing was between 1-2″ during the observations, and the weather was not photometric. Thorium-Argon comparison lamp frames were taken for wavelength calibration and geometric distortion correction. Telluric lines visible in the spectra were used to improve the absolute wavelength calibration, the accuracy of which is estimated to be 0.04 Å (2 km s-1) or better.
For each object, the position angle (PA) of the slit was chosen to match the symmetry of the nebula, as far as the morphology was previously known. Therefore, the PAs are different for each object and they are described and shown in images in the corresponding sections. The Slit naming was as follows: The Slit is named according to the position angle, e.g. Slit PA=222 is a slit with a position angle of 222 °. If several Slits are taken the names indicate the parallel offsets of the slits from the center, e.g., Slit 3N is a Slit 3″ north (or S for south) of the Slit observed at the stars center. Generally the naming convention becomes obvious from figures in each section which show the position and names of each Slit for each object.
The data are presented as echellograms and as measured position velocity diagrams (-diagrams). All echellograms displayed extend 65 Å along the spectral axis, which is centered on Hα (in rest); in spatial direction the echellograms are centered on the projected position of the central star onto the slit and are in most cases 1′ long. Some echellograms have an insert (20″ high, 5 Å wide) at the upper left, which illustrates the emission of the stronger [N ii] line (6583 Å) again, at different brightness levels to show structures with different surface brightness. For R 99 and R 84, the insert includes the total spectrum of the star and not only the [N ii], to better illustrate the spectral shape at the star’s position in contrast to the emission from the larger surroundings. The spectra of S Dor, R 99, and R 84 are also depicted in their full vignetted length of 4′. The -diagram of each slit was obtained by measuring the brighter [N ii] line at 6583 Å. The zero position in the -diagram corresponds to the projected position of the central star onto the slit. All -diagrams are generated by binning 4 pixels (1.04″) along the spatial axis. All velocities are measured in the heliocentric system and show a redshift caused by the radial velocity of the LMC.
3 The morphology and kinematics of individual objects
3.1 R 127
3.1.1 Previous work
Henize (1955) first recognized that the star R 127 (HDE 269858), in the Large Magellanic Cloud, shows an emission line spectrum. Walborn (1977, 1982) classified the star later as Ofpe/WN9. The S Dor typ variability (spectrum changed from Ofpe/WN9 to an early A, late B) of R 127 led to its classification as an LBV (Stahl et al. 1983). For the stellar parameters of R 127 in the maximum of the S Dor phase, they derived m, K, and R, a wind velocity of km s-1 and mass loss rate of M. The star’s mass estimate is about 60 M☉. A good compilation of the photometry and light curve of R 127 can be found in van Genderen et al. (1997a).
Already early low resolution spectra showed typical nebular lines, which hinted at the existence of a circumstellar nebula (Walborn 1982) and a line split found by Stahl & Wolf (1986b) showed the nebula’s expansion with roughly km s-1. Stahl (1985, 1987) showed, with direct imaging, that the point spread function of the star was slightly extended, and added evidence for a nebula. Stahl’s estimates for the size of the nebula was 35 45 or 0.8 1.1 pc. This measurement was supported by long-slit observations (Appenzeller et al. 1987) which yield an expansion velocity of km s-1, a diameter of 4″, and indicated deviation of the nebula’s shape from spherical symmetry. Polarimetric observations (Schulte-Ladbeck et al. 1993) revealed also that the stellar wind is asymmetric. Clampin et al. (1993) were successful in resolving the nebula with the use of the John Hopkins Adaptive Optics Coronograph. Their Hα+[N ii] image with a resolution of 07 showed a much larger nebula, extending 1.9 2.2 pc, and revealed a diamond shape. In a more recent kinematic study, Smith et al. (1998) favored a model with two expanding shells around R 127: one inner shell (about 0.6 pc from the star) expanding with km s-1 and an outer shell expanding with km s-1. Their abundance analysis made with an HST-FOS spectrum at the brighter eastern part of the nebula lead to the following parameters of the nebula: log N/H = 8.05, log O/H = 8.10, cm-3, and K.
3.1.2 The morphology from the HST images
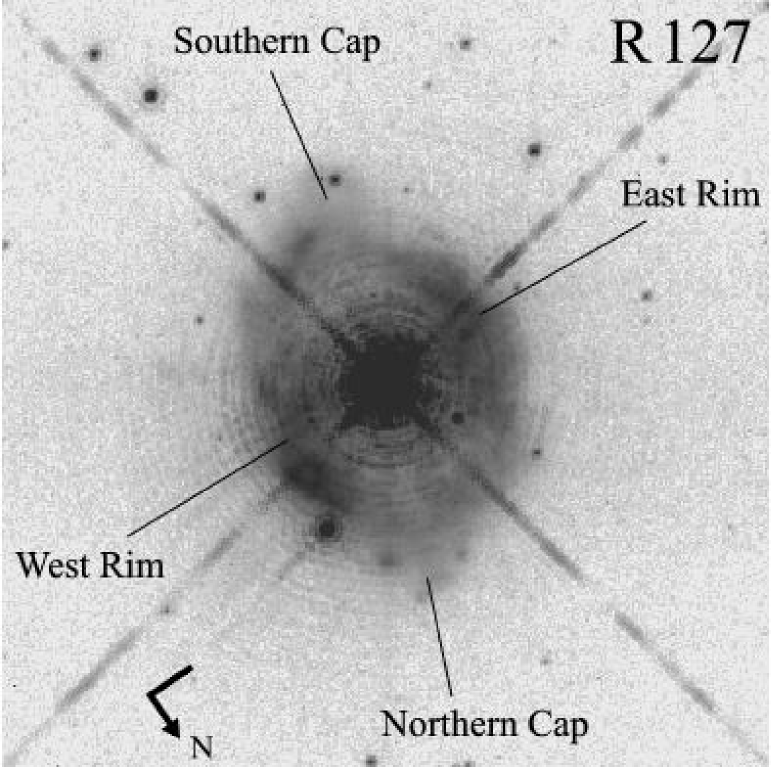
With the high-resolution HST image, a detailed study of the morphology of the nebula around R 127 is possible. Fig. 1 shows an F656N filter (Hα) image of the nebula. While the central region of the nebula resembles a nearly spherical structure with a diameter of 54 (1.31 pc), much fainter emission roughly north and south adds an elongated shape to the appearance of the nebula, henceforth called the Northern and Southern Caps. The Northern and Southern Caps extend 127 (0.31 pc) and 172 (0.42 pc), respectively, beyond the central body. The central shell consists of two brighter rims, one at the east, designated the East Rim, and one at the (north)-west side, the West Rim. The surface brightness is highest at a knot-like structure in the West Rim, quite close in projection to a star. The surface brightness of the nebula is highly variable. Beside obvious, distinct low and high surface brightness areas (Caps and Rims), knots and filaments of higher surface brightness can be found across the entire nebula. These knots reveal sizes of at least 01 or 0.03 pc for the smallest resolved structures, and up to 126 (0.3 pc) for the largest (and brightest) knot visible in the West Rim. The faintest structures in the nebula are the Caps with ergs cm-2 s for the Southern Cap and ergs cm-2 s for the Northern. Typical regions in the nebula reach a surface brightness of ergs cm-2 s, the East Rim is about a factor of 2.5 higher, and the high surface brightness knot in the West Rim is about 4.5 times brighter than this.
3.1.3 The Kinematics
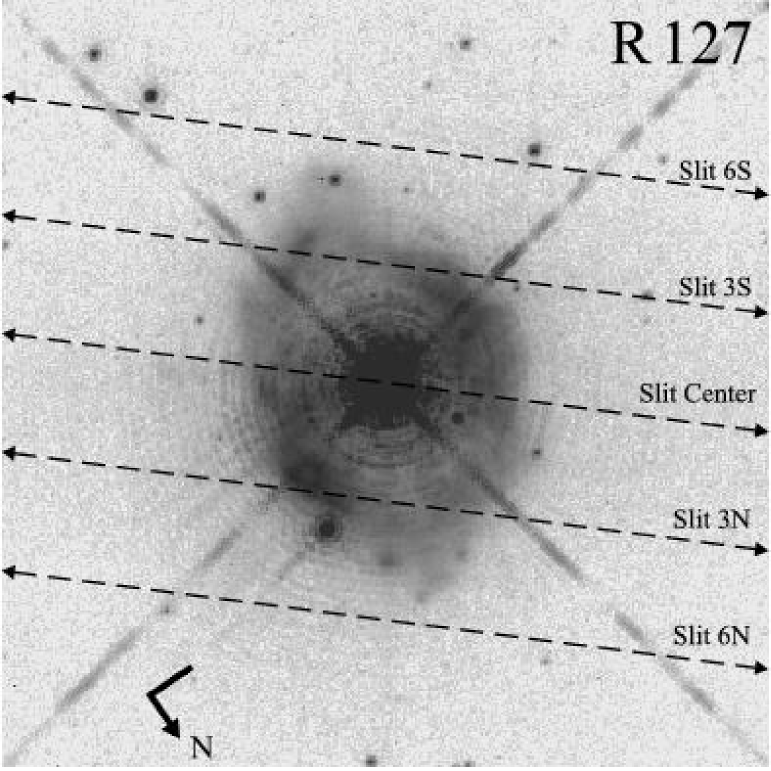
We observed 5 spectra of R 127 with a position angle (PA) of PA=230°. The position of the spectra and naming can be found in Fig. 2. The corresponding echellograms and position-velocity diagrams of each slit for R 127 are shown in Fig. 3. For R 127 the top of each echellogram points towards the south-west and negative offsets in the -diagram are to the north-east, positive to the south-west (see also Fig. 2).
The radial velocity of the nebula’s center of expansion lies at about and is consistent with the stars’ velocity and H i measurements of the LMC (e.g. Rohlfs et al. 1984). With an instrumental FWHM of roughly 8 km s-1, the expansion ellipse of the nebula was clearly resolved. At Slit Center, which crossed the central star, the expansion velocity was 31.5 km s-1. The expansion is much slower in Slit 3N and Slit 3S. In Slit 3N the maximum expansion velocity is km s-1, found at position , while the maximum expansion found in Slit 3S is km s-1 at position 11. In both slit positions the Doppler ellipse is slightly deformed, indicating a deviation from spherical expansion. If we determine the spatial center of the ellipse (point of half the width) in the plots, it would be at in Slit 3N and at +15 in Slit 3S. Both ellipses are much smaller than in the central slit position, and their centers are shifted against each other.
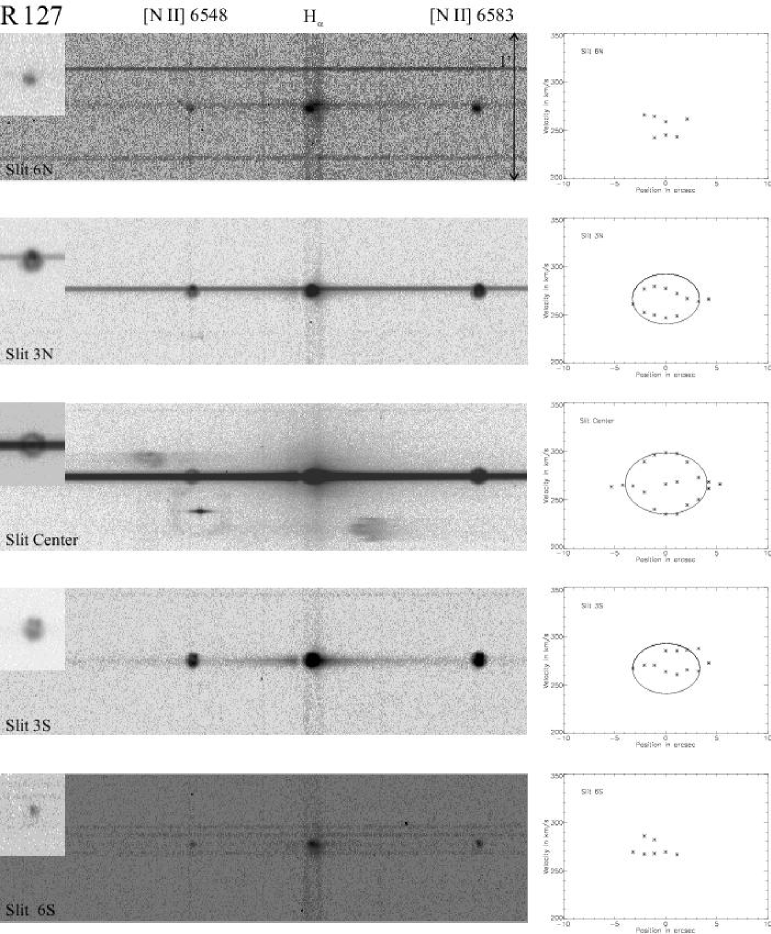
Futher out, no clear expansion ellipse was detected. Nevertheless, the measured velocity values were scattered around two components—in the case of Slit 6N, at 243 km s-1and 260 km s-1, and for Slit 6S, at 267 km s-1 and 283 km s-1. The emission detected in Slit 6N can be identified with the Northern Cap, that in Slit 6S with the Southern.
Note that at the redshifted side of the Doppler ellipse in Slit 3N a brighter knot is visible (above the stellar continuum, see insert in Fig. 3), which is identified with the brighter knot found in the West Rim.
In Slit Center an additional velocity component appears which has a velocity of 267 km s-1, similar to the radial velocity of the star (Stahl & Wolf 1986a) and identical with the velocity of the center of expansion. This component is only visible at the star’s position and does not extend further into the nebula. The large spatial size of this component in the -diagram of Slit Center is only due to the binning of the data points.
The [N ii]6583Å/Hα ratio of the nebula around R 127, as measured in the spectra reaches , this is consistent with earlier measurements (see for example Smith et al. 1998). The Northern and Southern Caps show the same value.
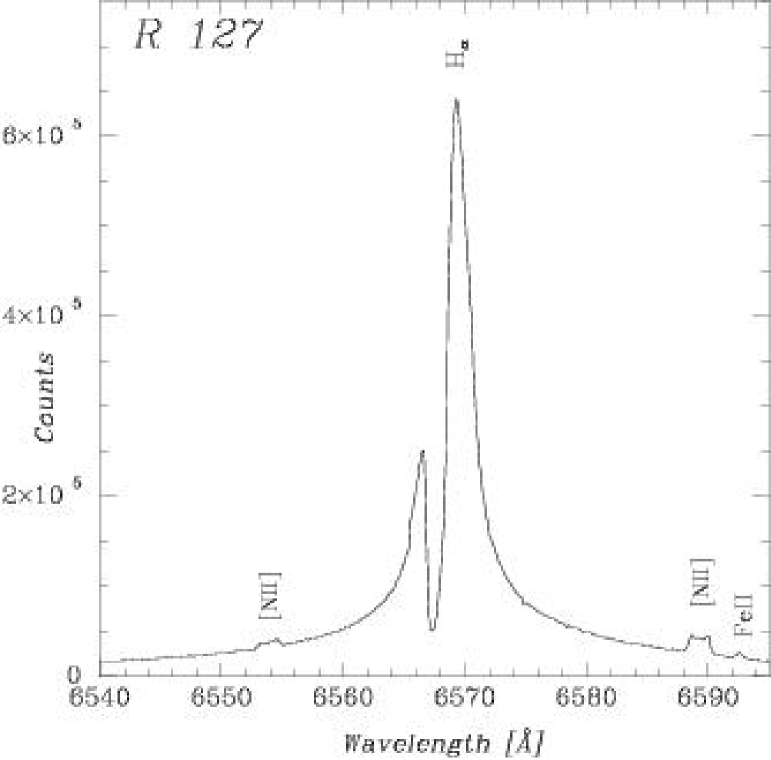
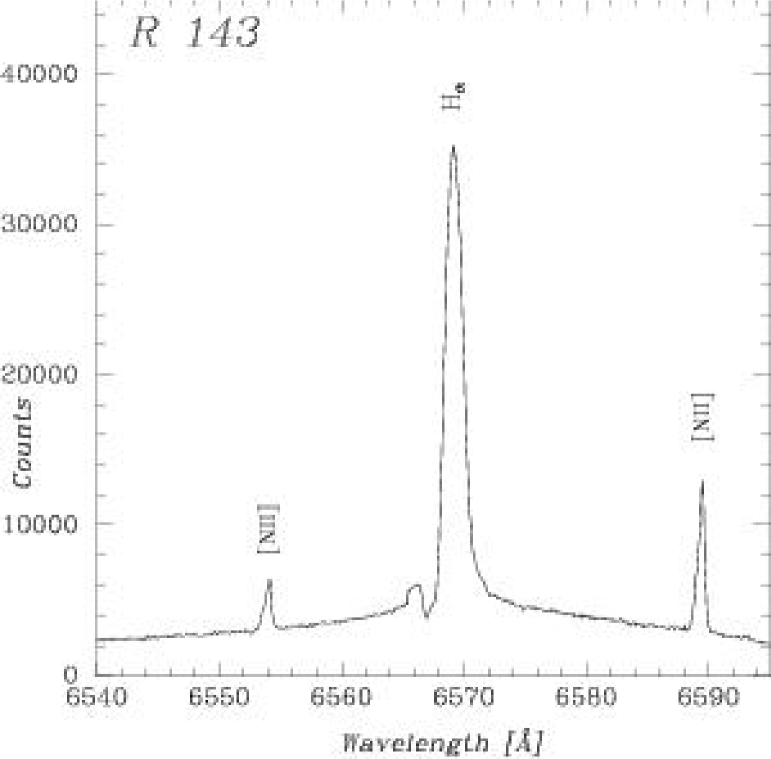
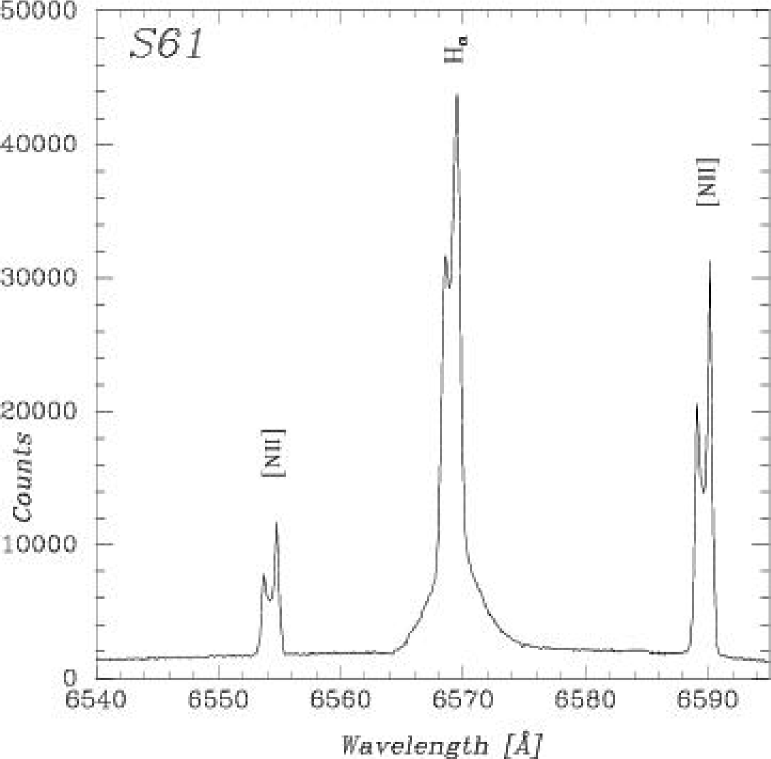
A spectrum of the star (within our limited spectral range) and the superimposed emission of the nebula is shown in Fig. 4. The tripel peak in the [N ii] emission lines is faintly visible.
3.1.4 Discussion
Combining the morphological information from the HST images (Fig. 1), with the kinematics (Doppler shifts) from the spectra, it becomes clear that the nebula around R 127 is not simply spherical. The nebula consists of an inner, nearly spherical part, which further out is more and more elongated. This elongations is most prominent in the north and south where the Caps are attached. The kinematics of the nebula hint that even the apparently sherical shell in the center is not expanding as expected (assuming a constant expansion velocity). The deformed expansion ellipses in Slit 3N and Slit 3S indicates a deviation from spherical expansion. This becomes obvious by comparing the data (asterisks) with the model of an expansion ellipse with spherical expansion (line) in the plots. In both Slit 3N and Slit 3S the data are shifted with respect to the sphecial model. If the nebula would be spherical the center of expansion should be the same in all slits and lie at about 267 km s-1. Therefore it is concluded that the nebula is not expanding with sphercial symmetry in the north and south. More precisely, the southern part of the nebula is more redshifed, the northern more blueshifted than the nebula’s center. The global expansion is bi-directional. This bi-directional expansion is supported by the image of the nebula, which shows an elogated bipolar shape, most obvious in the Caps.
In addition to the expanding shell, [N ii] emission is also present with the radial velocity of the star, but only at the star’s position. This emission may result either from a second shell which is extremely close to the star, or represents a knot-like structure which appears projected onto the star and moves more slowly than the shell. The emission might also have its origin in a circumstellar disk close to the star which was proposed by Schulte-Ladbeck et al. (1993). This third velocity component (two result from the expansion ellipse of the shell) is clearly separated from the first two components of the expansion ellipse. It is a single peaked emission line with a FWHM=23.6 km s-1(corrected for the instrumental FWHM). A determination from the HST images of a second shell is impossible because of the bright central star. It also shows some bleeding which effects the longer exposures and makes it almost impossible to identify any features within 1″ of the star. A possible second—inner—shell around R 127 was already suggested by Smith et al. (1998), and they quote an expansion velocity of 29 km s-1. This result is not supported by the new measurements presented here and might result from a mixing of the three components.
Most likely the third [N ii] emission line structure is indeed a knot within the nebula or closer to the star. This scenario would best explain the similarity of the radial velocity of this emission line structure with the star’s radial velocity.
3.2 R 143
3.2.1 Previous works
Even though the central cluster of 30 Doradus is home to many young and massive stars, only one LBV is known in this region, the star R 143 or HD 269929. This star is located roughly 22 south of R 136, the dense cluster and core of 30 Dor. Based on a comparison of different photometric studies with a timespan of about 40 years (Parker 1992) and spectral analysis, R 143 was classified as LBV by Parker et al. (1993). During this time, the star changed from a relatively cool star (late F-type) to the hot part of the HRD (early B, perhaphs O9.5) and then cooled again to late B. Parker et al. (1993) estimated m and M☉.
The star was identified by Feast et al. (1960) and classified as an F7 ia star. Feast (1961) also identified at least four curved filaments close to the star, two of which could belong to a nebula around R 143 and are 15″ long (3.5 pc, see Figs. 5 and 6). Closer to the star, an elliptical structure was found slightly to the west of the central star. The identification of the filaments as part of a circumstellar nebula is hindered by many filaments and knots which belong to the 30 Dor H ii region—a clear classification of a circumstellar nebula from morphology alone is not possible. The first high quality images of the nebulosity around R 143 were obtained by Clampin et al. (unpublished, as quoted in Nota et al. 1995). These images show stronger [N ii] emission close to the star. Smith et al. (1998) analyzed the nebula around R 143 and found that the long filaments show abundances similar to those of the 30 Dor H ii region. Therefore, it was concluded that the filaments are not part of an LBV nebula, which should show a higher nitrogen content due to the CNO processed material. The filaments also move with a nearly constant radial velocity which is of the order of the velocities found in the 30 Dor complex. However, R 143 is surrounded by a much smaller high surface brightness LBV nebula. Spectra (Smith et al. 1998) very close to the star revealed nitrogen enhanced material. This area coincides with the stronger [N ii] emission region seen by Nota et al. (1995, Clampins images, see above). About 18 north of the star “a bona fide LBV nebula” is present. Smith et al. (1998) derive for the nebula a K, an average cm-3, and cm-3 in the inner 5″. Their [N ii]6583Å/Hα ratio of the nebula varies according to the distance from the star and reaches a maximum of 0.8 at 18 north of the star. This nebula is elongated in the north-south direction with a diameter of about 52 (1.3 pc). Their spectra showed a blueshifted motion with a velocity difference of 130 km s-1. They concluded that the LBV nebula around R 143 is much smaller, and the filaments (Feast 1961) are part of the 30 Dor complex and most likely not associated with R 143.
3.2.2 The Morphology from HST images
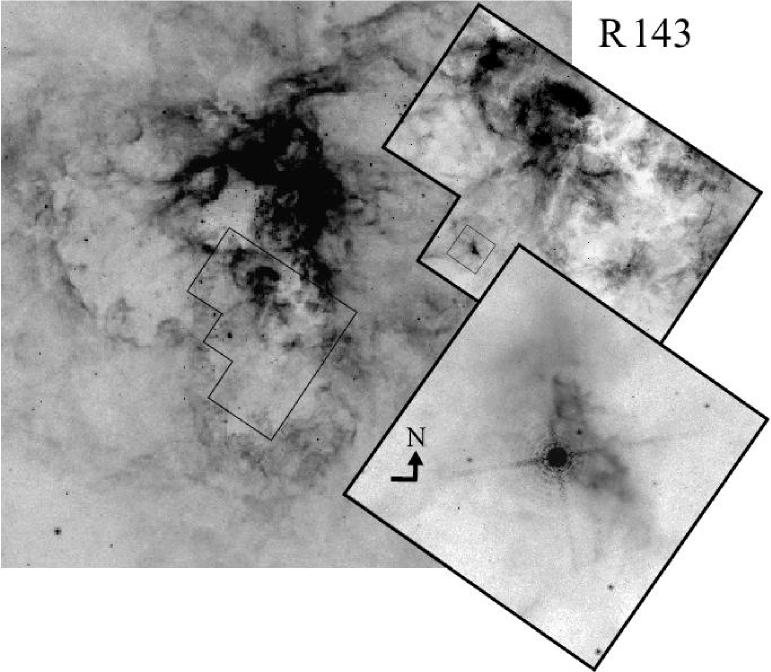
The upper left part of Fig. 5 shows an image taken with the 0.9 m-telescope at CTIO (Hα+[N ii] filter) and, in the upper right, the mosaiked WFPC2 image (F656N), in order to illustrate the position of R 143 with respect to the center of the 30 Dor complex. The high-resolution WFPC2 images underline the difficulty in disentangling the LBV nebular emission from the large background H ii region. A section of the PC image as seen in Fig. 5 includes the LBV nebula.
The LBV nebula is irregular—triangular shaped—and oriented north to south-west. The LBV nebula of R 143 shows a complex structure consisting of a large number of filaments (lower image in Fig. 5, FOV 10″ 10″). The LBV nebula is 49 in diameter along the main (long) axis, which corresponds to a linear size of 1.2 pc. The surface brightness is not homogeneous, and smaller filaments cross and reach even further out of the nebula, adding a net-like appearance. The rim of the nebula is defined through bent or curved structures. The nebula is concentrated to the west of the star, and no counterpart nebular emission is identified to the east. The surface brightness of the LBV nebula close to R 143 was derived to ergs cm-2 s. Feast’s filaments are much fainter with, on average, 4.3 10-14 ergs cm-2 s .
3.2.3 The kinematics
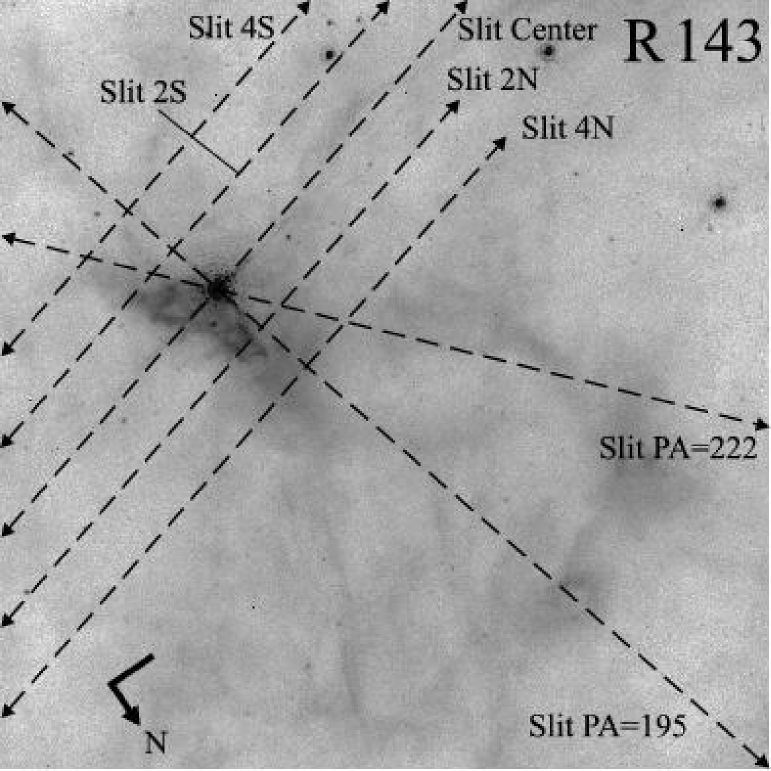
The nebula around R 143 was observed using three different position angles: PA=105°, PA=222° and PA=195°. All slit positions are superimposed on the HST image in Fig. 6.
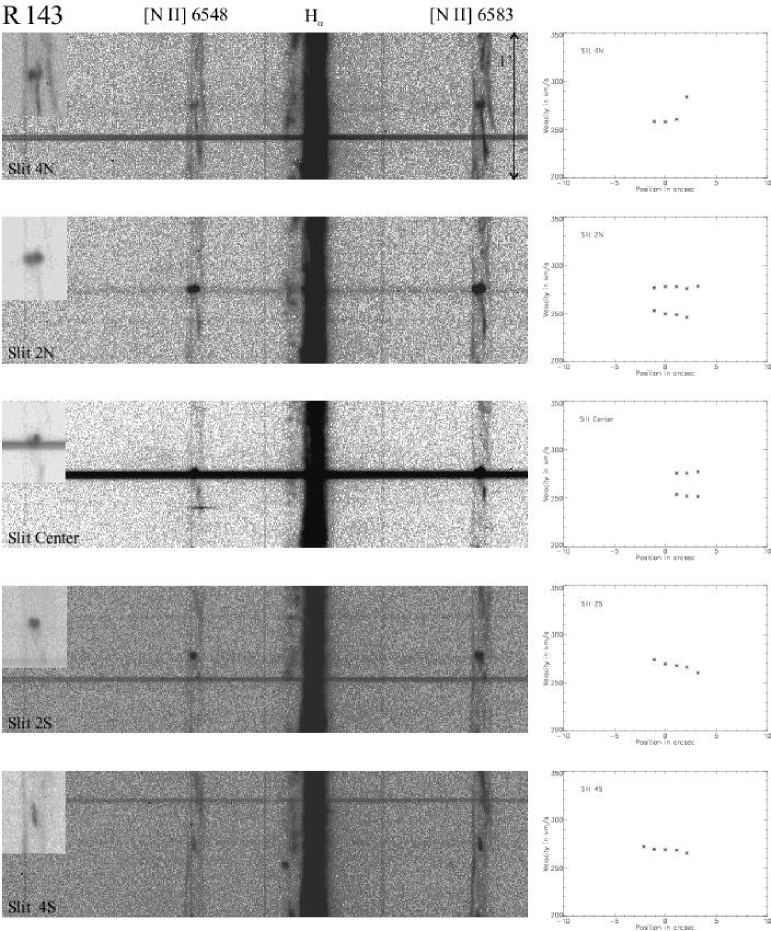
Using high-resolution long-slit Echelle-spectra, we tried to disentangle the emission from the LBV nebula and the background 30 Dor H ii region using kinematic differences and the [N ii]6583Å/Hα ratio—which is expected to be higher in the case of an LBV nebula—as indicators. The echelleograms are shown in Figs. 7 and 8, as well as the corresponding -diagrams. Slit positions PA=195 and Slit PA=222 were used to analyze the kinematics of the longer arc-like structures found by Feast (1961). In Slit 2N, Center, and 2S the inner triangular shaped LBV nebula was intercepted. All the echellograms show a large variety of structures moving with up to 100 km s-1 velocity differences. This is expected for the region around R 143 in the outskirts of the 30 Dor region, which shows a complex expansion structure (Chu & Kennicutt 1994). In Slit Center the slit crosses the star R 143. Slightly to the north-east of the stars continuum emission (upper direction in the echellogram; Fig. 7) a [N ii]-bright knot is visible. The -diagram and the small inset in the echellogram show that this knot has two components, one at about 252 km s-1 and one at 276 km s-1, a velocity difference of 24 km s-1. Analogous results are found in Slit 2N (where the two velocity components are even more obvious) and—though not very prominent—in Slit 4N. Slit 2S shows only one component declining in velocity from 274 km s-1 to 260 km s-1. A similar, nearly constant velocity component is visible in Slit 4S. In all cases, structures with higher velocities are detected, but are not discussed, since they can be attributed to the emission from the 30 Dor complex and would only lead to confusion if plotted in the -diagrams.
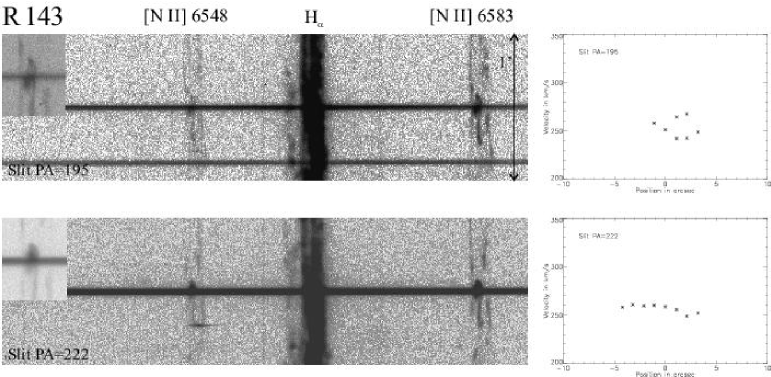
While all the high velocity components in the background emission (not included in the -diagrams) and the measurements of the nebula in Slit 4S showed a lower ratio of 0.05—normal for H ii regions—the measurements in Slit Center, Slit 2S and 2N reach values of the [N ii]6583Å/Hα ratio of typically 0.5 0.05. The maximum we measured is at 0.7 0.05. In Slit 4N the [N ii]6583Å/Hα ratio still reaches up to 0.08. Here due to the seeing, we partly sample the background and LBV nebula, which results in the slightly enhanced value. The Slits PA=195 and PA=222 cross the star as well as Feasts filaments (see Fig. 6). The star can be seen in the center in both echellograms (Fig. 8) and is surrounded by a small oval structure (the actual LBV nebula), which shows at least in Slit PA=195 a two velocity component. To the north (downwards in the echellograms) a longer single velocity structure, slightly bended, appears (central emission feature). These emission features (also seen in Slit PA=222) are identified with the filaments and show no stronger [N ii] emission (see also Smith et al. 1998).
A spectrum extracted from the Echelle spectra of the star itself shows (Fig. 9) similarities with the spectrum of R 127.
3.2.4 Discussion
Our analysis of the HST images and Echelle spectra support the conclusion that Feasts filaments are indeed part of the background H ii region, and that only a roughly triangular shaped high surface brightness nebula close to the star manifests parts of an LBV nebula. This LBV nebula shows two velocity components separated by 24 km s-1. The small size of the nebula makes it hard to identify a clear expansion pattern in the seeing-limited Echelle spectra. Nevertheless, we conclude that the nebula moves with two different velocity components and shows a [N ii]6583Å/Hα ratio higher than that of the background emission and similar to that of other LBV nebulae. The kinematic analysis does not yield other components with higher nitrogen emission, which would be part of the LBV nebula. Smith et al. (1998) find for R 143 a structure that moves with a 130 km s-1 difference from the star, which has, according to them, a radial velocity of 348 km s-1. We find that the peak of the stellar Hα line has a radial velocity of 295 km s-1 and is therefore in better agreement with measurements of the Si ii at 4128 Å, 4131 Å, and Mg ii at 4481 Å by Stahl (private communication), which yield a radial velocity for the star of 285.4 km s-1, 285.9 km s-1 and 287.0 km s-1, respectively. The large difference of the nebula’s and the star’s radial velocity of 130 km s-1 is therefore not supported by our measurements.
The [N ii]6583Å/Hα ratio of the LBV nebula we measure is comparable to the measurements of Smith et al. (1998), with the exception that our maximum ratio is slightly smaller (0.7) than theirs (0.8). The nebula’s shape and one-sided location (with respect to the star) is very unusual and one can only speculate about various scenarios. With R 143 situated in the 30 Dor region, the strong stellar winds, the larger density, and the turbulent motion, which is present in such an H ii region, exhibit ideal conditions for the easy disruption of circumstellar nebulae.
3.3 S 61
3.3.1 Previous work
The star S 61 (or Sk) was classified as an O8:iafpe extr. by Walborn (1977), who noted a similarity of its spectrum with that of R 127. Walborn (1982) puts S 61 in the class of Ofpe/WN9 stars and detected double peaked nebular lines in the spectrum, indicating that S 61 has an expanding circumstellar nebula (line split 38 km s-1). He also noted that nitrogen was times more abundant. Together with the strong spectral similarity to R 127 (LBV, see Sect. 3.1), even though no S Dor-type variability (or eruption) is known for S 61, the star is a good LBV candidate. Wolf et al. (1987) found that the wind velocity of S 61 is km s-1, and derived a . The first observations to resolve the nebula around S 61 were published by Pasquali et al. (1999). The nebula is roughly spherical, being only slightly asymmetric in the center. North of the star (about 12) the nebula is brighter, and the diameter is 73 or 1.8 pc. Spectra taken of the nebula indicate an expansion velocity, derived from line-profile fits, of 28 km s-1. The nebula and stellar parameters are as follows: cm-3, K (Pasquali et al. 1999), K, , M (Pasquali et al. 1997a), while Crowther & Smith (1997) derive K, , M, km s-1.
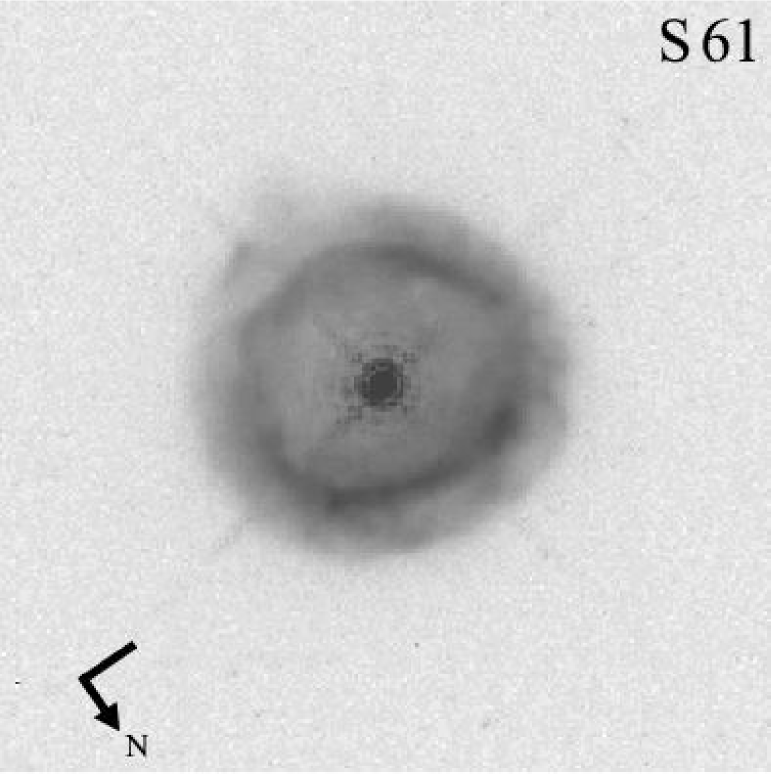
3.3.2 The Morphology from HST images
An HST image in the F656N filter is shown in Fig. 10. The FOV here is 10″ 10″. Previous, ground-based images showed that the nebula around S 61 is predominantly spherical. The new HST image supports this morphology but reveal more details of the shape of the nebula. The nebula consists of an inner brighter ring-like structure and a larger diffuse emission surpassing this ring in all directions. The diameter of the inner ring was measured to be 34 (0.82 pc) at the smallest cross section and 38 (0.89 pc) at the largest . The inner ring is not perfectly round, but small dips can be seen. The surface brightness is not homogeneous and is brightest in a section of the ring to the north. In the ring the surface brightness varies around 3 10-13ergs cm-2 s, while the center of the nebula is fainter with about 1 ergs cm-2 s. To the south and south-west the two largest distortions of the nebula are visible within the ring. Diffuse emission which shows no clear boundary exceeds the inner ring by about 1″ or 0.25 pc. Within this more diffuse emission smaller filaments are visible. These filaments point roughly in a radial direction away from the star. The emission surpassing the ring is slightly lower in surface brightness than the nebula’s center (about 7 ergs cm-2 s).
3.3.3 The kinematics
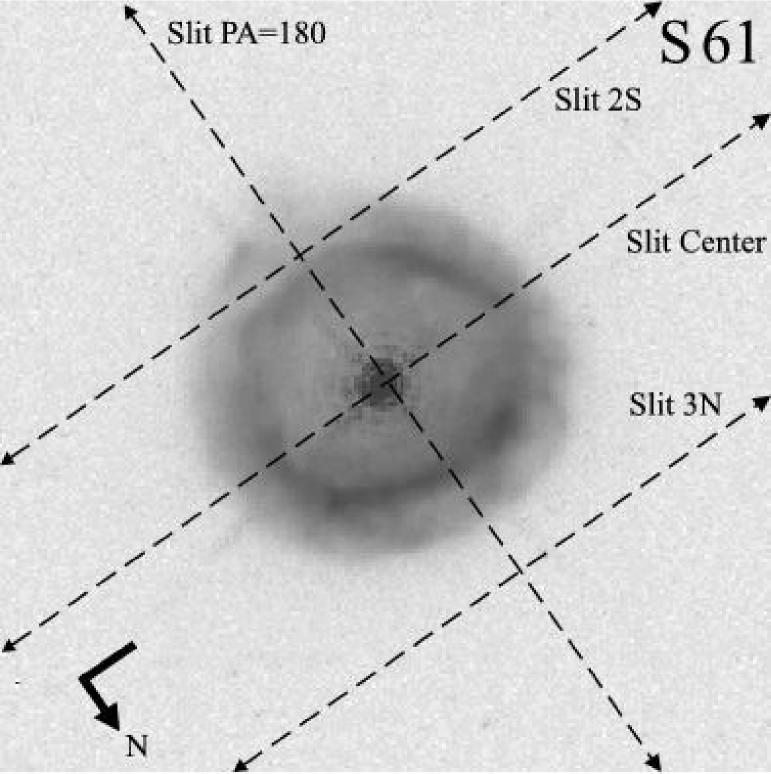
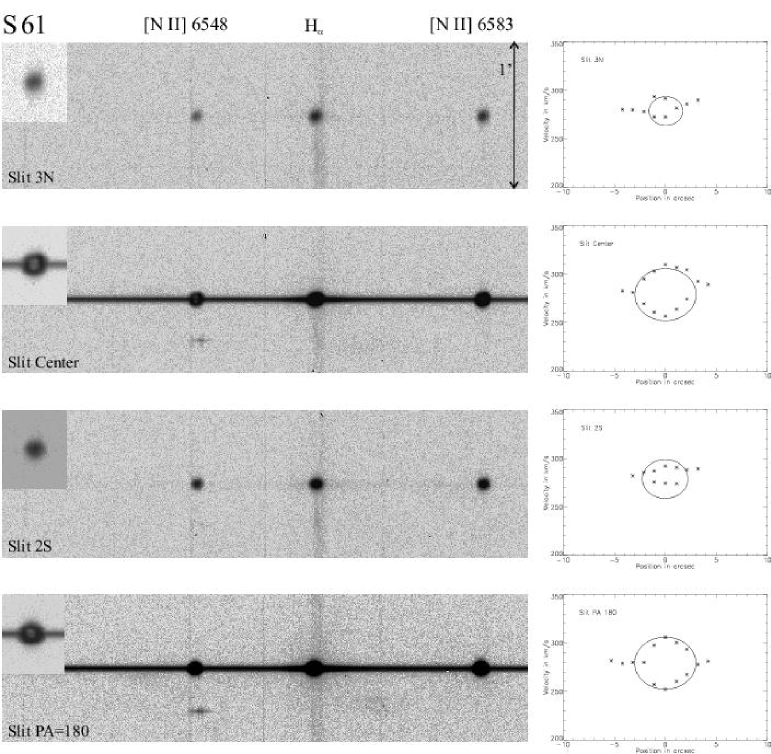
Spectra of S 61 were taken with two different position angles, perpendicular to each other—a PA=90° (east-west, 3 spectra taken) and PA=180°(south-north, one spectra taken). The positions of the spectra are shown in Fig. 11, the echellograms and position velocity diagrams in Fig. 12. Even though Slit 3N is obviously not crossing the nebula, emission is clearly visible in this spectrum. Most likely the seeing of 2″ is responsible for the emission detected at this position. In all echellograms (see Fig. 12) either a line split is present, or an asymmetrical line shape was found, which indicates a nearly spherical expansion of the nebula. The maximum expansion velocity was measured at position 0″ in Slit PA=180 and reaches 26.9 km s-1. As expected, the expansion is much smaller in the Slits 3N and 2S—10.5 km s-1 and 8.9 km s-1, respectively—which occurs because the slit intercepts only a section of the sphere. Therefore, the diameter of the Doppler ellipse, as well as the expansion velocity, is smaller. The shape of the Doppler ellipse of our data in Slit Center is slightly asymmetric with a more redshifted center of expansion at positive offsets (to the west) and a more blueshifted center of expansion at negative offsets. This is illustrated by comparing again the data (asterisks) with the model of a purely sphercial expansion (lines) in the diagrams. Besides this small deviation, the global expansion is in good agreement with a spherical expansion. The small deviation in the expansion ellipse might trace a geometric distortion in the line of slight.
Fig. 13 shows a mixture of an extracted stellar spectrum plus the superimposed emission from the nebula which lies in the line of sight to the star. The split nebular lines are very prominent. The broader wings in the Hα emission most likely show the contribution of the stellar line.
3.3.4 Discussion
The S 61 nebula has the best defined spherical structure among the nebulae discussed so far. The HST image shows a ring-like morphology, disturbed only by small deformations. The same spherical symmetry dominates the expansion pattern of the nebula. The nebula around S 61 nevertheless shows differences from other classical ring nebulae in being completely surrounded by fainter diffuse emission, which extends beyond the inner ring. The seeing in the ground based spectra and the extremely small size of the nebula make it hard to disentangle the emission from the ring and the fainter outer part of the nebula, since both will be observed and sampled in the spectra simultaneously. However, kinematically, the fainter emission can not be very much different from that of the ring, otherwise an additional fainter component should be visible in the spectra with different radial velocity. From the surface brightness determination of the ring and the fainter outer emission in the last section we can estimate that the contribution of the fainter emission is about 23%. Whether this fainter, outer emission is due to an outflow either in all directions or in the direction that is pointed towards the observer (which could form an outflow that expands and is seen projected onto the inner nebula) is not clear. It might equally be the case that the fainter emission was created at the same time as the ring nebula and expands uniformly and according to the sphercial shell. Finally, the outer, faint region of the nebula might be due to an earlier high mass loss episode similar to what is found in Planetary Nebulae (e.g. Balick & Frank 2002).
3.4 S Dor
3.4.1 Previous work
S Doradus (Sk, R 88, HDE 35343) is often considered the most classical or the prototype of the LBV class. Its variability has been known for a long time, and early spectra showed variability, too (Pickering 1897). Numerous studies of its variability have been made, for example by Wesselink (1956), Leitherer et al. (1985), Stahl & Wolf (1982), Wolf & Stahl (1990), van Genderen et al. (1997b), and Wolf & Kaufer (1997). Hubble & Sandage (1953) reported on the brightest variable stars in M31 and M33 and already noted, that S Dor might belong to this group, later known as the Hubble-Sandage variables. Conti (1984) suggested that S Dor type stars—the S Dor variables—, the Hubble-Sandage variables, and the so called P Cygni variables could be combined into one group, now the LBVs. The stellar parameters of S Dor, as measured by Leitherer et al. (1985), are K, , M, and an m taken from Lamers et al. (1998).
Even though S Dor is considered the typical LBV, up to now no nebula around the star has been detected. A larger nebulosity surrounding the star is most likely part of an H ii region or is a faint superbubble. S Dor has been in its minimum phase during the last few years; but it recently showed an F type spectrum (Massey 1999, 2000).
3.4.2 Searching for nebular emission
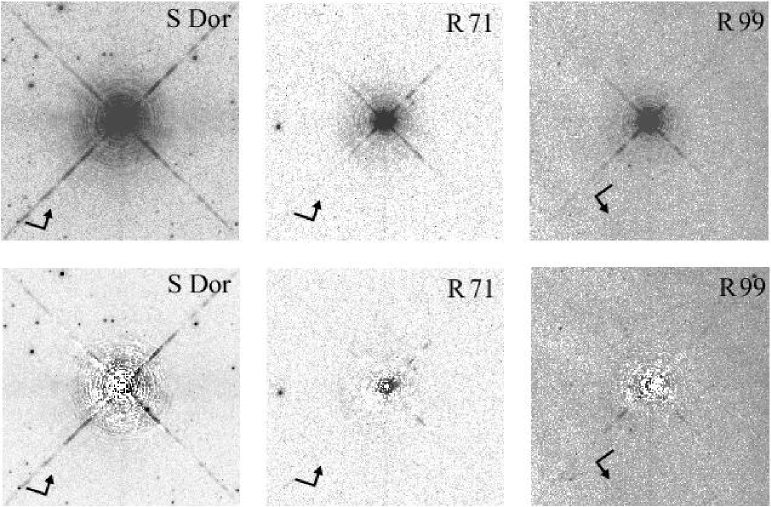
In Fig. 14 the upper left panel shows an HST image (15″ 15″) of S Dor in the F656N filter, with (top image) and without (bottom panel) the central star. In the bottom left image the stellar PSF was subtracted using a PSF generated with Tiny Tim (Krist 1995), to search for nebular emission close to the star. After the PSF subtraction, no nebular emission around S Dor was found. The diffuse emission seen between the two diffraction spikes in the western direction is most likely not real and a result of the scattering light, which produces a ghost image at that point (see WFPC2 Instrument Handbook, chapter 5.9), that could not be modeled with Tiny Tim. This residual emission is visible in all images of Fig. 14 at the same position.
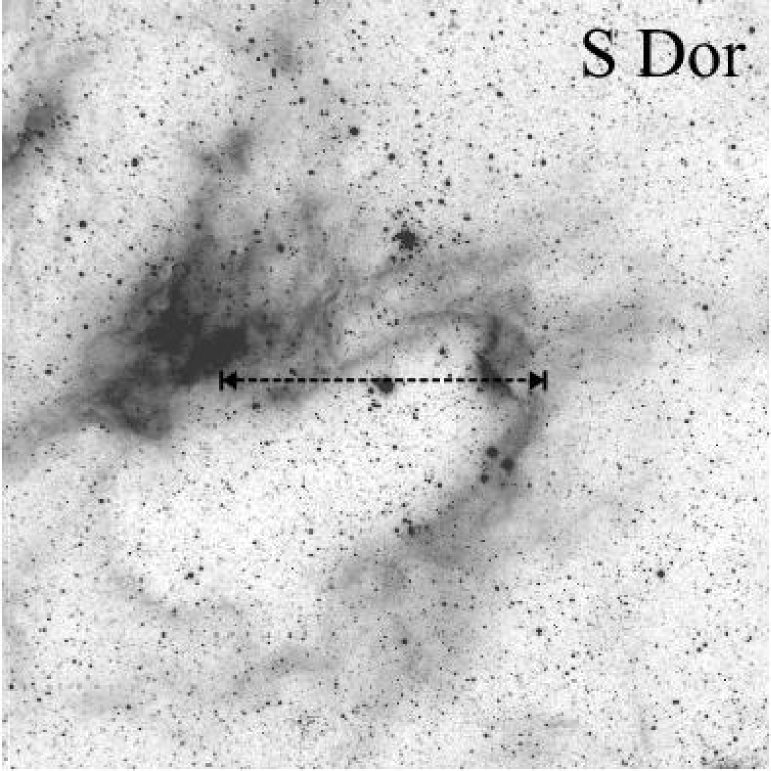
An image from the 0.9 m-telescope (see Fig. 15) was used to study the more distant vicinity of S Dor. A larger, elliptically shaped, ring-like nebula surrounds S Dor with a radius along the long axis of 5′ or about 70 pc. The image shows that this structure is clearly defined, and brighter rims are accompanied by sections of diffuse emission. To the north-east of the ring a brighter Hα (+[N ii]) region is visible. The emission of the ring around S Dor and the more extended Hα (+[N ii]) emission seen in Fig. 15 are part of the LMC H ii region N 119 (or DEM L 132). Whether the ring-like structure around S Dor was created by S Dor or even resembles an LBV nebula is not clear and becomes even more suspicious when comparing the ring with a similar ring structure visible at the north-eastern edge of the image (Fig. 15).
3.4.3 The kinematics
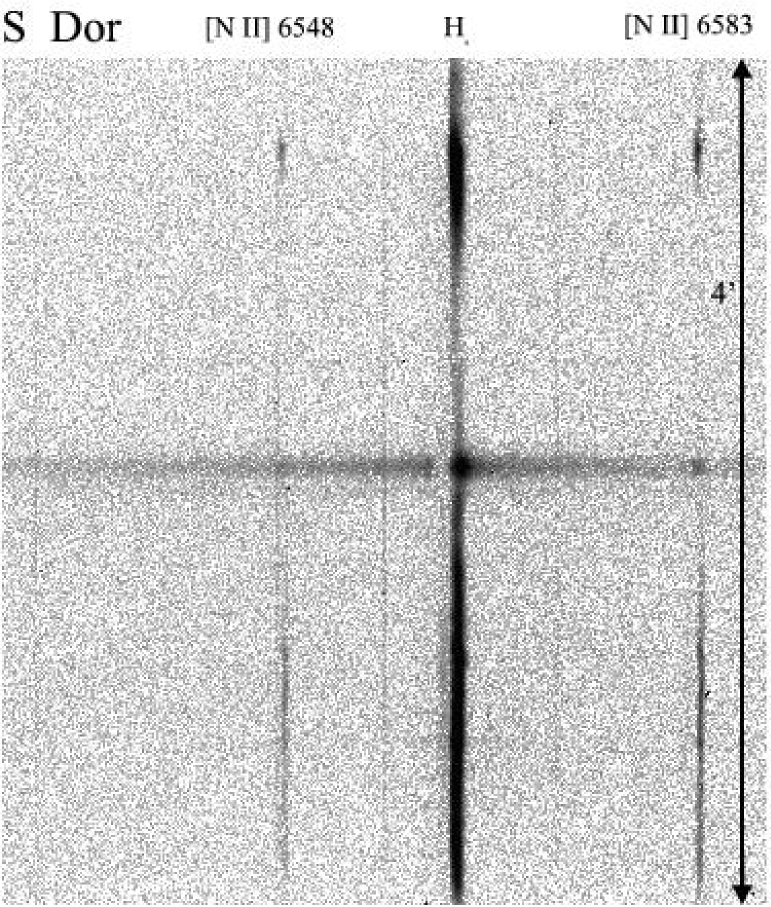
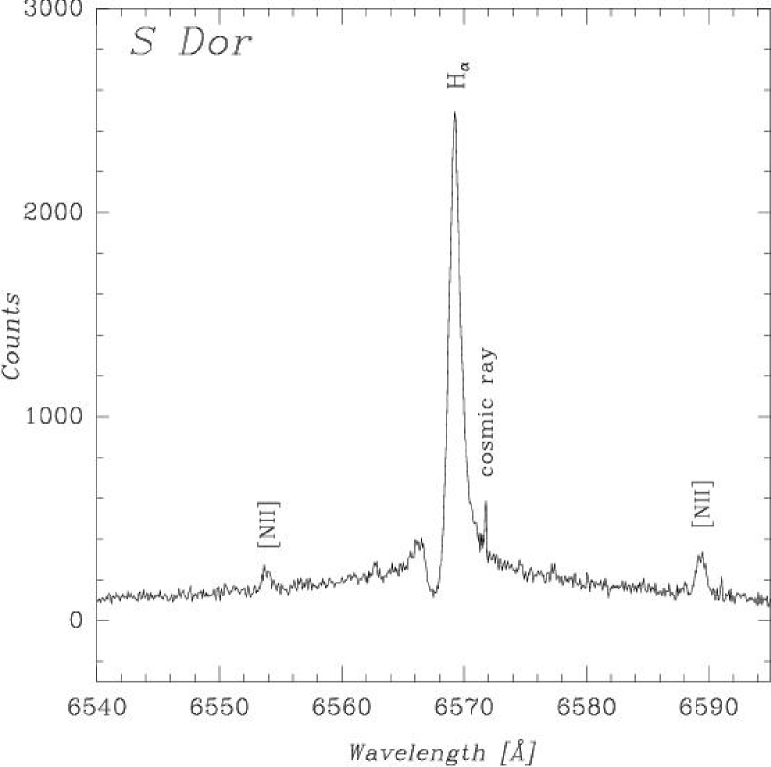
An Echelle spectrum was obtained 3″ north of S Dor, running east-west. The spatial offset was used to avoid excessive stray light and ghost reflections of the grating due to the very bright stellar continnum. With the bright central star and a seeing of 2″, stellar emission is still detected in the spectrum (see Fig. 16) and could be extracted (see Fig. 17). This somewhat noisy stellar spectrum, however, shows the star’s Hα line with a P Cygni profile as well as [N ii] lines. The [N ii] lines are broadended with an FWHM (corrected for the instrumental FWHM) of about 40 km s-1. The [N ii] lines are concentrated on the position of the star (see especially Fig. 16) and are broader than in the background [N ii] lines (FWHM 19 km s-1), which are visible in other parts of the spectrum. Since the 40 km s-1-broadened emission is visible only at the position of the star, they indicate nebular emission very close to S Dor. A determination of the [N ii]6583Å/Hα ratio at the star’s position is not possible since the stellar and nebular Hα emission are superimposed. So far we cannot decide whether or not the detected [N ii] lines indeed manifest a larger [N ii]6583Å/Hα ratio, indicative of an LBV nebula.
The echellogram (Fig. 16) is shown in its full length of 4′ to show the Hα and [N ii] emission of the surrounding medium. While we found no continuous line split in Hα, which would indicate global expansion, the line from the background is also broadened (FWHM km s-1). This value is comparable to the turbulent line broadening of an H ii region (e.g Chu & Kennicutt 1994). Even though no global expansion pattern is visible, a second, blueshifted component in the eastern (lower) part of the spectrum can be identified. While the broad main component of the gas shows emission with a radial velocity of 281 km s-1, this second, fainter component (only detected in Hα) is moving with 237 km s-1 and is therefore about 40 km s-1 slower. This part of the spectrum coincides with the brightest section of the Hα emission, visible to the east in Fig. 15. Most likely several layers of filaments in the H ii region are present here, which move (in part supersonically) with different velocities, as e.g. visible in 30 Dor (see the spectra in the field of R 143 in Fig. 8).
Another indication of the origin of the ring around S Dor is the [N ii]6583Å/Hα ratio. As known from other LBVs, this ratio is higher for LBV nebulae than in normal H ii regions, due to the CNO processed material, assuming that almost no mixing with the ISM has taken place since the formation of the nebula. The [N ii]6583Å/Hα ratio of the ring as measured in the Echelle spectra is 0.06, much lower than that of other LBV nebulae and comparable to other H ii regions in the LMC. If the ring was created by S Dor, it was at least not formed during the LBV phase. The [N ii]6583Å/Hα ratio also makes the interpretation of the 70 pc diameter ring as faint superbubble unlikely, since the typical values are between 0.1 and 0.2 (Hunter 1994), due to the diffuse radiation field (and/or low velocity shocks) in these objects.
3.4.4 Discussion
The HST image of S Dor reveals that, within the limits of these observations, no nebular emission is present close to the star. The broadened [N ii] emission found in our spectrum nevertheless indicate nebular emission very close to and at the star’s position. Therefore, it might be that the nebula is less than about 1″ or 0.25 pc in diameter. This conservative limit results from the PSF subtraction performed on the HST image. Inspecting the residuals in the PSF subtracted image, we believe that any nebula larger than that should be visible. The limit was mainly set by the bleeding of the central star, which prevents a better subtraction of the star’s PSF.
On much larger scales, a ring-like nebula surrounds S Dor and shows a low [N ii]6583Å/Hα ratio. This structure was most likely not formed in the star’s LBV phase. With an expected duration of 25 000 years of the LBV phase (see e.g., Humphreys & Davidson 1994), the kinematic parameters—the dynamical age is 106 yrs—support the arguments that it is not an LBV nebula. Nevertheless, we cannot rule out the possibility that the ring around S Dor was formed by the star’s hot wind during the main sequence phase. Weaver et al. (1977) estimated that stars blow a windblown bubble of comparable size during their main sequence phase. The ring then is a remnant of such a bubble S Dor blew as a hot main sequence star. Whether this ring is a main sequence interstellar bubble from S Dor or formed purely due to (turbulent) motions within the H ii region can not be proven from our observations. An LBV nebula can nevertheless be ruled out due to kinematics—the dynamical age is too large—and the chemical composition—no CNO processed material is present.
3.5 R 71
3.5.1 Previous work
Thackeray (1974) suspected that stars classified Aeq and Beq (similar as S Dor in its minimum phase) might indeed be S Dor type variables, today’s LBVs. The best candidate R 71 (Thackeray 1974; HD 269006, Sk) was classified B2.5iep (Feast et al. 1960) and has a cool expanding shell (Thackeray 1974). Wolf et al. (1981) derived the following parameters K, , in its minimum state, and an 8.53m, rather low for an LBV. For the cool expanding envelope they find a temperature of about 6 000 K. R 71 also shows a strong radiation at 10 m, most likely due to a cool dust shell (Glass 1984), which is supported by IRAS measurements at 12, 25, and 60 m (Wolf & Zickgraf 1986). Modeling the dust shell led to the following values: K, . In the same year, Stahl & Wolf (1986b) detected a broadend, two-component [N ii] nebular line in the spectrum of R 71, indicating a shell. The de-convolution of the line profile into two gaussian, yielded a line split of 39 km s-1, which would correspond to an expansion velocity of about 20 km s-1. Using ESO 3.6 m CASPEC and IUE low resolution spectra, Lennon et al. (1994) re-determined the stellar parameters of R 71 after re-calibrating the extinction curve for LMC mid-B supergiants. Their values for R 71 are: K, , and a much higher, for LBVs more typical 9.9m. Only recently was it found that the dust shell of R 71 contains amorphous as well as crystalline silicate and has a total dust mass of 0.02 M☉ (Voors et al. 1999). Even though R 71 shows the typical light variations for an LBV type star (see van Genderen 1979; van Genderen et al. 1985, 1988; Lamers et al. 1998)—nebular lines and a dust shell—no optical nebula has been detected so far.
3.5.2 Search for nebular emission
An HST image of R 71 in the F656N filter is shown in the upper middle panel of Fig. 14, as well as the same HST image with the PSF subtracted (bottom panel). After the PSF subtraction, no clear indications of an LBV nebula were found. Since bleeding affected the images at the star’s central position, and the PSF model does not include bleeding, residual emission of the star is still visible. Testing our PSF subtraction using differently scaled intensities and radii for the PSF models, it was concluded that a small, point-like emission to the north-west at a distance of 06 from the star might be real but needs to be confirmed. Note that this emission is not the same as the false-emission from scattered light reported above, which is more arc-shaped and further away from the star.
3.5.3 A note on the Echelle spectra
A spectrum (oriented east-west) of the vicinity of R 71 was taken with an offset of 3″ to the north of the star to search for nebular emission and expansion. The spatial offset was done for the same reasons as discussed for the case of S Dor. The spectrum showed no nebular emission at all and is therefore not shown here, and does not need to be discussed any further. Due to the offset, we definitely missed the possible emission knot detected on the HST image.
3.5.4 Discussions
From the measurements on the HST images, as well as our non-detection of emission in the spectrum, it can be concluded that if R 71 has an LBV nebula, it is either extremely faint and below the detection limit of the HST image and in the spectrum, or very small. If its radius is larger than 05, it should be resolved and visible in the HST images where the PSF was subtracted. This limit results again from the reliability of the subtracted PSF. At the LMC distance such a nebula would be smaller than 0.1 pc. A dust shell around R 71 was observed in the IR with a radius of roughly 8000 , which would correspond to 000074 (0.00018 pc) and would therefore, if emitting in Hα, not be visible in the HST images. The detection of a broadened [N ii] emission (Stahl & Wolf 1986b) is indicative of an optical nebula, which would expand with less that 40 km s-1. A detection of a point like Hα emission north-west of the star (on the PSF subtracted image) might be real and could be part of a small nebula around R 71.
3.6 R 99
3.6.1 Previous work
The star R 99 (HD 269445, Sk) was classified as an OBf:pe star (Walborn 1977) with P Cygni profiles in the highest Balmer series members. The low-excitation emission spectrum is similar to that of the galactic LBV stars P Cygni and AG Carinae. An IUE study of LMC stars by Hutchings (1980) shows that R 99 has unusual high reddening and peculiar emission lines. He derived a temperature of K. Walborn (1982) and later Bohannan & Walborn (1989) add R 99 to the list of Ofpe/WN9 stars, a stellar class which includes LBVs in their minimum phase (see Stahl et al. 1983, 1984).
Analysis of R 99 by Walborn (1982) showed (somewhat doubtfully) a very weak nebular [N ii] line at 6583 Å with a line splitting of 61 km s-1. He notes that this line might be due to a circumstellar nebula, but can also be attributed to the surrounding H ii region in which R 99 is embedded. Searching for new LBVs, Stahl et al. (1984) combined a large amount of photometric data to determine variability and the spectral energy distributions of LMC stars. Among them, R 99 was found to show significant color and brightness variations. They derive an extremely high 12.2m. Even though the star shows typical LBV characteristics, the authors note that the amplitude of the star’s variation is small compared to the classical LBVs.
Stahl & Wolf (1987) note that R 99 has a spectral energy distribution similar to HD 37836 and speculate that R 99 might have a disk. Stahl (1987) searched for a nebula around R 99 using ground-based direct imaging and the subtraction of the PSF, without success. Crowther & Smith (1997) again emphasized the peculiarity of the R 99’s spectrum (showing similarity with the peculiar LBV candidate HD 5980 in the SMC) and its high terminal wind velocity of about 1000 km s-1. Using NLTE atmosphere models and combining NIR, HST, IUE, and optical data, Pasquali et al. (1997a, 1997b) obtain the following stellar parameters: K, , and M. R 99’s variability (van Genderen et al. 1998) supports its LBV membership even though it is quite peculiar. They suggest that the small variations (see Stahl et al. 1984) are likely due to a Very Long Term S Dor (VLT SD) phase, which shows only a low amplitude. Van Genderen et al. (1998) suggest a possible second pulsation mode for R 99.
Nota et al. (1996a) report the presence of several nebular lines, superimposed on the stellar spectrum of R 99, such as [O iii], [N ii], and [S ii]. Using the [S ii] line ratio, which levels at about 1.5, the corresponding density lies at around 10-100 cm-3 and is therefore close to/at the low density limit. Their measurements of the Hα line at different positions across the slit identify two major velocity components at 340 km s-1 and 272 km s-1. The latter agrees with the centroid of the star’s Hα line at 271 km s-1.
3.6.2 Searching for nebular emission
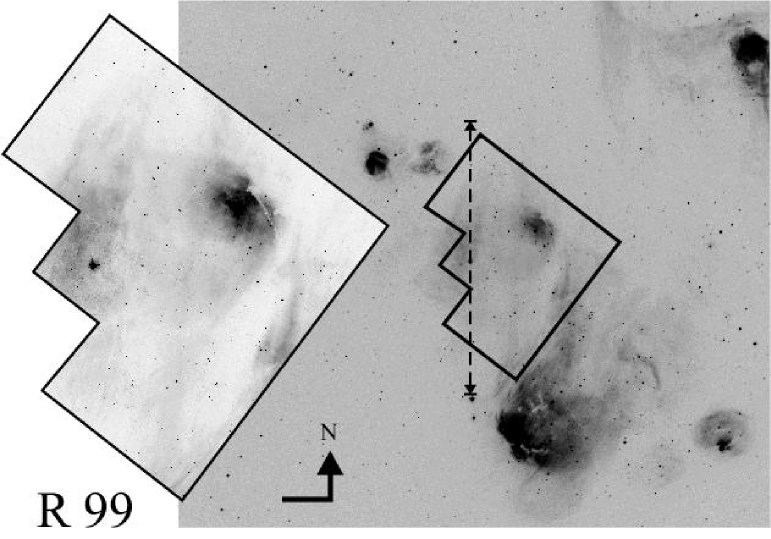
The HST image of the star R 99 as in the lower panels in Fig. 14 after PSF subtraction does not show any evidence of emission from a nearby circumstellar nebula. The image is affected by the same artefacts as those of S Dor and R 71; a ghost image shaped like an arc is visible to the north-west. In Fig. 18 an ESO NTT-EMMI Hα image is displayed showing a 9′ by 8′ region around R 99. In the same image a blow up shows the closer area of R 99 as observed with the HSTs WFPC2 (long edges about 2.6′). Both images show that R 99 is embedded and surrounded by several H ii regions which are identified with the help of the plates and catalog of Davies et al. (1976), see caption in Fig. 18. The images illustrate that most of the emission is due to the H ii regions, and does not show any special centering or connection to R 99 as it would in the case of a circumstellar nebula.
3.6.3 The kinematics
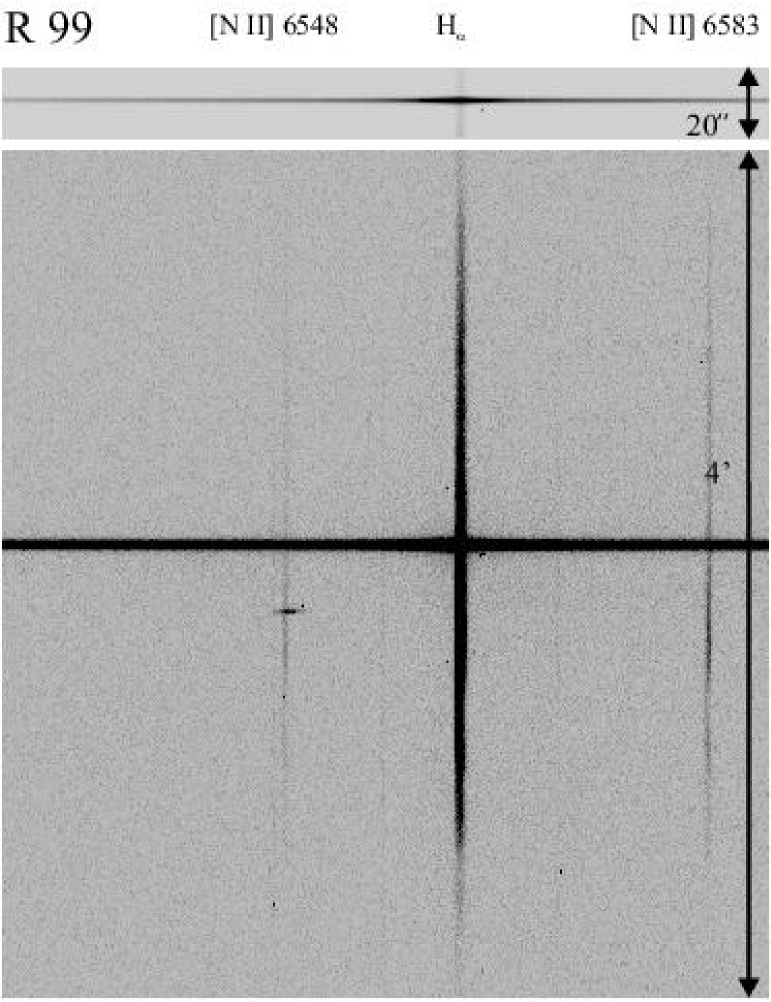
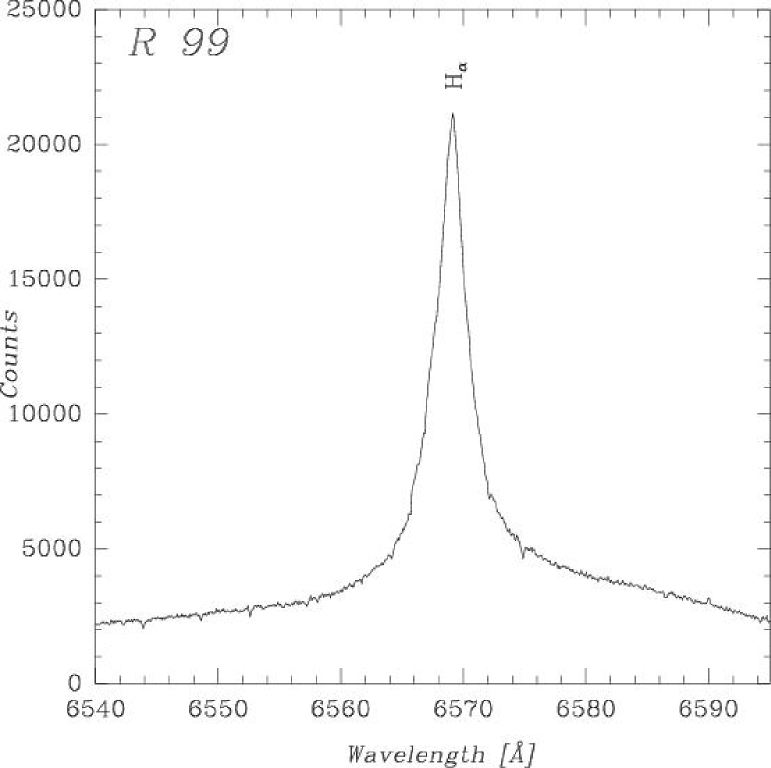
We took one spectrum on the star, with the slit oriented north-south. The position and length of the spectrum is also shown in Fig. 18. The echellogram of the full slit is shown in Fig. 19, at the top of which only the stellar spectrum is displayed again with different intensity levels. This stellar spectrum was extracted and can be seen in Fig. 20. It shows a strong Hα emission with two extended and asymmetric wings. The Hα line has a very broad FWHM of 157 km s-1 and can be best fitted with a Lorentz profile. The Hα emission peak lies at 286.4 km s-1 and therefore differs from the measurents of Nota et al. (1996) by 15 km s-1. This difference can be explained by taking the lower spectral resolution of their spectra into account. Note, also, that taking a rest wavelength of Hα of 6563 Å or 6562.8 Å already makes a difference of nearly 10 km s-1. Hence, we believe that our measurements are not in contradiction but an improvement to the radial velocity of the star. A component with 340 km s-1 as reported by Nota et al. (1996) was not found in our measurements. Clearly, we detect Hα and [N ii] emission across the entire slit. This is of no surprise since we saw that R 99 is embedded in a group of H ii regions. The peak of the Hα line of the background lies at 294.5 km s-1 and is therefore 8.1 km s-1 more redshifted than the star. The FWHM of the lines, corrected for the instrumental FWHM, are 28 km s-1 and 18.5 km s-1 for Hα and [N ii], respectively. The [N ii]6583Å/Hα ratio is about 0.08 0.02 and typical for H ii regions in the LMC. Walborn (1982) speculated whether the faint [N ii] emission in his R 99 spectra was from a very faint background H ii region or a circumstellar nebula. In the same manner Nota et al. (1996) discussed that the emission lines detected in their spectra can be attributed to a nebula around R 99. The Echelle spectra show that [N ii] is present as part of the H ii region. The spectrum of R 99 also shows very faintly (and somewhat doubtful) the [N ii] at 6584 Å (here shifted to 6590 Å). The velocity of this [N ii] line is 294.9 km s-1 and within the errors identical to the radial velocity of the Hα line of the background, and rather than the stellar Hα line. We conclude that the [N ii] line detected in the stellar spectrum is due to the contamination of the spectrum by emission from the background and does not represent a nebula around R 99.
3.6.4 Discussions
While on a larger scale (see EMMI images in Fig. 18 and DEM L catalog, Davies et al. 1976) R 99 is surrounded by nebula emission, we find no hints for a circumstellar nebula. The PSF subtracted HST images in particular lack evidence of nebular emission associated with an LBV type nebula of R 99. Earlier detections of nebular [N ii] emission (Walborn 1982; Nota et al. 1996) can be accounted by the underlying H ii regions—mainly DEM L 160—especially in view of the different centroid radial velocities of the nebular lines with the stellar Hα line. We therefore conclude that the nebular emission detected in spectra of R 99 results from background emission which was acquired at the same time of these observations. The densities derived by Nota et al. (1996) of cm-3 are more typical values for H ii regions and support the suggestion, that the nebular emission is part of the background H ii rather than a circumstellar LBV nebula. If that is the case, the density would generally have higher values (several 102-4 cm-3). The star, however, has an unusally shaped Hα line (asymmetric Lorentz profile) which is quite broad, again supporting its exceptional state in our sample.
3.7 R 84
3.7.1 Previous work
R 84, also known as HD 269227 or Sk 79, was classified as spectral type Oiafpe by Walborn (1977), as he noticed “sharp high-excitation emission”, P Cygni profiles, and strong hydrogen emission. Cowley & Hutchings (1978) and Hutchings (1980) noted that the spectrum of R 84 shows indications for a cool supergiant and concluded that the spectrum is composite with a B0e and an M2 supergiant, showing clear TiO-bands. The conclusion that the spectrum of R 84 is a combination of a luminous late type and a hot early type star led to the idea that R 84 has a companion star. Later R 84 was included in the Ofpe/WN9 sample (see Walborn 1982; Bohannan & Walborn 1989). R 84 showed strong [N ii] nebular lines which according to Walborn (1982) are “quite strong…and although there is no clear velocity structure, they are broader than single, unresolved nebular lines would be”.
Glass (1984) reports a strong IR excess but finds no TiO-bands; he identifies R 84 as a composite Wolf-Rayet star plus late type supergiant. Studies by Stahl et al. (1984) confirm the large IR excess, but note that the (K-L) value is too high to result only from a late-type companion. They propose that a circumstellar dust shell surrounds R 84 and strengthen this argument with the peculiar variation of the shape of the continuum of the star and a variable 2200 Å-feature, which could be due to dust formation. Stahl et al. (1984) derived the following stellar parameters for R 84: K, , and 9.3m. R 84 is accordingly described as an S Dor variable with small amplitude variations.
Further evidence for a circumstellar shell around R 84 came from a broad, most likely non-interstellar Nai D line and the resolved (FWHM = 37 km s-1) [N ii] lines (Stahl & Wolf 1986b). Direct imaging observations to resolve a circumstellar nebula were not successful (see Stahl 1987). Wolf et al. (1987) raised doubts about the fact that the companion star is responsible for the star’s peculiarities, showing that the UV spectra of R 84 is that of an O9.5iab star and quite similar to that of S 61 (see Sect. 3.3). Several atmospheric analyses of R 84 (Schmutz et al. 1991; Crowther et al. 1995; Nota et al. 1996a; Pasquali et al. 1997a) in the few last years derived consistent results for the stellar parameters, also comparable to those mentioned above, but favored different evolutionary scenarios for R 84. Schmutz et al. (1991) proposed that R 84 had gone through a red supergiant phase, Crowther et al. (1995) compared it with the dormant LBV R 71, and Pasquali et al. (1997a) identified R 84 as a quiescent LBV.
A recent analysis with ESO NTT SUSI images and using ADONIS adaptive optics by Heydari-Malayeri et al. (1997) showed that, if a companion star is in the line of sight to R 84 (or a close binary), it must be closer than 012. Van Genderen & Sterken (1999) concluded that R 84 shows no signs of variability and earlier reports of variations might be due to faint field stars in the photometric aperture. They classify R 84 as an ex-/dormant LBV. Obviously, the question of R 84’s evolutionary state and history is not settled yet. We include R 84 in our set of LBV candidates, and discuss the possibility that R 84 is an LBV and whether it is surrounded by a circumstellar shell. No high-resolution or HST images of R 84 are available at this point.
3.7.2 Images
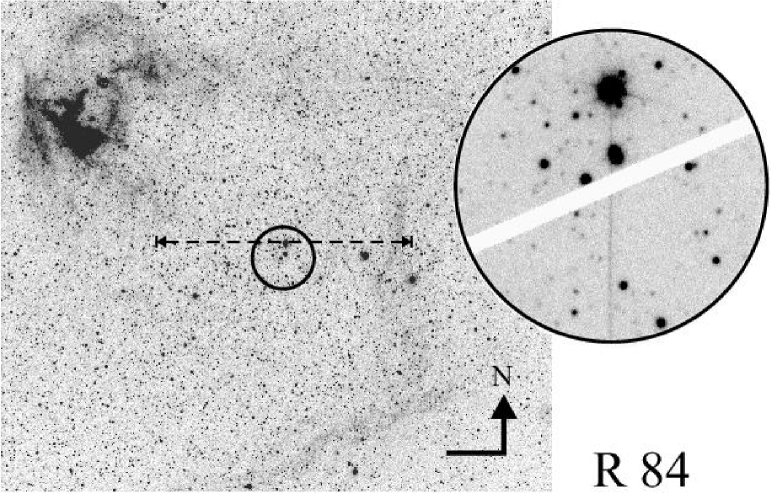
Since no HST images are available, we used ESO NTT-SUSI archive images with a seeing of 075 and inspected these images for possible nebular emission associated with the star. A NTT-SUSI image of R 84 is shown in Fig. 21, together with an image on a larger scale (9 ′ 8′) taken with the NTT-EMMI. In both images an Hα (plus [N ii]) filter was used. The EMMI image (Fig. 21) shows that R 84 is in the vicinity of the H ii region DEM L 113 (Davies et al. 1976), which is partially seen in the upper left corner of the EMMI image. To the west (right) of R 84 very faint Hα filaments are visible, which are part of DEM L 110 and are roughly oriented north-south before they kink to the east. Comparing the EMMI images with the images of the DEM L catalog shows that very faint emission also lies between the the filaments (DEM L 110) and DEM L 113 and would hence be present at the position of R 84. In the ESO SUSI image, which shows an area of about 13 13 pc, no obvious Hα emission was found. R 84, which is the brightest star in the northern part of the image, nevertheless show no perfectly round structure. Some streaks point away from the star, most of them due to diffraction spikes and charge transfer problems (long line streching down).
3.7.3 The kinematics
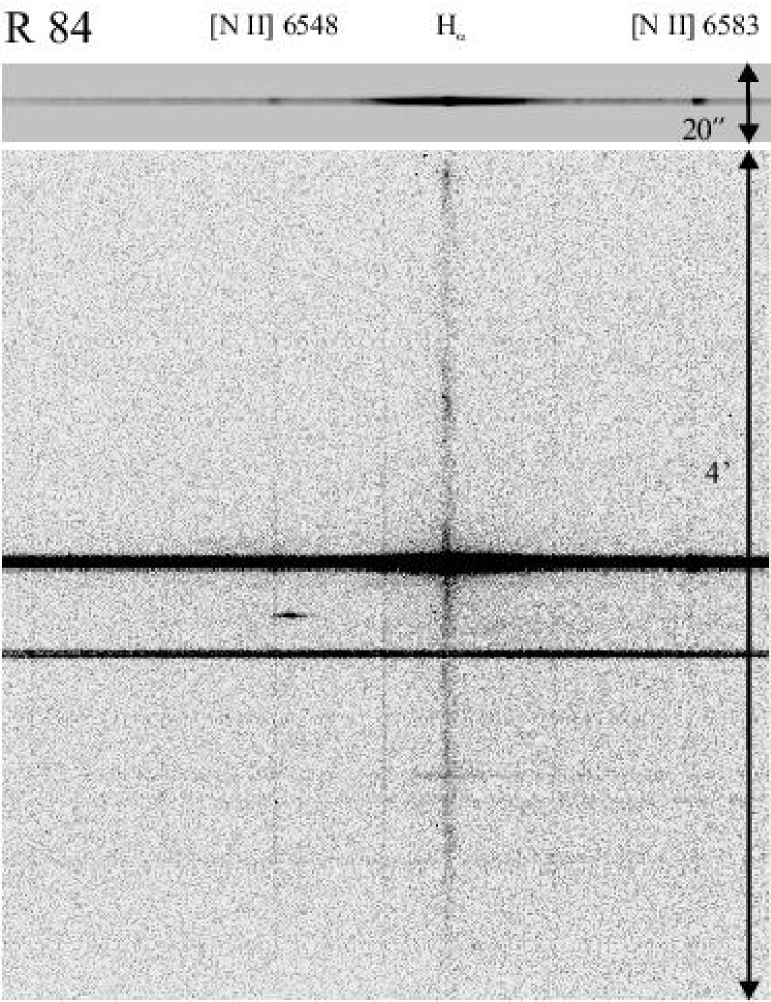
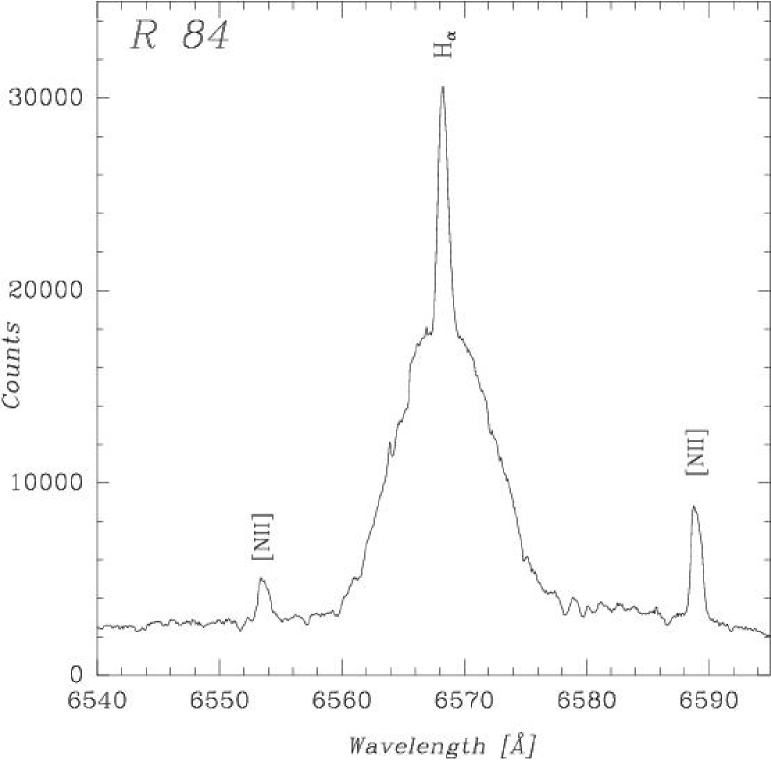
We took one Echelle spectrum centered on the star (see Fig. 22) and one offset by 3″ north, both with an east-west orientation. Since the offset spectrum does not contain any additional information, it is not shown and will not be discussed here. Of the LBV candidates in the LMC, R 84 is the strangest object. In its spectrum the Hα line shows a broad and a narrow component (see extracted spectrum in Fig. 23). The broad component has an FWHM of 435 km s-1. The narrow component is split, as are the [N ii] lines. The peaks of the split have radial velocities of 241 km s-1 and 265 km s-1, and are therefore separated by 24 km s-1 (in agreement with measurements by Stahl & Wolf 1986a). The narrow split Hα line seems superimposed on the broad component. The narrow and broad component can be fitted (and subtracted) with just two gaussians. The split [N ii] emission is quite bright, and if we compare it with the narrow Hα line, we obtain an [N ii]6583Å/Hα ratio of about 0.5 0.1. It is probable that different origins are responsible for the broad and the narrow components. The narrow component most likely results from nebular emission, while the broad component represents Hα emission from the star. The echellogram (see Fig. 22) shows that the nitrogen emission is detected only at the position of the star (compare full spectrum with insert to the top, which contains only the star, but with different brightness cuts). While Hα emission of a faint background H ii region is seen across the entire slit, [N ii] emission is not, or is only barely visible. It is at least much fainter than the [N ii] emission seen superimposed on the star’s continuum. Summing up all the [N ii] emission for a better signal to noise, we obtain an [N ii]6583Å/Hα ratio of 0.1 for the background, much less than the ratio at the star’s position. In the echellogram we can see that the Hα line is slightly brighter closer to the star (up and down in the echellogram, Fig. 22). This brighter region has a diameter of 23″. At the same time, no bright [N ii] is seen, and the [N ii]6583Å/Hα ratio stays the same.
3.7.4 Discussions
We find that bright [N ii] emission is concentrated at the position of the star and supports the presence of a very small circumstellar nebula around R 84 which is not spatially resolved. The size of such a nebula can only be estimated to be smaller than 2″ (about 0.3 pc). This limit is given by the seeing we had in the Echelle observations. The NTT-SUSI image shows some faint protrusions which could be part of a small circumstellar nebula, but the quality of the data precludes a definite statement on details of the nebula structure. The spectrum indicates that the expansion velocity of this nebula is about 12 km s-1, as derived from the separation of the narrow lines. The [N ii]6583Å/Hα ratio is in good agreement with values found for LBV nebulae. Faint nebular emission was also observed above or below the star in the spectrum but shows a much lower [N ii]6583Å/Hα ratio, typical for an H ii region. The broad component in the spectrum of R 84—only visible in Hα—has not been seen in other LBVs and opens questions about whether it is a new spectral feature unique to R 84 or could possibly be related to a binary. The narrow Hα component is most likely from the nebula that also forms the [N ii] lines. The broad Hα component could be the stellar emission broadened due to a very strong stellar wind.
4 Summary of previous results for other LBV candidates in the LMC
Observations and analysis for the two LBV candidates S 119 and Sk have been published earlier in Weis et al. (2003) and Weis & Duschl (2002), respectively. In the following we will briefly summarize these results to put these objects in context with the results of this paper.
Note in this context that we use the term outflow from a nebula in the sense of outflowing material from a disrupted shell. Outflow here is used to describe the gas which flows out of the nebula, it is not used for the stellar wind outflowing from the star.
4.1 S 119
S 119 (Sk 17, HDE 269687) is classified as an Ofpe/WN9 star (Bohannan & Walborn 1989), and the latest determination of the stellar parameters yield K, log L☉, and log M☉yr-1 (Crowther & Smith 1997). Different values are obtained for two different models to take the nebula contamination into account. The terminal wind velocity is 400 km s-1(Pasquali et al. 1997a). Nota et al. (1994) were the first to resolve a 7″ 9″ large nebula (1.9 pc 2.1 pc) associated with S 119. We analysed this nebula (Weis et al. 2003) using HST imaging and 4 m long-slit high-resolution spectra, in the same set-up as descibed in this work. The images show that the nebula is nearly spherical with a diameter of 75 corresponding to 1.8 pc. The shell is brightest in the east. From the south-east toward the north-west part of the nebula several filaments are stretching out, the longest extending 181 beyond the nebula’s shell. Our long slit observations show an expansion of the nebula main shell with a maximum expansion velocity of 25.5 km s-1. Beside the spherical expansion of the central part of the nebula, we showed that—as the filaments in the images indicate—material is streaming out with much higher radial velocity. The highest velocity detected in the outstreaming gas is with 283 km s-1 about 130 km s-1 faster than the center of expansion (with 156 km s-1). The nebula around S 119 is not completely closed and shows outflow. Such an outflow might results, e.g., from Rayleigh-Taylor instabilities in the nebula, density gradients in the ambient medium or the onset of an asymmetric faster stellar wind. Finally, note that the location of S 119 in the disk of the LMC is still under debate since the star’s radial velocity is much slower than expected (Nota et al. 1994; Danforth & Chu 2001; Weis et al. 2003). Hence, the nebula’s size might be different, giving a possibly shorter distance.
4.2 Sk
Sk was recognized as an Hα emission-line star by Bohannan & Epps (1974) and later classified as O9f by Conti et al. (1986). Thompson et al. (1982) derived an effective temperature K, an absolute bolometric magnitude , and a visual one . We found (Weis et al. 1995) that the star Sk is surrounded by a nebula with a diameter of 18″ or 4.5 pc. The nebula expands with roughly 14 km s-1. Several analysis and studies of this object (Weis et al. 1995, 1997b; Weis & Duschl 2002) let us suspect that this object is an LBV candidate due to its brightness, UV spectra (see Smith Neubig & Bruhweiler 1999), and the large nebula, which is especially strong in the [N ii] lines. The [N ii]6583Å/Hα ratio of 0.7 is comparable to those of other LBV nebulae (e.g., AG Car: [N ii]6583Å/Hα 0.5, de Freitas Pacheco et al. 1992). Recently (Weis & Duschl 2002), we detected that Sk also exhibits a large scale outflow similar to that seen in S 119. This outflow is seen as a 71 (1.7 pc) large filament extending to the north of the nebula. The filament moves about 21 km s-1 faster than the center of expansion of the nebula.
5 Summary of this work
From all other stars analyzed here, R 99 was the object that showed the least evidence of a nebula. Neither the PSF subtracted HST images, nor the Echelle spectra show any indications of nebular emission. If an LBV nebula surrounds R 99, it must be at least smaller or much fainter than what we can measure, giving our detection limits. The LBV/LBV candidates R 127, R 143, S 61, S 119, and Sk all show nebulae which are several arcseconds in diameter. We find that R 127’s nebula is fairly spherical with two triangular-like attachments, the caps. The kinematics of the nebula gives hint for bipolarity. In R 143 only a smaller irregularly—nevertheless approximately triangularly—shaped nebula with net-like structures is identified as an LBV nebula. Our spectra show two velocity components, separated by 24 km s-1 associated with this LBV nebula. For S 61, the nebula’s morphology is predominantly spherical (36), with fainter emission that—in projection—surpasses the borders, the global expansion velocity is about 27 km s-1. Analyzing images of S Dor, R 71, and R 84, we found no clear indication for nebular emission. Filamentary, in the case of S Dor even bubble-like emission visible in Hα found close to S Dor and R 84 are part of the H ii regions or diffuse hot gas in the LMC, but are not relics of the stars’ LBV phase. However, note that all these objects, superimposed on the stellar spectrum, show nebula [N ii] lines which are broadened (S Dor) or split (R 71, R 84). These lines are indicative of nebular emission in connection with these stars. The higher line ratio and spatial extend might result from LBV nebulae close to the stars which we can not resolve spatially.
6 General Discussion and Conclusions
In this final section we will compare the parameters of the LMC LBV nebulae studied here with those of the known Galactic LBVs. Therefore, we summarize the morphologic and kinematic parameters of both groups in Table 2. For a detailed description and sources of the parameters, we give examples of the most recent literature which, however, is far from complete. In Table 2 we quote the size, expansion velocity, and morphology of the nebulae. In some cases, where no clear expansion ellipse could be traced, not the expansion velocity but the line split is given, which is marked with (split). For S Dor the line was not split, so the FWHM is given instead.
6.1 Morphology and Nebula Sizes
The different morphologies and sizes of nebulae around LBVs and LBV candidates in the LMC are particularly conspicuous. The nebulae are spherical, bipolar, irregular, or show outflow. Also, they appear to be grouped into two different size classes. Either they are quite large (1 pc or larger) or they are very small (upper limit from the resolution of our data 0.3 pc). Of course, we have to keep in mind that selection effects play an important role. In the LMC we predominantly detect the largest nebulae since those smaller than about 0.5 pc correspond to an apparent size of about 2″ in the LMC and are therefore much harder to find in surveys, for instance. This is especially the case for stars which are not identified as LBVs so far because they are in a dormant state. The LBV nebulae in the LMC are in general about the same sizes (perhaps slightly larger) as those in our Galaxy. From all nebulae which have been resolved so far this shows that they cover sizes between 0.15 (HD 168625) and 4.5 pc (Sk). Taking again all resolved nebulae into account, we can estimate an average size for LBV nebulae of 1.25 pc.
LBV nebulae in the Galaxy and the LMC come in the same variations of morphologies. In particular bipolarity—at least to some degree—in LBV nebulae is present in nebulae in both galaxies. Interestingly, we find that bipolarity is found in nebulae of very different sizes. A bipolar nebula par excellence is seen in the Homunculus around Car, but also larger nebulae like those around HR Car and R 127 in the LMC have bipolar components. Conclusively, bipolarity is neither restricted to size, nor connected to the host galaxy (or as a consequence: metalicity).
| LBV | host galaxy | size | morphology | references | |
|---|---|---|---|---|---|
| [pc] | [km s-1] | ||||
| Carinae | Milky Way | 0.2/0.67 | 600/ | bipolar | Weis (2001); Weis et al. (2001) |
| HR Carinae | Milky Way | 1.3 0.65 | bipolar | Weis et al. (1997a); Nota et al. (1997) | |
| P Cygni | Milky Way | 0.2/0.8 | /185 | spherical | Meaburn et al. (1996) |
| AG Carinae | Milky Way | 0.87 1.16 | 70 | bipolar ? | Nota et al. (1992) |
| WRA 751 | Milky Way | 0.5 | 26 | bipolar | Weis (2000) |
| He 3-519 | Milky Way | 2.1 | 61 | spherical | Smith et al. (1994) |
| HD 168625 | Milky Way | 0.13 0.17 | 40 | spherical ? | Nota et al. (1996b) |
| Pistol Star | Milky Way | 0.8 1.2 | 60 | spherical | Figer et al. (1999) |
| R127 | LMC | 1.3 | 32 | bipolar | this work |
| R143 | LMC | 1.2 | 24 (split) | irregular | this work |
| S61 | LMC | 0.82 | 27 | spherical | this work |
| S Dor | LMC | ? | (FWHM) | ? | this work |
| R 71 | LMC | ? | 20 | ? | Stahl & Wolf (1986b) |
| R 99 | LMC | background | background | — | this work |
| R 84 | LMC | ? | 24 (split) | ? | this work |
| S119 | LMC ? | 1.8 | 26 | spherical/outflow | Weis et al. (2003) |
| Sk279 | LMC | 4.5 | 14 | spherical/outflow | Weis & Duschl (2002) |
6.2 Expansion velocities
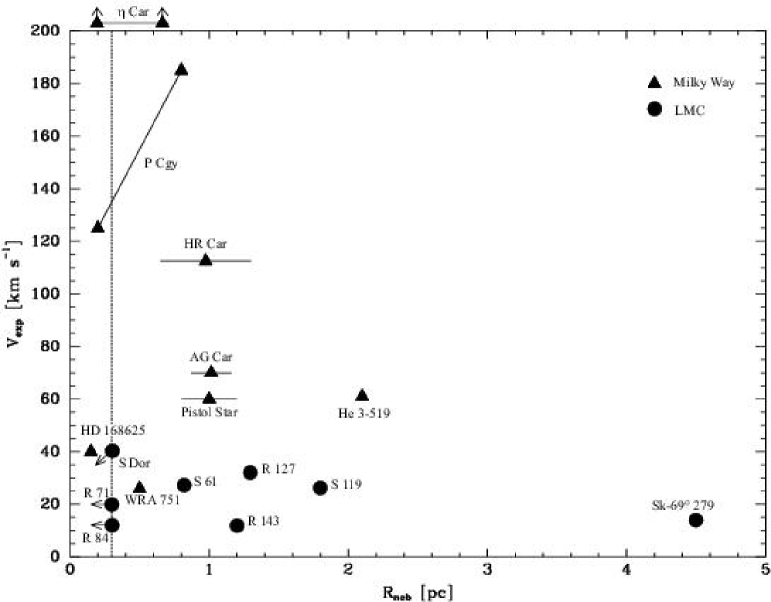
While the sizes are about the same for LBV nebulae, the expansion velocities are significantly different. Looking at nebulae in our Galaxy, it seems at first glance the larger a nebula, the lower its expansion (Fig. 24). This can manifest some kind of evolution—in connection to a slow-down process—of LBV nebulae. As argued in Weis et al. (1997a) and Weis (2001), HR Car does show signs of being an aged, slowed down version of Car’s nebula. We would expect that larger nebulae are older since they had more time to expand, but at the same time the expansion will have slowed them down. However, this scenario of larger nebulae being slower completely breaks down for the nebulae in the LMC. First, we note that all LBV nebulae in the LMC are expanding much more slowly than those in the Milky Way. In the LMC none is moving faster than 32 km s-1—in the Milky Way the expansion velocities are up to an order of magnitudes higher. The slowest LBV nebula in the Milky Way is about as fast as the fastest LMC nebula. As a consequence, the spread in expansion velocity of nebulae in the LMC is much smaller than in the Galaxy. While we find velocities between 26 km s-1 and several 1000 km s-1 in the Galaxy, the LMC LBVs range from only 12 to 32 km s-1. The expansion velocities of LBV nebulae in the LMC are confined to a small range. From the presently known sample we conclude that there is a significant difference in the expansion velocities between the nebulae in the LMC and the Milky Way. Even if we exclude Car at that point, given its recent outburst and exceptional status, this statement holds true. Note in this context, that detecting higher expansion velocities in nebulae around LBVs in the LMC is not a problem. Even if we are not resolving the nebulae, the high expansion velocity will be visible in spectra which include the [N ii], which will be broadend, splitted or at least be shifted against the stellar radial velocity.
So what determines the expansion velocities of LBV nebulae, and why are they so different between the LMC and the Milky Way? A lot of different stellar and environmental processes possibly affect the expansion velocities, only the most obvious of which we will discuss in the following. Most likely, however, a mixture of the various processes will occur.
-
•
Stellar winds: The mass loss history and change of wind velocity during the LBV phase is a function of the star’s initial mass, for instance. The formation of an LBV nebula is thought to occur due to wind-wind interaction, as proposed in, e.g., García-Segura et al. (1996). If, now, the input for wind velocity and mass loss is different, the expansion velocity of the nebulae will naturally differ due to the solution of the wind-wind interaction models. The expansion velocities will also change, if the duration of the LBV phase (or more precisely the phase of slow wind) is different, since then the interaction time of fast and slow wind will also change. Since we suspect that stellar wind influences the expansion velocities of the LBV nebulae, all effects that determine the wind velocity will automatically also influence our expansion velocities. In this context we will only briefly discuss one process that changes the stellar wind velocity, namely metallicity or more general abundances, since e.g. rotation might change the abundance in the outer layers of the stars. If we have stars with lower metallicity/abundances—such as in the LMC objects—they generally have slower wind velocities, at least in their main-sequence phase. Nothing is known so far about the wind velocity of stars in the LBV phase with lower metallicity/abundances. Therefore, different abundances—initially or, e.g., due to mixing from rotation—will also influence the expansion velocities.
-
•
Eruptions: For some LBVs (e.g. Car, P Cyg) we know that they underwent a giant eruption, and at least parts of the nebulae were created in these outbursts. Whether or not all LBVs had such an outburst is not known (due to the lack of historical records). Therefore, the expansion velocities of the nebulae might be different since some resulted from outburst while outer nebulae formed through interaction. If we assume that all LBV nebulae were created in outbursts, then their outbursts can easily have a different strength and duration, which would also result in a variety of expansion velocities. Since we do not know what the underlying mechanism of the giant eruption is, this process could be highly dependent on metallicity and then explain why LMC LBVs expand so much more slowly.
-
•
Environment: Whatever created the nebulae, wind or eruption, the surrounding ISM will also have an impact on the expanding nebulae. Density and temperature of the environment that harbors the LBVs will have a noticeable influence on the nebulae. By sweeping up ISM, the nebulae will slow down and start mixing. Instabilities will occur (e.g., Rayleigh-Taylor, Kelvin-Helmholtz) that can lead as far as to the final disruption of the nebula and possible outflows as seen in, e.g., S 119. So far, the closer environment in which the LBVs are situated has barely been studied, so that nothing is known about its influence on the LBV nebulae.
Some of the above mentioned parameters—perhaps all—are responsible for the different expansion velocities of the LBVs in the LMC and the Milky Way. As a natural consequence a comparison of the nebula with stellar parameters would be made. For a specific reason this comparison has explicitly been awoided. LBVs do change their stellar parameters significantly in timescales as short as some years. Therefore, a simple comparison of stellar parameters of LBVs with each other and with the nebula parameters would lead to invalid conclusions. The stellar parameters, especially the wind velocity, were different at the time the nebulae formed. Comparing the stellar wind, as detected in the current spectra, would not help to pin down the different properties of the nebulae in the LMC and the Milky Way.
LBV nebulae in the LMC are similar in shape and size to those in the Milky Way, but their expansion velocities are different. Nebulae are either formed in giant eruptions or due to wind-wind interaction. We conclude that the formation of LBV nebulae seem similar for each nebula, but must occur with different strengths to account for the different velocities. At least to some degree, metallicity seems to play a role in the formation of LBV nebulae as the different expansion velocities of LMC and Galactic nebulae indicate.
Acknowledgements.
Special thanks go to Dominik J. Bomans (Bochum) for his great help and endless efforts in this work and his supporting discussions on the subject. I am grateful to Wolfgang J. Duschl (Heidelberg) who help considerably to improve the manuscript and to Roberta M. Humphreys (Minnesota), and Kris Davidson (Minnesota), who supported this work with their input. I am obliged to Otmar Stahl for proving independent radial velocity measurements for R 143. I thank the referee for helpful comments and suggestions. Partly based on observations made with the European Southern Observatory telescopes obtained from the ESO/ST-ECF Science Archive Facility. Based partly on observations made with the NASA/ESA Hubble Space Telescope, obtained from the data archive at the Space Telescope Institute. STScI is operated by the association of Universities for Research in Astronomy, Inc. under the NASA contract NAS 5-26555. This work was partially supported by the DFG through grant Du 168/8-1. The data reduction and analysis was in part carried out on a workstation provided by the Alfried Krupp von Bohlen und Halbach Stiftung.References
- (1) Appenzeller I., Wolf B., & Stahl O., 1987, in Instabilities in Luminous Early Type Stars, eds.: H.J.G.L.M. Lamers, C.W.H. de Loore, 241
- (2) Balick, B., & Frank, A. 2002, ARAA, 40, 439
- (3) Bohannan, B., & Epps, H.W. 1974, A&AS, 18, 47
- (4) Bohannan, B., & Walborn, N.R. 1989, PASP, 101, 520
- (5) Chu, Y.-H., & Kennicutt, R.C. 1994, ApJ, 425, 720
- (6) Clampin, M., Nota, A., Golimowski, D.A., Leitherer, C., & Durrance, S.T. 1993, ApJL, 410, 35
- (7) Crowley, A.P., & Hutchings, J.B. 1978, PASP, 90, 636
- (8) Crowther, P.A., & Smith, L.J. 1997, A&A, 320, 500
- (9) Crowther, P.A., Hillier, D.J., & Smith, L.J. 1995, A&A, 293, 172
- (10) Conti, P.S. 1984, in IAU Symp. 105, Observational Tests of Stellar Evolution Theory, eds.: A. Maeder, & A. Renzini, (Dordrecht, Holland: Kluwer), 233
- (11) Conti, P.S., Garmany, C.D., & Massey, P. 1986, AJ, 92, 48
- (12) Danforth, C.W., & Chu, Y.-H. 2001, ApJL, 552, 155
- (13) Davidson, K., & Humphreys, R.M. 1997, ARA&A, 35, 1
- (14) Davies, R.D., Elliott, K.H., & Meaburn, J. 1976, MNRAS, 81, 89
- (15) Feast, M.W. 1961, MNRAS, 122, 1
- (16) Feast, M.W., Thackeray, A.D., & Wesselink, A.J. 1960, MNRAS, 121, 25
- (17) Figer, D.F., Morris, M., Geballe, T.R. et al. 1999, ApJ, 525, 759
- (18) de Freitas Pacheco, J.A., Damineli Neto, A., Costa, R.D.D., & Viotti, R. 1992, A&A, 266, 360
- (19) García-Segura G., Mac Low M.-M., & Langer N., 1996, A&A 305, 229
- (20) Glass, I.S. 1984, MNRAS, 209, 759
- (21) Hunter, D.A. 1994, AJ, 107, 565
- (22) Heydari-Malayeri, M., Courbin, F., Rauw, G., Esslinger, O., & Magain, P. 1997, A&A, 326, 143
- (23) Hubble, E., & Sandage, A. 1953, ApJ, 118, 353
- (24) Humphreys, R.M., & Davidson, K. 1979, ApJ, 232, 409
- (25) Humphreys, R.M., & Davidson, K. 1994, PASP, 106, 1025
- (26) Hutchings, J.B. 1980, ApJ, 237, 285
- (27) Krist, J. 1995, ASP Conf. Ser. 77: Astronomical Data Analysis Software and Systems IV, 4, 349
- (28) Kov acs, G., A&A, 2000, 363, L1
- (29) Lamers, H.J.G.L.M., Bastiaanse, M.V., Aerts, C., & Spoon, H.W.W. 1998, A&A, 335, 605
- (30) Langer, N., Hamann, W.-R., Lennon, M. et al. 1994, A&A, 290, 819
- (31) Leitherer, C., Appenzeller, I., Klare, G. et al. 1985, A&A, 153, 168
- (32) Lennon, D.J., Wobig, D., Kudritzki, R.-P., & Stahl, O. 1994, SpSR, 66, 207
- (33) Massey, P. 1999, IAU Circ., 7290, 1
- (34) Massey, P. 2000, PASP, 112, 144
- (35) Meaburn, J., L opez, J.A., Barlow, M.J., & Drew, J.E. 1996, MNRAS, 283, L69
- (36) Nota, A., Leitherer, C., Clampin, M., Greenfield, P., & Golimowski, D.A. 1992, ApJ, 398, 621
- (37) Nota, A., Drissen, L., Clampin, M. et al. 1994, in: Circumstellar Media in the Late Stages of Stellar Evolution, eds. R.E.S. Clegg, I.R. Stevens, & W.P.S. Meikle, Cambridge University Press, Cambridge, UK, 89
- (38) Nota, A., Livio, M., Clampin, M., & Schulte-Ladbeck, R. 1995, ApJ, 448, 788
- (39) Nota, A., Pasquali, A., Drissen, L. et al. 1996a, ApJS, 102, 383
- (40) Nota, A., Pasquali, A., Clampin, M. et al. 1996b, ApJ, 473, 946
- (41) Panagia, N., Gilmozzi, R., Machetto, F., Adorf, H.M., & Kirshner, R.P., 1991, ApJ, 380, L23
- (42) Parker, J.Wm. 1992, Ph.D. thesis, University Colorado
- (43) Parker, J.Wm., Clayton, G.C., Winge, C., & Conti, P.S. 1993, ApJ, 409, 770
- (44) Pasquali, A., Nota, A., & Clampin, M. 1999, A&A, 343, 536
- (45) Pasquali, A., Langer, N., Schmutz, W. et al. 1997a, ApJ, 478, 340
- (46) Pasquali, A., Schmutz, W., Nota, A., & Origlia, L. 1997b, A&A, 327, 265
- (47) Pickering, E.C. 1897, ApJ, 6, 459
- (48) Rohlfs, K., Kreitschmann, J., Siegman, B.C., & Feitzinger, J.V. 1984, A&A, 137, 343
- (49) Schmutz, W., Leitherer, C., Hubeny, I. et al. 1991, ApJ, 372, 664
- (50) Schulte-Ladbeck, R.E., Leitherer, C., Clayton, G.C. et al. 1993, ApJ, 407, 723
- (51) Smith, L.J., Crowther, P.A., & Prinja, R.K. 1994, A&A, 281, 833
- (52) Smith, L.J., Nota, A., Pasquali, A. et al. 1998, ApJ, 502, 278
- (53) Smith Neubig, M.M., & Bruhweiler, F.C. 1999, AJ, 117, 2856
- (54) Stahl, O. 1985, ESO Messenger, 39, 13
- (55) Stahl, O. 1987, A&A, 182, 229
- (56) Stahl, O., & Wolf, B. 1982, A&A, 110, 272
- (57) Stahl, O., & Wolf, B. 1986a, A&A, 154, 243
- (58) Stahl, O., & Wolf, B. 1986b, A&A, 158, 371
- (59) Stahl, O., & Wolf, B. 1987, A&A, 181, 293
- (60) Stahl, O., Wolf, B., Klare, G. et al. 1983, A&A, 127, 49
- (61) Stahl, O., Wolf, B., Leitherer, C. et al. 1984, A&A, 140, 459
- (62) Thackeray, A.D. 1974, MNRAS, 168, 221
- (63) van Dokkum, P.G. 2001, PASP, 113, 1420
- (64) van Genderen, A.M. 1979, A&AS, 38, 151
- (65) van Genderen, A.M., Steemers, W.J.G., Feldbrugge, P.T.M. et al. 1985, A&A, 153, 163
- (66) van Genderen, A.M., Thé, P.S., Augusteijn, Th. et al. 1988, A&AS, 74, 453
- (67) van Genderen, A.M., de Groot, M., & Sterken, C. 1997a, A&AS, 124, 517
- (68) van Genderen, A.M., Sterken, C., & de Groot, M. 1997b, A&A, 318, 81
- (69) van Genderen, A.M., Sterken, C., de Groot, M., & Reijns, R.A. 1998, A&A, 332, 857
- (70) van Genderen, A.M., & Sterken, C. 1999, A&A, 349, 537
- (71) Voors, R.H.M., Waters, L.B.F.M., Morris, P.W. et al. 1999, A&A, 341, L67
- (72) Walborn, N.R. 1977, ApJ, 215, 53
- (73) Walborn, N.R. 1982, ApJ, 256, 452
- (74) Weis, K. 2000, A&A, 357, 938
- (75) Weis, K. 2001, Reviews in Modern Astronomy 14, ed.: Schielicke R.E., Springer-Verlag, 261, and astro-ph/0104214
- (76) Weis, K., & Duschl, W.J. 2002, A&A, 393, 503
- (77) Weis, K., Bomans, D.J., Chu, Y.-H., Joner, M.D. & Smith, R.C. 1995, RevMexAstron.SdC, 3, 237
- (78) Weis, K., Duschl, W.J., Bomans, D.J., Chu, Y.-H., & Joner, M.D., 1997a, A&A, 320, 568
- (79) Weis, K., Chu, Y.-H., Duschl, W.J., & Bomans, D.J. 1997b, A&A, 325, 1157
- (80) Weis, K., Duschl, W.J., & Bomans, D.J. 2001, A&A, 367, 566
- (81) Weis, K., Duschl, W.J., & Bomans, D.J. 2003, A&A, 398, 1041
- (82) Wesselink, A.J. 1956, MNRAS, 116, 3
- (83) Wolf, B. 1992, Reviews in Modern Astronomy 5, eds.: Klare G., Springer-Verlag, 1
- (84) Wolf, B., Appenzeller, I., & Stahl, O. 1981, A&A, 103, 94
- (85) Wolf, B., & Zickgraf, F.-J., 1986, A&A, 164, 435
- (86) Wolf, B., Stahl, O., & Seifert, W. 1987, A&A, 186, 182
- (87) Wolf, B., & Stahl, O. 1990, A&A, 235, 340
- (88) Wolf, B., & Kaufer, A. 1997, in ASP Conf. Ser. 120, eds.: A. Nota, H.J.G.L.M. Lamers, 26
- (89) Westerlund, B.E., A&AR, 2, 29