Deep Hubble Space Telescope Imaging of IC 1613 II. The Star Formation History111Based on observations with the NASA/ESA Hubble Space Telescope, obtained at the Space Telescope Science Institute, which is operated by the association of Universities for Research in Astronomy, Inc., under NASA contract NAS 5-26555. These observations are associated with proposal ID 7496.
Abstract
We have taken deep images of an outlying field in the Local Group dwarf irregular galaxy IC 1613 with the WFPC2 aboard the Hubble Space Telescope in the standard broad-band F555W (V, 8 orbits) and F814W (I, 16 orbits) filters. The photometry reaches to V 27.7 (MV 3.4) and I 27.1 (MI 2.8) at the 50% completeness level, the deepest to date for an isolated dwarf irregular galaxy. We analyze the resulting color-magnitude diagram (CMD) and compare it with CMDs created from theoretical stellar models using three different methods to derive a star formation history (SFH) as well as constrain the chemical evolution for IC 1613. All three methods find an enhanced star formation rate (SFR), at roughly the same magnitude (factor of 3), over roughly the same period (from 3 to 6 Gyr ago). Additionally, all three methods were driven to similar age-metallicity relationships (AMR) which show an increase from [Fe/H] 1.3 at earliest times to [Fe/H] 0.7 at present. Good agreement is found between the AMR which is derived from the CMD analysis and that which can be inferred from the derived SFH at all but the earliest ages. The agreement between the three models and the self-consistency of the derived chemical enrichment history support the reality of the derived SFH of IC 1613 and, more generally, are supportive of the practice of constructing galaxy SFHs from CMDs.
A comparison of the newly observed outer field with an earlier studied central field of IC 1613 shows that the SFR in the outer field has been significantly depressed during the last Gyr. This implies that the optical scale length of the galaxy has been decreasing with time and that comparison of galaxies at intermediate redshift with present day galaxies should take this effect into account. Comparing the CMD of the outer field of IC 1613 with CMDs of Milky Way dSph companions, we find strong similarities between IC 1613 and the more distant dSph companions (Carina, Fornax, Leo I, and Leo II) in that all are dominated by star formation at intermediate ages. In particular, the SFH and AMR for IC 1613 and Leo I are indistinguishable. This implies that dIrr galaxies cannot be distinguished from dSphs by their intermediate age stellar populations. This type of a SFH may also be evidence for slower or suppressed early star formation in dwarf galaxies due to photoionization after the reionization of the universe by background radiation. Assuming that IC 1613 is typical of a dIrr evolving in isolation, since most of the star formation occurs at intermediate ages, these dwarf systems cannot be responsible for the fast chemical enrichment of the IGM which is seen at high redshift. There is no evidence for any large amplitude bursts of star formation in IC 1613, and we find it highly unlikely that analogs of IC 1613 have contributed to the excess of faint blue galaxies in existing galaxy redshift surveys.
Subject headings:
galaxies: individual: IC 1613 — galaxies: dwarf — galaxies: irregular — galaxies: Local Group — galaxies: stellar content — galaxies: evolution1. Introduction
1.1. Motivation
The study of resolved galactic stellar populations provides a powerful tool for determining the physical parameters of a galaxy such as the star formation history, the chemical composition and enrichment history, and dynamical history of the system. By studying large numbers of individual stars, and interpreting the observable parameters such as the morphology of the color-magnitude diagram (CMD), kinematics, and metallicity it is possible to gain vital clues concerning the evolution of galaxies (e.g., Hodge 1989; Olszewski, Suntzeff, & Mateo 1996; Freeman & Bland-Hawthorn 2002). However, it is sobering to realize that much of our knowledge of the detailed star formation histories (SFH) of galaxies beyond 1 Gyr ago comes from the Milky Way and its nearest satellites (within 200 kpc). In the past, the limiting factors have been crowding, resolution limits, and sensitivity for accurate stellar photometry from the ground. Within the Local Group we always detect a ‘halo’ of red stars (i.e., the ‘Baade sheet;’ Baade 1963), which corresponds to the tip of the first ascent of the red giant branch (indicative of old stars). For those galaxies with adequate observations, the presence of stars as old as those in globular clusters ( Gyr) have been detected via the presence of RR Lyrae stars (e.g., IC 1613, Saha et al. 1992). Nonetheless, quantitative information on the SFH at all epochs, and particularly for ages greater than 1 Gyr, comes primarily from the study of main sequence turnoff luminosities. Thus, HST provides a unique opportunity to extend the sample beyond the immediate vicinity and influence of large galaxies like the Milky Way or M31.
In the nearby dwarf spheroidal satellites of our Galaxy, the complex SFHs which had been indicated early on (e.g., Mould & Aaronson 1983) have recently been revealed completely (see reviews by Gallagher & Wyse 1994; Da Costa 1998; Mateo 1998; Grebel 1999; van den Bergh 2000a). While, on the one hand, all stars in the Draco, Sculptor and UMi dwarfs are ‘old’ ( 10 Gyr) as evidenced by a unique turnoff at , the Carina, Fornax, Leo II and Leo I dwarfs all exhibit turnoff stars at luminosities ranging from 4.0 to 1.5, showing conclusively that star formation has occurred over several Gyr in these objects (e.g., Mighell 1990; Lee et al. 1993; Smecker-Hane et al. 1994; Mighell & Rich 1996; Mighell 1997; Hurley-Keller, Mateo, & Nemec 1998; Gallart et al. 1999a,b; Dolphin 2002). These objects do have some stars as old as in the MW globular clusters, but the majority of stars are of intermediate age. These stunning results fundamentally shape our understanding of galaxy formation and evolution by clearly demonstrating the varieties of SFHs in nearby low mass dwarf spheroidals. In the LMC and SMC, in addition to ongoing star formation, the large range of field star ages attest to continued star formation at all epochs in the past (see Holtzman et al. 1999; Hatzidimitriou 1999). All this is in accord with the working hypothesis that all galaxies began forming stars more than 10 Gyr ago, and that star formation continues until the gas is used up or expelled. It is important to extend studies of this type to larger distances because the Galactic satellite galaxies constitute an extremely incomplete sample that is environmentally biased by the proximity to the Galaxy. The next logical step is to examine the fossil record of star formation in galaxies of various types and sizes, and to identify both commonalities and differences in their SFHs. One simple and still unanswered question is how dIrr and dSph galaxies are related (Faber & Lin 1983; Lin & Faber 1983; Kormendy 1985; Dekel & Silk 1986; Ferguson & Binggeli 1994; Gallagher & Wyse 1994; Skillman & Bender 1995; Mateo 1998; Ferrara & Tolstoy 2000: Skillman, Côté, & Miller 2003; Grebel, Gallagher, & Harbeck 2003).
The approach of gaining a detailed understanding of nearby galaxies is a stepping stone to understanding galaxy evolution, and thus provides a physical basis for understanding observations of high red-shift galaxies and their implications for cosmological models (Tolstoy 1999; Hopkins, Irwin, & Connolly 2001). Often, dwarf galaxies are called upon to solve a number of observationally motivated problems. In the last decade, it has been suggested that dwarf galaxies are responsible for enriching the intracluster medium (Trentham 1994; but see Nath & Chiba 1995) and the intergalactic medium (Nath & Trentham 1997; Murakami & Babul 1999). There have been suggestions that the “faint blue galaxy” problem (Tyson 1988; Koo & Kron 1992; Colless et al. 1993; Lilly 1993; Glazebrook et al. 1995) could be solved by a bursting population of dwarf galaxies (Babul & Rees 1992; Babul & Ferguson 1996). The luminosity functions of dwarf galaxies provide a severe constraint on the cold dark matter cosmologies (Klypin et al. 1999; Moore et al. 1999; Gnedin 2000a). For all of these reasons, a better understanding of the SFHs of dwarf galaxies will help us to better understand the evolution of all galaxies.
1.2. The Dwarf Irregular Galaxy IC 1613
IC 1613 is a member of our Local Group and one of the nearest gas rich irregular galaxies (for a review of the properties of IC 1613 see van den Bergh 2000a). Because of its proximity, IC 1613 offers the opportunity to reconstruct a detailed SFH of a relatively isolated and non-interacting dwarf irregular galaxy (as opposed to the significantly closer - and larger - Magellanic Clouds). IC 1613 also has very low foreground and internal reddening, and very reliable distances from Cepheid and RR Lyr variable stars (Sandage 1971; Freedman 1988; Saha et al. 1992; Dolphin et al. 2001b, hereafter D01). It is located at a distance of 730 kpc (D01), approximately 250 kpc above the M31-Milky Way axis (Grebel 2001), and is included in the diffuse “Local Group Cloud” of galaxies by Mateo (1998).
The physical parameters of IC 1613 were summarized in Cole et al. (1999, C99), which presented a WFPC2 stellar population study of a central field of IC 1613. These properties are normal for an Im V galaxy with a moderate luminosity (15.2) and a small value of the maximum amplitude of the rotation curve (Vmax 25 km s-1, Lake & Skillman 1989). Its star formation rate (SFR) of 0.003 yr-1 given by Mateo (1998; cf., Hunter & Gallagher 1986) is also normal for its type and luminosity. The current ISM oxygen abundance as determined from HII regions ranges from 12 log (O/H) 7.83 (Peimbert, Bohigas, & Torres-Peimbert 1988), which corresponds to 14% of the solar oxygen abundance as determined by Allende Prieto, Lambert & Asplund (2002), to 12 log (O/H) 7.62 (Lee, Grebel, & Hodge 2003) corresponding to 8.5% of the solar value. This is slightly less than that of the SMC, and normal for a galaxy of its luminosity (Skillman et al. 1989). This combination of proximity and normalcy makes IC 1613 one of the best laboratories to study the properties of a dwarf star-forming galaxy that is relatively isolated (as is typical for Im V galaxies).
The overall structure of IC 1613 also is typical of an Im V galaxy. While the central field observed by C99 is relatively quiescent, at slightly larger radii OB associations, HII regions and HI shells are found (e.g., Hodge 1978; Lake & Skillman 1989; Price, Mason, & Gullixson 1990; Georgiev et al. 1999; Valdez-Gutiérrez et al. 2001). Over the last few years there have been several papers on the resolved stellar population of IC 1613 based on HST and high quality ground-based observations. C99 found IC 1613 to be a smoothly evolving galaxy with a relatively constant SFR over its lifetime. A search for bona fide star clusters (Wyder, Hodge & Cole 2000), of which IC 1613 has a marked lack in comparison with the SMC (Baade 1963; van den Bergh 1979), turned up only one 10 Myr old cluster in images taken with the WIYN telescope. The relative lack of star clusters could be taken as evidence that IC 1613 has been evolving in isolation, free from galaxy-galaxy interactions which may be responsible for triggering most cluster formation (cf. van den Bergh 2000b).
Borissova et al. (2000) studied the distribution of luminous cool stars from J and K-band imaging obtained with the 2.1-m telescope at the San Pedro Martir Observatory. They found young supergiants in the central northeast star forming region and AGB stars covering a wide range in age in all of their inner galaxy fields. Albert, Demers, & Kunkel (2000) surveyed IC 1613 for C and M stars with a wide field camera on the Dupont Telescope. This extension of the original Cook, Aaronson, & Norris (1986) C star survey shows that the old stellar population spreads well beyond the regions where star formation currently is active. The C/M star ratio is typical for a galaxy of this luminosity (cf., Battinelli & Demers 2000; Demers & Battinelli 2002), which can be taken as prima facie evidence against large variations in the SFR at intermediate ages.
Variable star investigations have offered an additional dimension to studies of the stellar populations in IC 1613. A variety of types of variable stars are seen (e.g., Mantegazza et al. 2001), including the recent discovery of a luminous Mira (Kurtev et al. 2001). This galaxy has a reasonable number of Cepheids and has been used to study the period-luminosity relationship (e.g., Sandage, Bell, & Tripico 1999; Antonello, Fugazza, & Mantegazza 2000). The presence of a spectrum of pulsating variables extending from long to short periods (see D01) is consistent with star formation having been active in IC 1613 since 10 Gyr in the past.
Here we present a deep color-magnitude diagram (CMD) for an outer field in IC 1613 from long integrations with WFPC2 in the F555W and F814W filters. We derive the first detailed model of the SFH for this field from CMD model fitting analysis, reaching back to the oldest epochs. Because these data consist of such deep integrations, we detect stars further down the main sequence than has previously been possible for an irregular galaxy beyond the Magellanic Clouds. These data thus have the quality to allow comparisons between different approaches to CMD analysis. We present three independent derivations of the SFH of our IC 1613 outer field using the techniques of Tolstoy & Saha (1996); Dolphin (1997, 2002) and Cole (2003; cf. Smecker-Hane et al. 2002).
2. The Data
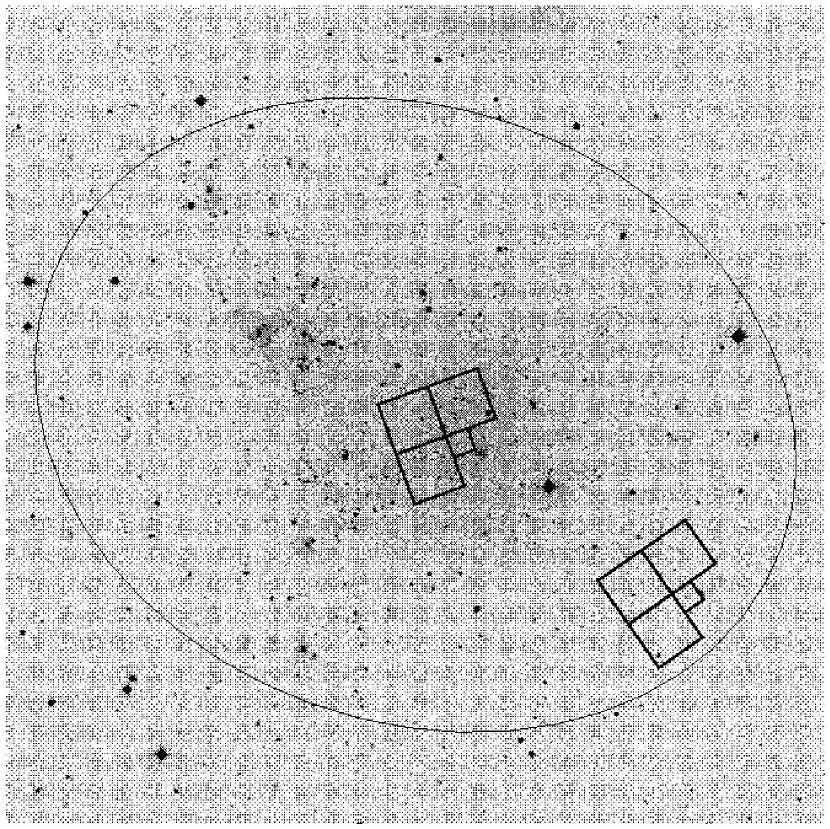
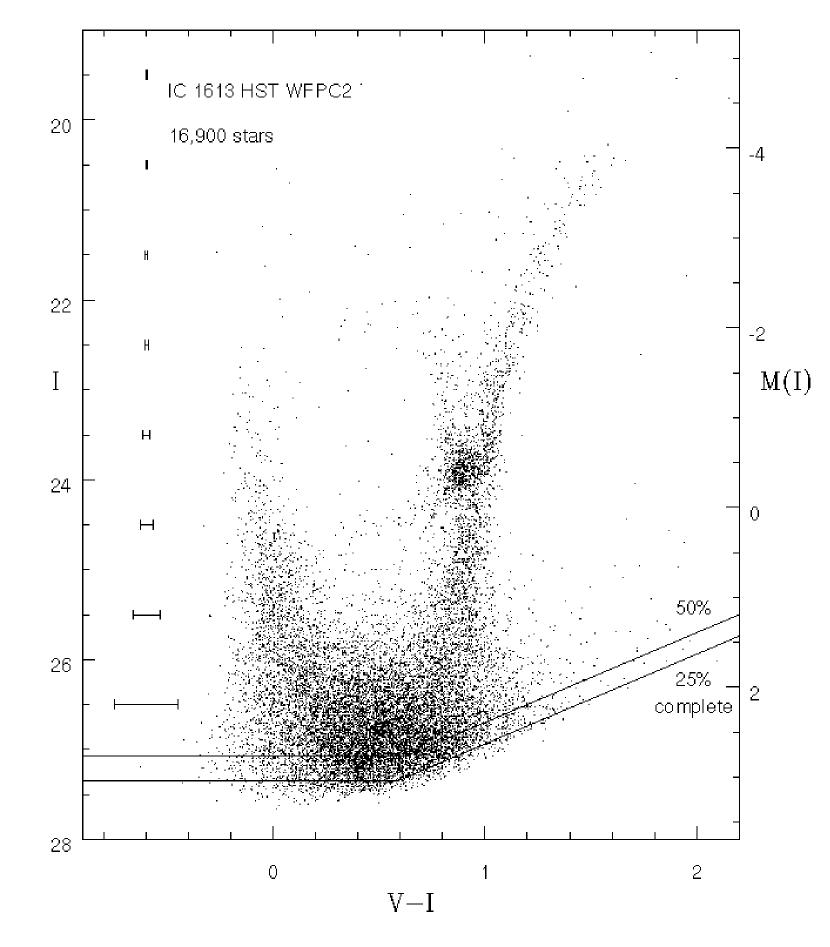
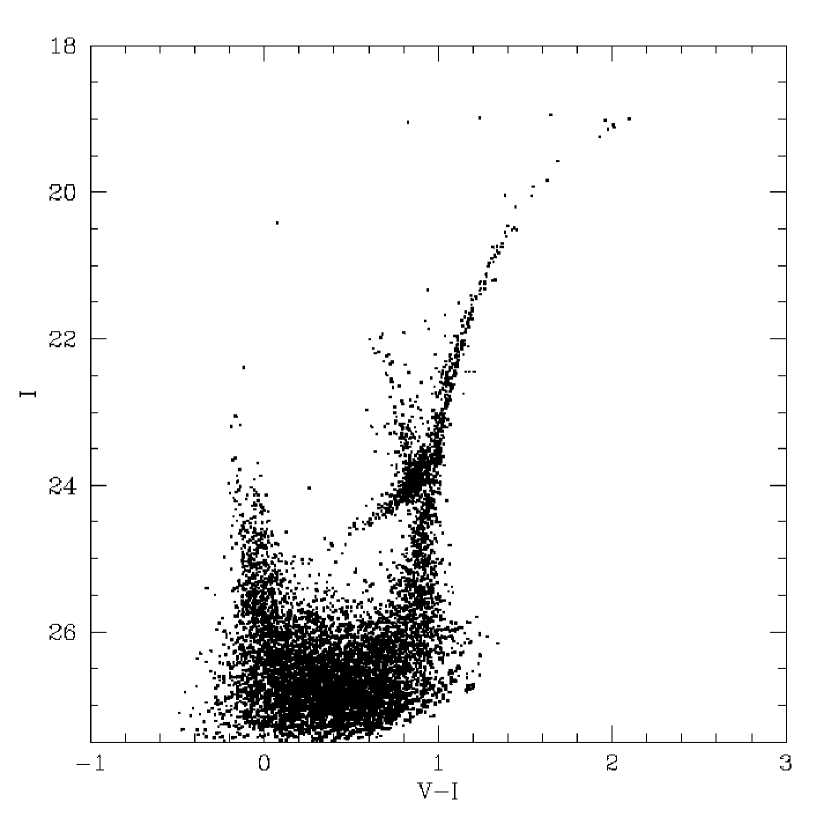
These data have been described by D01, who used the HST single orbit integrations to identify and photometer variable stars such as RR Lyrae and short period Cepheids. As shown in Figure 1, an overlay of the WFPC2 footprint on the STScI Digitized Sky Survey111The Digitized Sky Surveys were produced at the Space Telescope Science Institute under U.S. Government grant NAG W-2166. The images of these surveys are based on photographic data obtained using the Oschin Schmidt Telescope on Palomar Mountain and the UK Schmidt Telescope. The plates were processed into the present compressed digital form with the permission of these institutions., the field center is located 7.4 SW from the dynamical center (Lake & Skillman 1989, a projected distance of 1.6 kpc) and 6.7 (1.4 kpc) SW from the “central” field studied by C99. The position of this field was chosen to minimize crowding and contamination by bright young stars and yet still produce a reasonably large number of stars. Altogether, 8 orbits produced 16 1200s V band (F555W) images and 16 orbits produced 32 1200s I band (F814W) images. These images were obtained at four slightly different “dithered” positions, and so four deep images were made in each band. Photometry was conducted using the multiphot routine of HSTPHOT (Dolphin 2000a) applying the charge transfer loss corrections as described in Dolphin (2000b). In Figure 2 we present the final CMD which is very similar in appearance to Figure 2 of D01. Representative photometric error bars are plotted on the left in Figure 2 and the absolute magnitude scale on the right assumes a distance of 730 kpc as derived by D01.
The CMD displayed in Figure 2, shows a relatively narrow and well defined red giant branch (RGB), a well populated red clump (RC), a faint horizontal branch (HB) which extends out from below the RC, and a main sequence (MS) that reaches above the RC, but is not nearly as well populated as in more central field of IC 1613 of C99. Our photometry follows the MS roughly two magnitudes below the HB. The goal of this program was to reach to the oldest possible MS turn-off populations. In fact, the data do not reach as deeply as was originally proposed, and the limit of our data is roughly 0.5 magnitudes brighter than our proposed goal (V 27.6). This difference is likely due to overly optimistic results from the WFPC2 exposure time calculator (Li Causi, De Marchi, & Paresce 2002) and not properly accounting for the higher background due to IC 1613’s proximity to the ecliptic (ecliptic latitude 4.4).
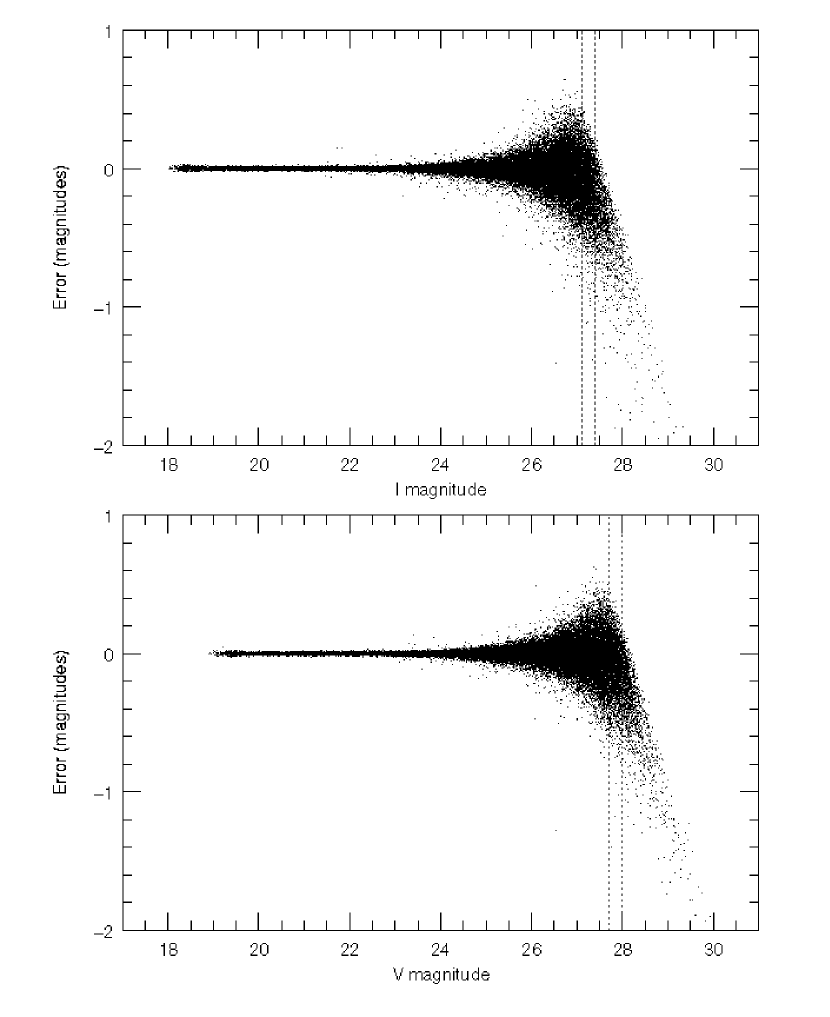
The incompleteness, or the likelihood of detecting a star versus its magnitude in our CMD, has been calculated using the precepts laid out in Dolphin (2002). This is a critical step which is necessary for the accurate interpretation of a CMD, and results are plotted in Figure 3. The 25% and 50% incompleteness limits determined from Figure 3 have been plotted in Figure 2. Since this is an uncrowded field, the increase in both error and incompleteness at faint magnitudes is primarily due to low S/N, and not crowding (i.e., we have not yet hit the confusion limit). In Figure 4 we have plotted the error in the recovered magnitude as a function of input magnitudes for the false star tests. The main purpose of Figure 4 is to remind the reader of the rather substantial photometric errors than can occur well before incompleteness becomes significant.
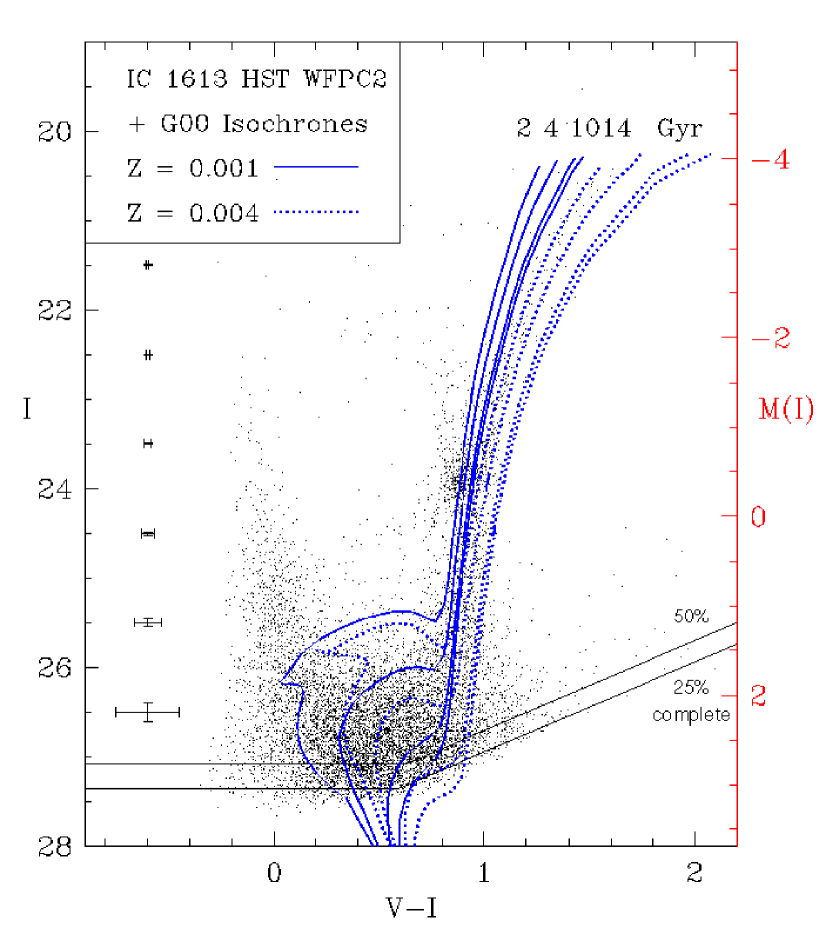
In Figure 5 we have overplotted theoretical isochrones on top of the CMD shown in Figure 2. The isochrones were calculated for a metallicities of 0.001 and 0.004 and ages of 2, 4, 10, and 14 Gyr by Girardi et al. (2000). The choice of the low metallicity (5% of solar) was driven mostly by the position of the RGB, but the position of the oldest isochrone to the left of the reddest RGB stars indicates that even the oldest stars are slightly more metal rich than this. However, the positions of the higher metallicity isochrones show that the lower metallicity is a relatively good fit to the RGB stars. The main reason for overlaying the isochrones here is to demonstrate the coverage and limitations of the observations with respect to the MS turnoffs. MS turnoffs back to intermediate ages (5 Gyr) are well represented in the observations. However, the oldest MS turnoffs (10 Gyr) fall below the 50% completeness limit, and thus, are not well represented in the observations. As a result, in constructing SFHs, information on the oldest populations will need to come from evolved stars.
3. The Models
In this section and the next we describe an exercise of comparing different modeling techniques in order to determine the SFH of IC 1613 from the present observations. The interpretation of the derived SFH begins in §5.
One concern in the field of SFH construction is the uniqueness of the solution (e.g., Tolstoy & Saha 1996; Aparicio et al. 1996; Dolphin 1997; 2002; Gallart et al. 1999a; Holtzman et al. 1999; Hernandez et al. 1999; Harris & Zaritsky 2001; Skillman & Gallart 2003). As higher quality data are obtained and stellar evolution models continue to improve, observational constraints on the derived SFHs become increasingly stringent, and uniqueness becomes less of a problem. However, as one attempts this type of work at ever increasing distances, one is faced with the challenge of always trying to do more with less. Given the relatively high quality of the present dataset, we judged that it would be valuable to conduct three independent SFH derivations. By comparing the results of three independent approaches, we can ascertain which features of the SFHs are technique independent and which are not. We can also compare the differences between the three results to the sizes of the errorbars and judge the quality of the error assessment in each technique.
Here follow three independent approaches to the analysis of the same observational data. We present the results from each exercise followed by a comparison of all three. In each section we only briefly describe each technique; references to other papers describing the details of the techniques are given. Our aim here is to investigate whether these relatively high quality data drive all three investigations to similar results (are the results robust?), or if different choices in technique result in significant differences in interpretation (are the derived SFHs plagued by systematic uncertainties?). We are not attempting to determine which of the three methods is best. That debate has both philosophical and technical concerns and is better done with comparisons over a large range in synthetic and real observations. Nor are we claiming that if two different methods give similar results that differences in methodology do not matter. This issue would involve discussions of other methods for deriving SFHs and lies beyond the scope of this paper.
One way to characterize the three different methods is the degree to which the solution is constrained (e.g., by assumptions of certain values or by limitations on the number of variables). In the Tolstoy method, statistical measurements are used to guide choices between prescribed solutions. In the Cole method, a chemical enrichment law is assumed, and the SFR is solved for as a function of time. In the Dolphin method, both the metallicity and SFR are solved for as a function of time. Note, however, that there are several other differences including: interpolation of the stellar evolution models in metallicity, allowing for the presence of binary stars, assuming or solving for the distance and/or reddening, etc.
It is important to emphasize that we are not testing the quality of the stellar evolution models or the suitability of the stellar atmospheres used to calculate the individual star’s luminosities and colors. All three techniques use the same evolution models as their basis, so this cannot be tested here. Single age and metallicity samples (star clusters) provide more suitable data for testing and tuning of the stellar evolution models (e.g., Chiosi, Bertelli, & Bressan 1992; Carraro et al. 1994; Bragaglia et al. 2001; Barmina, Girardi, & Chiosi 2002; and references therein).
3.1. The Tolstoy approach
Following updated precepts first laid out in Tolstoy (1996), Tolstoy & Saha (1996), and Tolstoy et al. (1998), a model has been built up of the SFH of IC 1613. The results from stellar evolution codes are used directly as input and there is no interpolation between different metallicity tracks. Also, the photometric data are not binned and the effects of binaries are not directly accounted for. The present technique is not automated and relies on human judgement to limit the search to various solutions. Using an archive of stellar evolution tracks converted to observables and Monte-Carlo simulation techniques, a model CMD is built that best matches the observed CMD, and from this a plausible SFH for IC 1613 is inferred. The Padua stellar evolution tracks (Girardi et al. 2000) were used, and then, following Tolstoy (1996), the temperature and luminosities provided by the Padua group were then converted to observed I, VI magnitudes using Kurucz models (Kurucz 1993). This resulted in slightly different observed magnitudes and colors to the Padua isochrones, but very similar to the new Yonsei-Yale isochrones (Yi et al. 2001; 2003).
A simple premise is used as a starting point - that of constant star formation at a constant metallicity throughout the history of this galaxy. Successive iterations then investigate where this model fails and what needs to be changed to correct these failings. Note that because the stellar evolution models are not interpolated in metallicity, the degree of failure must be large enough to justify the “jump” to the next set of models.
For the young stellar population, the best fitting tracks were those of metallicity Z=0.004 (or [Fe/H] ), or 20% solar. This is fairly robust, as the upper part of the CMD (I23.5) contains an obvious Z=0.004 blue loop population (rising vertically out of the red clump, I23.5 and VI0.8), and not the distinctive lower metallicity blue loop population which would populate a diagonal strip across the CMD from the red clump toward the upper main sequence (e.g., Sextans A; Dohm-Palmer et al. 1997, 2002). These stars have ages 1 Gyr. This metallicity is in agreement with the nebular H II region oxygen abundances of 12 log(O/H) 7.86 reported by Skillman, Kennicutt, & Hodge (1989). If one assumes constant [Fe/O] 0, then this is equivalent to [Fe/H], however, taking the new results of Lee et al. (2003) gives a slightly more metal poor equivalent [Fe/H] of 1.07. This is more metal rich than previous estimates of the metallicity of the old population based on the RGB ([Fe/H]) from Lee et al. (1993), and thus, perhaps indicative of enrichment.
The best understood, most accurate SFR indicator is the main sequence, and this forms the backbone of the constraints on the model. These data allow us to follow the main sequence down to about 89 Gyr old turnoff ages, but our sensitivity to all but large variations in the SFRs is very poor 6 Gyr ago. There is no evidence for any large (i.e., factor of 5 or greater) variation in the SFR in this field of IC 1613 over the last 68 Gyr. We find that the stellar density in the lower part of the CMD (I=27, 0.2 VI 0.8) requires an enhancement (a factor 23) in the global SFR between 3 and 7 Gyr ago. The lower limit of this age range (3 Gyr) is determined by the relative lack of any enhancement in stellar density higher up the main sequence, and the upper limit (7 Gyr) is determined, arguably somewhat insecurely, by the fact that modeling the SFH thus far has already over-populated the RC and RGB and covered the entire color range of the RGB as well.
A small population older than 7 Gyr is required by the small protuberance on the blue side of the RC - this requires a lower metallicity (Z=0.001), old ( 10 Gyr) RC. The presence of an old ( 10 Gyr) stellar population is also required by the detection of RR Lyr variable stars in IC 1613 in general (Saha et al. 1992) and this field in particular (D01).
Some researchers use the HB as an additional constraint in deriving SFHs, but it is not used here. The presence and morphology of the HB in the CMD provides very limited insight into the SFH at this epoch due to the second parameter effect (Fusi Pecci et al. 1992; 1993; Bellazzini et al. 2001; Catelan et al. 2001; and references therein). The HB population is certainly a small fraction of the stars in the CMD. It might be that the slight enhancement in the SFR at 1 Gyr is due to an over density in the MS due to a blue horizontal branch population. This was also hypothesized by C99 for the central field of IC 1613.
The majority of star formation in this field appears to have occurred in the last 57 Gyr ago, with a peak between 46 Gyr ago. If a lower metallicity (Z=0.001) is invoked at 6 Gyr ago, this would make the peak in the SFR diminish somewhat and bring the SFH closer to a constant rate over time. Additional information is required to select either one of these scenarios. This is the same dichotomy we found in modeling the Pegasus dI (Gallagher et al. 1998).
The model CMD which comes out of the above process and best matches the observed CMD is shown in Figure 6. This model is the result of the SFH and the variation in metallicity with time shown in Figure 7. The errors in Figure 7 are, as discussed in Tolstoy et al. (1998), representative error bars that come from the (large) sample of models that have been created to find the best match to the SFH of IC 1613. They give an indication of how far the SFR in any bin can vary before the fit gets significantly worse. This is complicated by the fact that a bad fit in one bin can sometimes be compensated by changes in other bins. Thus, the time bins are not independent of each other, and this is quite difficult to account for when determining the errors. Note that the errors in Figure 7 are only representative of limitations of the models used. They are not errors calculated from the models or any comparison with the data.
3.2. The Cole approach
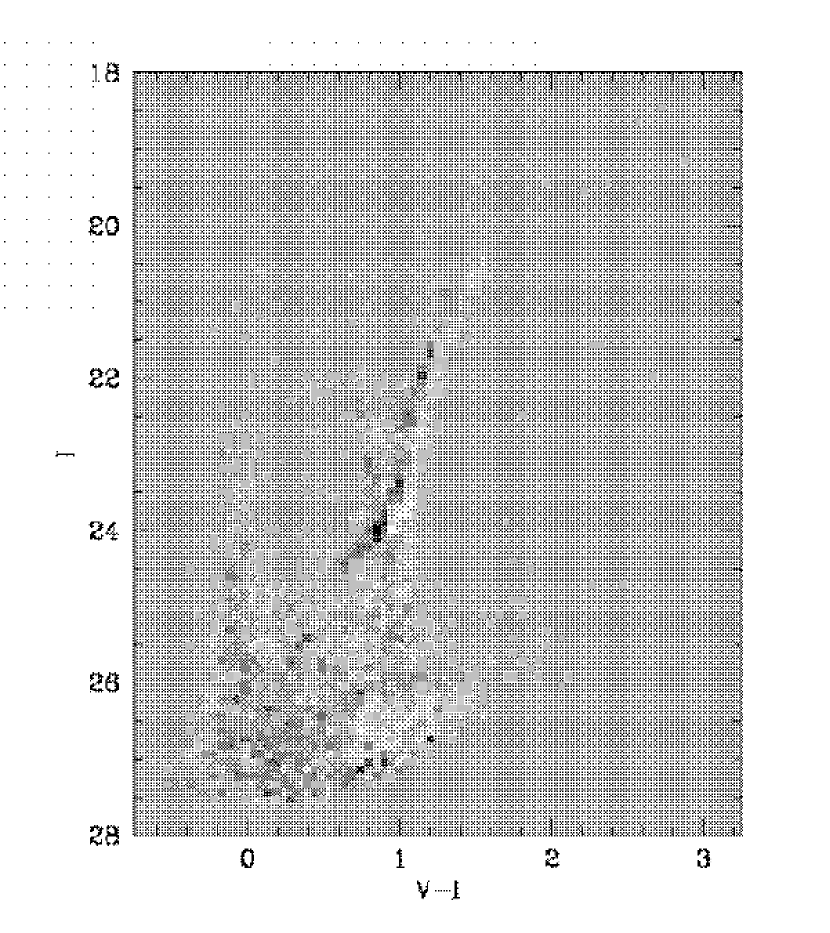
This approach consists of determining the SFH by using a downhill simplex algorithm with simulated annealing to minimize the difference between the observed and synthetic Hess diagrams. The distance, reddening, and age-metallicity relation were held fixed; the fit parameters were the SFRs in 13 logarithmically-spaced age bins. A statistic was used to measure the goodness-of-fit of the models. The full details of the code will be specified in Cole (2003).
The data were binned by 0.05 mag in (VI) and 0.1 mag in I to create the Hess diagram. The models were created by using a Monte Carlo technique to sample from theoretical stellar isochrones of Girardi et al. (2000). The isochrones were interpolated to arbitrary combinations of age and metallicity in order to match the data. Artificial star test results were used to simulate the noise and completeness properties of the data, so that a direct comparison could be made. The stellar IMF was taken from Kroupa, Tout & Gilmore (1993), and binary star populations were included following Duquennoy & Mayor (1991) and Mazeh et al. (1992). Under this prescription, 33% of stars are single, 18% are close binaries, and 49% are wide binaries. Close binaries have secondary masses drawn from a flat mass function, while the secondaries of wide binaries are drawn from the Kroupa et al. (1993) IMF. The adopted distance modulus (mM)0 = 24.31 and reddening E(BV) = 0.02 were taken from the literature (D01 and references therein).
The age-metallicity relation (AMR) was based on previous work (see C99 and references therein), and iteratively modified based on the colors of the red clump, RGB, and blue loop stars. The AMR can be approximated by a constant value [Fe/H] = 1.4 for ages older than 10 Gyr, increasing linearly with time to [Fe/H] = 0.7 at the present time. No dispersion in abundance at a given age is accounted for.
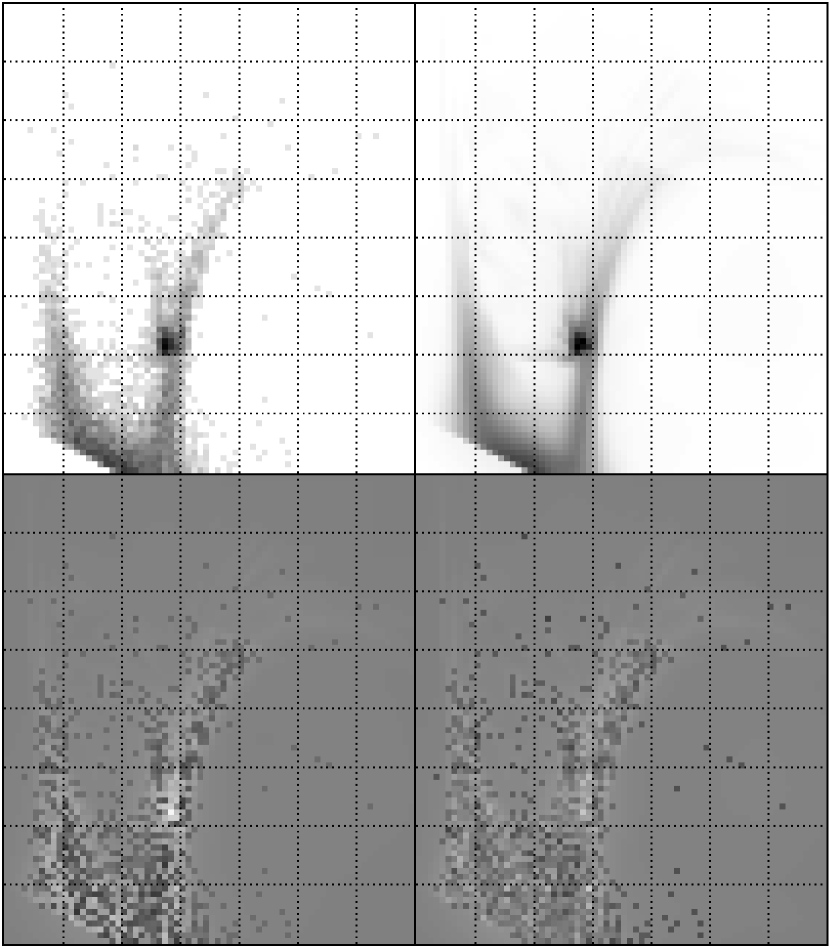
The synthetic CMD that results from this procedure is shown in Figure 8. The general morphology of the CMD is similar to the observed CMD. However, the upper two magnitudes of the red giant branch are narrower than the observed RGB, and the synthetic CMD seems to lack upper main-sequence and bright blue loop stars. These effects are likely attributable to the assumed AMR, which does not allow for any abundance dispersion at a given age. The model also overproduces red horizontal branch stars, which could be a result of inadequacy in the isochrone set. The overall quality of the fit to the SFH is shown by the differential Hess diagram in Figure 9. The figure shows the residuals from subtracting the synthetic Hess diagram from the data, scaled by the Poisson counting statistics in each color-magnitude bin so that white corresponds to a 5 excess in the data, and black to a 5 excess in the model. In only a few pixels does the difference exceed 4, most prominently on the horizontal branch and on the blue side of the upper red giant branch. Across the diagram, the mean absolute residual is 1.3.
Although the isochrones are spaced by 0.05 dex in age, a more informative picture of the SFH is obtained if the age binning is coarser. Age bins 0.2 dex wide were adopted, except for the youngest bin, which extends from 7.80 log (t/yr) 8.35. The derived SFH, and the assumed AMR, are shown in Figure 10. The error bars on the SFH show the 1 errors on the SFR in each age bin, considered in isolation.
The derived SFH is in broad agreement with that proposed for the main body by C99, who suggested roughly constant star-formation over the lifetime of the galaxy, with a decline in the last 0.5 Gyr. Our deeper data and more detailed analysis suggest that the SFR began quiescently, increased by a factor of three roughly 5 Gyr ago, and has been declining slowly ever since. Nearly half of all stars were formed during the time period from 1.4–6 Gyr ago.
3.3. The Dolphin approach
The SFH was determined using the techniques described by Dolphin (1997, 2002). The underlying principle of this approach is to determine the distance, extinction, SFH, and chemical enrichment evolution most likely to produce the observed CMD. The solution was then derived according to the prescription given by Dolphin (2002) over the CMD section 19.0 V 27.0, 18.0 I 26.5, and 0.5 VI 3.0. The bright limits were set by saturation; the faint limits were set by where contamination from blended faint stars became significant. Throughout the solution, an IMF slope of 1.30, binary fraction of 0.35, and flat secondary mass function were assumed.
Determination of the age and metallicity resolution of the solution was made by balancing the fit improvement possible with high-resolution solutions with the lower uncertainties given by low-resolution solutions. The balance was determined by minimizing the “maximum acceptable fit” (Dolphin 2002), as resolution was varied. The optimal resolution was determined to be 0.1 dex in both age and metallicity.
The best fit was measured at (mM)0 24.25 and AV 0.05. Fitting the fit parameter as a function of distance and extinction to a surface and using the maximum acceptable fit to determine uncertainties, the minima and uncertainties were measured to be (mM)0 24.27 0.03 and AV 0.06 0.03. This value of the distance modulus is in excellent agreement with that derived by D01 ((mM)0 24.31 0.06).
Figure 11 shows a comparison of the observed and synthetic CMDs. The only significant differences are that the red clump is tighter and the RGB broader in the synthetic CMD. All points in the CMD were fit with 3 errors, and the overall quality of the best fit was 4 from ideal. This indicates a good, though not perfect, fit.
The largest problem with the fit appears to be the blue helium burning sequence extending vertically up from the red clump. Because the models struggled to fit this feature adequately, it was partially filled in using an extremely metal-poor red giant branch. One could certainly redo the solution with this part of the CMD omitted, but we do not believe that the recovered SFRs were significantly affected because the total number of RGB stars appears to be correct. (This is the case because the number of stars on the RGB below the red clump is strongly constrained.) A second problem, also affecting the RGB, is that the shape of the theoretical RGBs does not exactly match that of the observed data (see Figure 5), thus causing the model RGB to be smeared slightly so that all observed points can be accounted for. Again, the number of RGB stars is constrained by the lower RGB, and the effect on the recovered SFH is minimal.
The SFH and chemical enrichment history were also measured, and are shown in Figure 12, binned by 0.3 dex in age. The SFRs are relative values, normalized to a mean value of 1. The mean metallicity (weighted by mass of stars formed, rather than number of stars present today) was measured to be [Fe/H] 1.20 0.20. Error bars are not symmetric, as the best fit (rather than the average of acceptable fits) is shown. Uncertainties were measured from two sources: scatter as distance and extinction were moved within the acceptable fit range and scatter as measured from Monte Carlo tests, in which synthetic populations were created and measured. Because of the highly-correlated errors in the SFRs at various ages and metallicities, this composite measurement of uncertainty provides more accurate estimates of the uncertainties of these quantities than does searching around the maximum acceptable fit.
The main feature seen in the SFH is an extended event from 2 Gyr ago until 5 – 10 Gyr ago. While there has been star formation since that event (a significant amount coming 0.5 Gyr ago), the bulk of the stars in this region of IC 1613 come from the earlier age. Although Dolphin et al. (2001) found RR Lyraes in this field, the ancient (10 Gyr) SFR was well below the lifetime average.
The metallicity enrichment appears to have been primarily during the extended star formation episode. Older than 10 Gyr, we find a mean metallicity of [Fe/H] 1.39 0.24 dex; by 1 Gyr ago this had increased to [Fe/H] 0.63 0.21. We see very little enrichment since then, as the average metallicity of all stars younger than 1 Gyr is [Fe/H] 0.77 0.19. It should be noted that no assumptions regarding the AMR were made in the solution; metallicities are determined entirely from the populations required to fit the CMD.
4. Comparison of Three Star Formation Histories
4.1. The Agreement Between the Different Methods
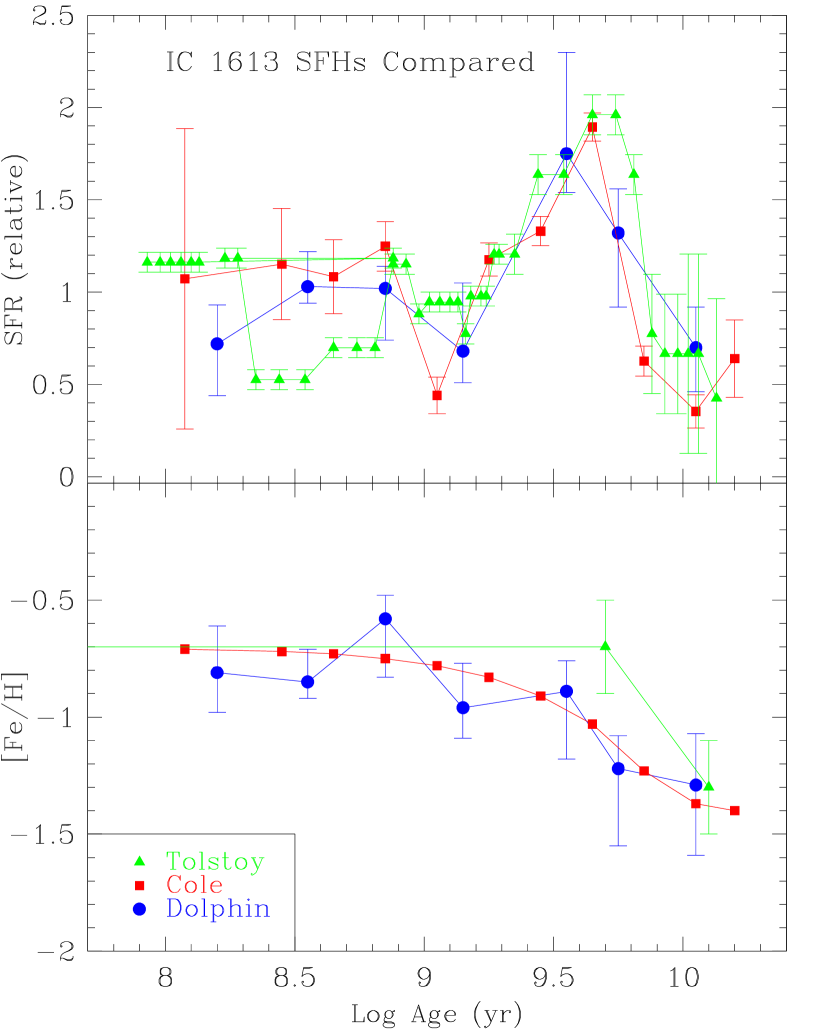
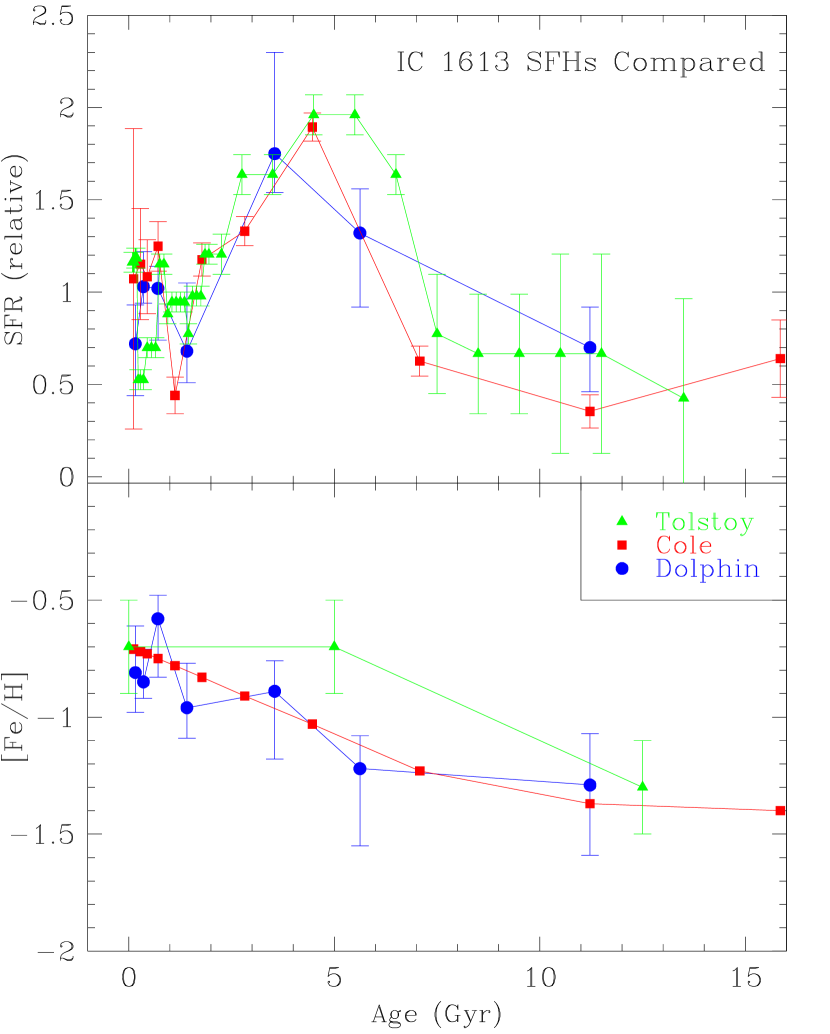
Figure 13 shows a direct comparison of the best fit solutions for the SFHs and chemical enrichment histories for IC 1613 derived via the three different methods. Figure 14 shows the same comparison, only with the time axis plotted linearly instead of logarithmically. We find the agreement between the three methods rather striking and remarkable considering the large differences between the methods. In particular, all three methods find an enhanced SFR, at roughly the same magnitude (factor of 3), over roughly the same period (from 3 to 6 Gyr ago). The SFR at early and late times is relatively low, but significantly not zero. Thus, IC 1613 appears to have been creating stars over the entire history of the universe, without very large ( factor of 10) variations in SFR (subject to our time resolution constraints). Additionally, all three methods were driven to AMRs which are in excellent agreement.
Although the solutions do show general agreement, there are clearly differences in the details. Some of the differences may be artificial due to different choices of bin sizes in time. The most notable difference appears in the last billion years, where the observational time resolution is the greatest; the Tolstoy method finds a relatively lower SFR over the period of 0.2 to 0.6 Gyr. Overall, the differences between the models appear to be consistent with the sizes of the estimated errors, suggesting that the internal error estimates are, for the most part, reasonable.
4.2. The CMD Features Which Determine the Solution
It is important to understand the CMD morphology that drives fitting algorithms, whether manual or automated, to the solutions at which they arrive. The primary empirical driver of the solutions found here is the large number of stars fainter than I 26.3, with a wide color extent from 0.1 VI 0.9. Such large numbers of stars are only produced if the SFR was higher at some point in the past than it is now. This pedestal represents the main-sequence turnoffs and subgiant branches of the dominant stellar populations in IC 1613. It was tentatively detected near the limit of the data in C99, although crowding made it a low reliability feature. Because of the evolutionary timescales, main-sequence stars must be the primary inhabitants of this region of the CMD, although some contribution of subgiants is present, especially if there is a large old, metal-poor population.
It could be that the color extent of the pedestal is largely responsible for the small differences in ancient SFH derived by the three methods. This is because of the strong influence of metallicity on the color of the main-sequence for low-mass stars, and to a lesser extent because the presence of unresolved binary stars tends to smear out stellar sequences to the red. A significant role is also played by the treatment of incompleteness, which can shift stars significantly in the color-magnitude plane. Although the differences are small, it is interesting to understand the origins of these differences.
For the Tolstoy method (no interpolation in metallicity between stellar evolution tracks, no binary stars, and an increasing with time but otherwise unrestricted AMR), a relatively high metallicity ( = 0.004) and old age (4–6 Gyr) are necessary to match the red side of the pedestal. Where younger stars are present, they are assumed to be of similar (or higher) metallicity – they are brighter, but not much bluer (see Figure 6). This leaves the blue half of the pedestal to be filled in by the unevolved main-sequence of a much younger (108 yr) population.
In the case of isochrone interpolation, binary stars, and an assumed AMR (Cole method), the age of the stars which populate the pedestal is determined by the AMR. Because of the contribution of binary stars, the intrinsic sequence that matches the data can be bluer than if no binaries were assumed. The color is primarily controlled by the metallicity, and so the age follows. The smearing effect of binary stars and the interpolation in metallicity allow for a more uniform population of the blue half of the pedestal with younger and more metal-rich stars.
In the case where isochrones are interpolated, binary stars are included, and the AMR is explicitly solved for by the automated fitting routine (Dolphin method), the code is free to select ages and metallicities that make the best fit to the pedestal. Thus the reddest part of the pedestal is fit by an old, metal-poor population, the middle part is fit by a more metal-rich population at 3 Gyr, and the bluest part is matched to a slightly more metal-poor, slightly younger population. This is the inverse case to the previous one: the color extent of the pedestal determines the AMR (for stars older than 1 Gyr).
Choices propagate through the CMD to RGB color and width, red clump and HB color, magnitude and morphology. Unfortunately, the models are unreliable here (Bertelli & Nasi 2001; D’Antona 2002; Schiavon et al. 2002), so it is difficult to decide how much astrophysical (as opposed to mathematical) weight to place on the differences.
4.3. A Self-Consistent Solution?
In principle, it is possible to derive an AMR from the SFH. Is the AMR derived in this manner consistent with that derived from directly from the CMD? Since, in the Dolphin solution, the metallicity is a free parameter, and thus, the chemical enrichment law is derived independently of the SFH, it is important to determine if the solution is self-consistent. That is, has the minimization found a chemical enrichment law which follows naturally from the SFH, or does the solution show chemical enrichment and star formation proceeding in an uncoupled manner?
In order to derive an AMR from the SFH, several assumptions are required. For example, by integrating the SFH, assuming constant IMF and constant yield, using the instant (or nearly instant) recycling approximation, it is possible to derive a chemical enrichment law. Some of these assumptions are reasonably constrained, while others are not. The biggest uncertainty is the history of the gas content of the galaxy. It would be most convenient to model the evolution of the galaxy as a “simple closed box” (e.g., Searle & Sargent 1972), but this model is known to fail for the majority of dwarf irregular galaxies in the sense that either mass inflow or outflow (or both) is required (Matteucci & Chiosi 1983). However, since we have no independent information concerning the history of the gas content, we assume a simple closed box model evolution in making a comparison calculation. Using the present day gas mass of 8.2 107 M☉ (Lake & Skillman 1989), a stellar mass of 1.0 108 M☉ (based on an assumption of M/L(B) 1.4 from the model calculated in §7.3), and a gas phase oxygen abundance of 6.8 10-5, results in an oxygen yield of 8.4 10-5, or 17% of the solar oxygen abundance. This “effective yield” is relatively low when compared to theoretical values of the oxygen yield (e.g., Maeder 1992), but this is typical of the Local Group dwarf irregulars (see discussion in Kennicutt & Skillman 2001). With this value of the yield, it is then possible to calculate a chemical enrichment history for a closed box model with the calculated star formation rate as a function of time.
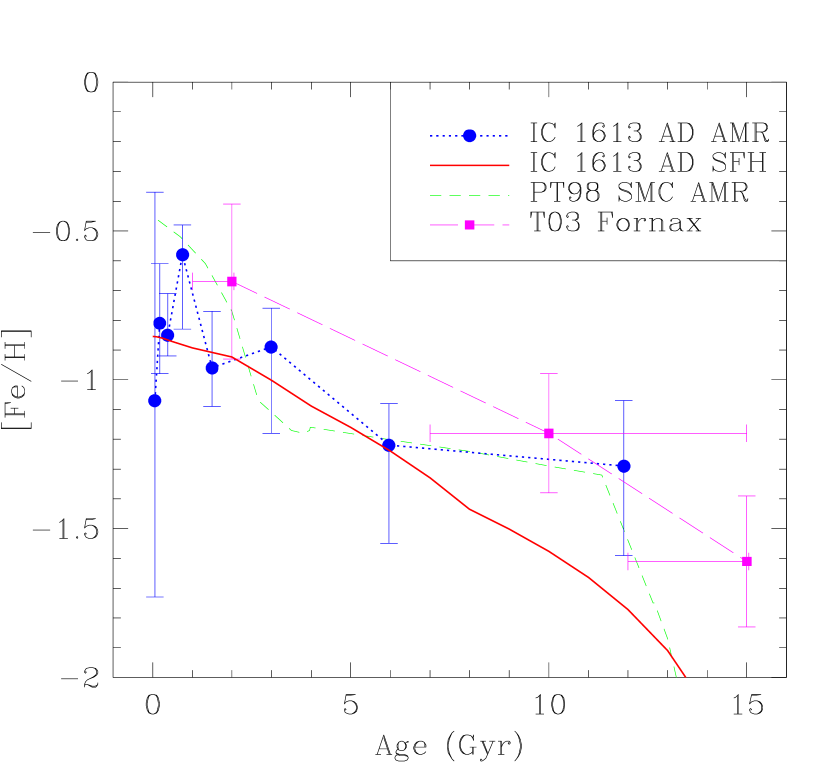
In Figure 15 we have plotted the metal enrichment history of IC 1613 derived from the CMD via the Dolphin method and compared it to a metal enrichment history calculated from the SFH derived via the Dolphin method assuming a simple closed box model with constant yield. As can be seen in Figure 15, the agreement between the two is quite good, with the possible exception of the earliest ages. This agreement provides another check on the validity of the CMD analysis.
The small difference at the earliest ages is in the sense that the model does not rise quite as quickly as the CMD analysis predicts. There are several possible explanations for this difference (if real). Certainly our CMD analysis does not provide a strong constraint on the SFR at the earliest epoch, so it could be that there is early star formation that is not found in our solution. For example, we have assumed constant star formation during the interval up to 8 Gyr ago; if we assume a declining SFR during that interval, then the metallicity rises more quickly. Alternatively, it could be that yields are not constant with time or metallicity (e.g., there could have been an epoch of prompt early enrichment by a population of stars with an unusual IMF; Larson 1998). For comparison, we have included in Figure 15 the age-metallicity relationship for the SMC as derived by Pagel & Tautvaišienė (1998), and that measured for the Fornax dSph from high resolution spectroscopy of individual stars by Tolstoy et al. (2003). Note that the enrichment law for the SMC appears to fit better in the sense of a steeper rise at early times. This is a result of assuming inflow (there is less gas to enrich at early times, so the gas is enriched faster). Clearly there are several uncertainties in understanding the nature of the enrichment in these dwarf galaxies. A significantly deeper CMD and spectroscopic metallicities will be required to better constrain the various possibilities.
4.4. Implications for CMD Fitting Methodology
Despite significant differences in technique between the different modeling approaches, the basic shape of the derived SFH is robust. At the broadest level, the SFHs are insensitive to the details of the comparison. This phenomenon was also seen in the comparison of SFH models for the Large Magellanic Cloud (Skillman & Gallart 2003), but is perhaps more surprising for the case of IC 1613, where there is no clear indication for a distinct main-sequence turnoff, as there is in the LMC.
The impression one gets from this comparison is that all three methods are well constrained by the observations and driven to similar results in calculating the SFHs. Can this result be generalized? There are even more methods of deriving SFHs from CMDs, so this exercise, by no means, covers the spectrum. For example, several methods rely on a much coarser binning within the CMD. Additionally, this exercise has only been conducted on one observed CMD. There could be CMDs representing different SFHs where the results of the different methods do depart significantly. Finally, all three methods used the same stellar evolution models as input, so uncertainties in the input models are not being tested. If the models change significantly in the future, then. of course, one would expect different SFHs as a result.
In sum, we can conservatively say that this exercise supports the claim (e.g., Dolphin 2002) that high quality CMDs (with the MS sampled down to MV 2 or fainter) will provide sufficient information to place strong constraints on the SFH of a galaxy. The main goal now is to obtain similarly high quality CMDs for other dwarf irregular galaxies and other galaxies sampling different morphological types and environments.
5. The Evolution of Star-Formation and Metal Enrichment in IC 1613
5.1. The Outer Field
Have the deep observations presented here significantly improved our knowledge of the SFH and chemical enrichment of IC 1613? Hodge (1989) provided a sketch of the “probable” SFH and AMR of IC 1613, consistent with its known properties, showing a constant SFR and a gradual enrichment of heavy elements. Mateo (1998), based on the observations of Freedman (1988) and Saha et al. (1992), also shows a relatively constant SFR, with a slight decrease at intermediate ages. The SFH presented by Grebel (1999), based on Freedman (1988) and Cook & Aaronson (1988) is nearly identical to that of Mateo, but shows constant metallicity over the entire age of the galaxy. It would appear that all of the previous SFHs for IC 1613 agree in showing a lack of strong bursts of star formation (within the limits of the time resolution possible).
From a comparative study of the masses, blue luminosities, and H fluxes of a sample of irregular galaxies, Gallagher, Hunter, & Tutukov (1984) concluded that dwarf irregular galaxies had nearly constant SFRs over their lifetimes. Early studies of the upper portions of the CMDs of nearby irregular galaxies supported this conclusion (e.g., Tosi et al. 1991). The present observations are also consistent with this conclusion. However, the new observations reveal, for the first time, the enhanced SFR over a 3 - 4 Gyr period at intermediate ages and give us a first real look at the chemical enrichment in a dIrr as a function of time.
We will consider the increase in SFR at intermediate ages relative to the earliest ages to be real. It is true that, with the present uncertainties, the SFH history of IC 1613 is marginally consistent with constant star formation over the history of the universe. However, we feel that three independent analyses indicating a heightened SFR at intermediate ages is interesting (possibly surprising) and should not be ignored. In §6 we will compare this result with what is seen in other, well studied dwarf galaxies. In §7 we will discuss this within the context of modern theoretical expectations for the evolution of dwarf galaxies.
The chemical enrichment history of IC 1613 is now known in better detail than ever before. The derived chemical enrichment is in good agreement with that expected for a system showing nearly constant star formation, and is similar to that of other well studied dwarf galaxies. We have included in Figure 15 the age-metallicity relationship for the SMC as derived by Pagel & Tautvaišienė (1998), and that measured for the Fornax dSph from high resolution stellar spectroscopy by Tolstoy et al. (2003). Despite the differences in morphologies between the three galaxies (isolated dwarf irregular, interacting irregular galaxy, and dSph), all three galaxies have very similar AMRs. Perhaps this is not too surprising as all three galaxies are apparently dominated by star formation at intermediate ages.
5.2. Comparison Between the Inner and Outer Fields of IC 1613
The outer field is 67 southwest of the central C99 field, and 82 southwest of the geometric center of IC 1613. At 1.8 kpc projected distance from the center, the field is 2.4 scale lengths out in the disk (Hodge et al. 1991), well within the edge of the HI distribution (Lake & Skillman 1989). Should we expect a difference in CMD morphology, due to radial gradients in age or metallicity, between the two fields? Baade noted early on that the blue, irregularly distributed stars in IC 1613 are embedded in a much larger, regular sheet of red stars; clearly some kind of gradient in stellar population parameters is present. Our outer field is just beyond the “blue” limit of IC 1613 as quoted by Baade (1963), and more than halfway to the edge of the red sheet. This color difference should be reflected in the CMD morphologies.
To the limiting magnitude achieved here, we are most sensitive to age gradients over the past yr, which will be manifest in the ratio of main-sequence and supergiant stars relative to red giants and red clump stars. Metallicity differences should be reflected in color shifts, following the well known rule of thumb that line blanketing in stellar atmospheres pushes stars to the red at high metallicity.
A direct comparison of the two fields (e.g., by a differential Hess diagram) is difficult because of the quite different limiting magnitudes and crowding levels in the images. In Figure 16 we show the CMD of the outer field (compare to Figure 1) with fiducial sequences derived from the C99 field overplotted. Solid lines mark the high density features in the CMD: the main-sequence, RGB, red clump, and “vertical red clump” (intermediate-mass blue loop stars). Dashed lines delineate the less populous features: horizontal branch, blue and red supergiants, and thermally-pulsing AGB.
There are no significant color differences between the principal sequences of Figure 16. Below I 25, both the RGB and the MS fiducials of the C99 field appear to deviate from the outer field sequences. However, the differences are small and in opposite directions; they are interpreted as due to the larger errors and increased crowding in the C99 data. The agreement between upper RGBs is striking: if any metallicity gradient is present, a finely-tuned age gradient must be invoked to cancel out the effect. It is unlikely that the dominant population in the C99 field is very much younger than the outer field, given 1) the relatively young age of most stars in the outer field (Figure 14), and 2) the approximately steady-state history derived by C99 for the central field. The similar colors of the intermediate-age and old stellar populations in both fields suggests that they are not very different from each other, at least over most of their history. Further support for this view derives from the near constancy with radius of the carbon:M-star ratio (Albert, Demers, & Kunkel 2000), indicating a comparable proportion of intermediate-age stars at both small and large radii.
The relative strengths of the various features, however, vary significantly between the two fields. Table 1 lists the relative numbers of stars in various evolutionary phases; the uncertainties in the ratios are derived from Poisson statistics on the number counts. The difference in surface brightnesses in photographic band is taken from Hodge et al. (1991) as 2.40.5 mag arcsec-2, or a factor of 93 in flux. Because photographic is blue-sensitive, it is not surprising that the unresolved -light is most closely tracked by the bluest resolved stars. There is a clear difference in number density ratios between the young stars and the old stars.
The available information suggests that as the global activity level in IC 1613 declined after the broad peak 2–7 Gyr ago, the star-formation rate in the central regions stayed high longer, and has maintained an average level some 30–40% higher than the outer field. Star formation remains much higher still in the off-center complex of HII regions that coincides with the peak of the HI column density (Lake & Skillman 1989). In the outer field, star formation has slowed but not stopped, as attested by the presence of a few small HII regions even at this radius (Hodge, Lee, & Gurwell 1990).
6. A Comparison of IC 1613 to Other Dwarf Galaxies
6.1. Comparison to Other Dwarf Irregular Galaxies
6.1.1 Star Formation Histories
Although detailed SFH studies exist for other dwarf irregular galaxies, no dwarf irregular galaxies at distances beyond the Magellanic Clouds have been observed to the depth of the present study of IC 1613 (MV 3.4). Dolphin (2002) has shown that the CMD needs to be sampled down to at least MV 2 for meaningful constraints on the ancient and intermediate age SFH, and most studies of dwarf irregular galaxies fall short of this. For example, the pioneering study of NGC 6822 by Gallart et al. (1996) used ground based photometry with a limiting MV of 1. This has only recently been surpassed by the HST observations of Wyder (2001), with a limiting MV 1 for those observations. The HST observations of WLM reported by Dolphin (2001c) reached to MV 2 and the HST observations of the “transition” galaxy LGS 3 reached to MV 2.5 (Miller et al. 2001). HST observations of the relatively nearby Phoenix dwarf, which today is classified as a transition galaxy but presumably would have been classified as a dwarf irregular galaxy until only very recently ( 100 Myr ago), has been observed down to MV 4.0 (Holtzman, Smith, and Grillmair 2000). By comparison, our HST study of Leo A (Tolstoy et al. 1998) reached to MV 1, and this has only recently been improved to MV 1.5 by Schulte-Ladbeck et al. (2002). Thus, truly secure SFRs for the ancient populations of isolated dwarf irregular galaxies are quite scarce.
Note that one of the fundamental conclusions of this study, that star formation was relatively low at ages older than 7 Gyr compared to intermediate ages, is only possible with the present depth of photometry. In order to be able to determine whether this is a general feature of low mass dwarf irregular galaxies or particular to IC 1613, CMDs of similar depth are needed for a large sample of dwarf irregular galaxies. At present, this will only be possible with the HST for Local Group galaxies.
IC 1613 is not the first dwarf irregular galaxy for which it has been suggested that star formation has occurred predominantly at intermediate ages. The SMC is also known to have a SFH which is dominated by star formation at intermediate ages (Dolphin et al. 2001c and references therein). From the study of a single field in the SMC, Dolphin et al. (2001c) find a slow rise in the SFR from the earliest ages to a peak at 7 Myr and then a steep decline to the present. This is very similar to that for IC 1613, with the exception of a higher SFR in the last Gyr for IC 1613. It is interesting that these two galaxies, with presumably very different evolutionary histories (IC 1613 evolving in isolation and the SMC being strongly influenced by both the LMC and the Galaxy), have very similar star formation and chemical enrichment histories. Note, however, that the changes in the SFR in the Magellanic Clouds are often associated with the tidal effects of a close encounter or close passage to the Milky Way galaxy (although the SMC and LMC have different SFHs, see discussions in Gardiner & Hatzidimitriou 1992 and Olszewski et al. 1996).
There are also galaxies for which it has been suggested that most of the stars have been formed relatively recently. Our earlier study of Leo A (Tolstoy et al. 1998) suggested that the majority of the star formation had occurred in the last 2 Gyr. Dolphin et al. (2002) discovered RR Lyraes in Leo A, and thus the presence of very early star formation, but converting the number of RR Lyrae stars to an early SFR is very uncertain. Interestingly, the Schulte-Ladbeck et al. (2002) study of Leo A concludes that the CMD is consistent with either similar SFRs at earliest and intermediate ages or decreasing SFR from earliest to intermediate ages, but not increasing SFR from earliest to intermediate ages as we see here for IC 1613. It would be interesting to model the newer HST Leo A observations with the techniques described in this paper to see if the same conclusion is derived. A similar SFH is found for Sextans A. From a relatively deep (MV 2.0) CMD, Dolphin et al. (2003) find that while there is evidence for very old stars in Sextans A, the SFR at intermediate ages (3 - 10 Gyr) was quite low, and the SFR has been the highest in the last 2 Gyr.
However, of those dwarf irregular and transition galaxies with relatively deep CMDs, the SFH history found in IC 1613 does not appear to be universal. In WLM, Dolphin (2000c) finds a relatively high SFR at the earliest times, which is never reached again in the history of the galaxy. In LGS 3, Miller et al. (2001) find a SFR which is highest in the first few Gyr, and then lower by at least a factor of 10 thereafter. The Phoenix dwarf galaxy shows a relatively high SFR in the earliest few Gyr followed by fluctuations but showing an overall decrease in SFH. These large differences in star formation histories probably point to different environmental influences, but identifying which environmental effects are dominant remains a challenge.
6.1.2 Radial Gradients in Star Formation Histories
Studying population gradients in dwarf irregular galaxies does not require the same depth of photometry as constraining the oldest SFRs. In fact, it was in IC 1613 that Baade (1963) identified the underlying sheet of Population II red giant stars that covers twice the area on the sky that the blue stars do. It appears that all of the dwarf irregular galaxies that have been studied in sufficient detail do show radial gradients in their stellar populations (e.g., SMC, Gardiner & Hatzidimitriou 1992; WLM, Minniti & Zijlstra 1997; GR 8, Dohm-Palmer et al. 1998; LGS 3, Miller et al. 2001; Leo A, Dolphin et al. 2002). This effect is seen to be especially strong in the blue compact galaxies (e.g., UGC 6456, Lynds et al. 1998; Schulte-Ladbeck, Crone, & Hopp, 1998; Aloisi et al. 2001; Tosi et al. 2001; Dolphin et al. 2001a; Cannon et al. 2003). It is interesting that Harbeck et al. (2001) find the same thing for dSphs; however, they interpret the majority of the dSph cases as metallicity gradients and an age gradient only for Carina.
Do the strong population gradients observed in low mass star forming galaxies imply that current star formation is confined exclusively to the inner parts of these galaxies or can star formation proceed in the outer parts, but at a greatly reduced level? In the case of IC 1613 (and some other low mass dwarf irregulars) a large fraction of the HI gas is located outside of the optically defined galaxy. Gallagher & Hunter (1984) introduced the notion of “usable gas”; under the assumption that massive star formation is a threshold phenomenon, gas that lies below the critical threshold would not be usable gas, i.e., not available for star formation. Most of our knowledge of star formation in the outer parts of galaxies has come from studies of their HII region distributions (but see recent study of the distribution of high surface brightness areas by Parodi & Binggeli 2003). However, detailed studies of the stellar populations allow us a much clearer picture of the star formation patterns as functions of both time and radius. Unfortunately, the present study represents just a small fraction of the area of IC 1613. It would be interesting to study the stellar population gradient over the entire face of IC 1613.
The strong age gradients mean that scale lengths must be changing with time. Of course, this needs to be properly accounted for in comparison of nearby galaxies with their potential progenitors at intermediate redshift (e.g., Barton & van Zee 2001; Pisano et al. 2001).
6.2. Comparison to Dwarf Spheroidal Galaxies
The currently favored CDM models for galaxy formation afford a significant role for dwarf galaxies. Dwarf galaxies are assumed to trace early star formation in the Universe and galaxy evolution until the present. Due, in large part, to attempts to understand the possible evolutionary connections between the dwarfs with negligible or extremely low present SFRs (the dSph galaxies) and the dwarfs with obvious signs of present star formation (e.g., dIrrs, blue compact dwarfs, HII galaxies), many theorists are turning their attention to the problem of dwarf galaxy evolution. Environmental effects are turning out to be a key parameter (e.g., van den Bergh 1994a,b; Klypin et al. 1999; Moore et al. 1999; Gnedin 2000b; Mayer et al. 2001a,b; Carraro et al. 2001).
We have produced the deepest CMD of an isolated dwarf irregular galaxy. Given the density-morphology relationship in the Local Group, the dIrr galaxies are at much greater distances than the dSphs, and, thus, have correspondingly shallower CMDs. As a result, it has been difficult to make direct comparisons between the CMDs of dIrr galaxies and dSph galaxies. Even though our CMD for IC 1613 is still not as deep as the typical study of a dSph MW companion, we can now attempt such a comparison.
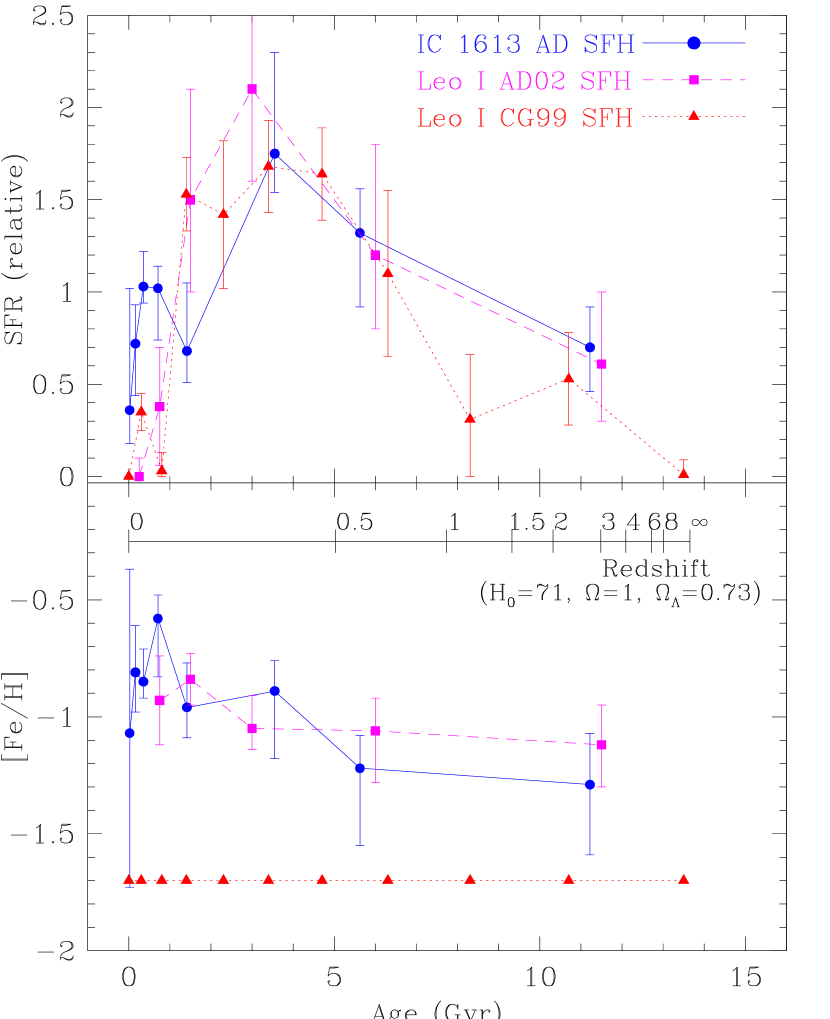
To first order, star formation in IC 1613 appears to have occurred predominantly at intermediate ages. This is also characteristic of several of the outer MW dSph satellites (specifically Carina, Fornax, Leo II and Leo I, see introduction). A particularly interesting comparison is between IC 1613 and Leo I; both appear to be dominated by star formation at the same intermediate ages (Gallart et al. 1999a; Dolphin 2002). In Figure 17 we compare the Dolphin SFH and AMR solutions for IC 1613 with the Dolphin (2002) solutions for Leo I. We also add the Gallart et al. (1999a) solutions for Leo I. Figure 17 shows that the SFHs and AMRs for IC 1613 and Leo I, when derived via identical methodology, are nearly identical. Figure 17 also shows very good agreement between the SFHs derived by two different methods, even though the derived AMRs are quite different (the main difference most likely arising because the upper red giant branch, which is quite sensitive to metallicity, is not used in the methodology of Gallart et al. 1999a).
One possible interpretation of Figure 17 is that, absent the youngest stars, is it possible that there are no differences between the stellar populations of isolated dIrr and dSphs which are more distant from their parent galaxies. The implication is that dIrr and some dSph galaxies have similar progenitors, and that the differences which we see today are due to environmental influences during the lifetimes of the galaxies which allow one type of galaxy to retain its gas and form stars up the present and another not. Certainly the morphological census of the Local Group has evolved with time.
Do the similar SFHs and AMRs for IC 1613 and Leo I support the proposal by Lin & Faber (1983) that dSphs can be formed by ram pressure stripping of dIrrs? At the time, Lin & Faber estimated that an ambient number density of 10-6 cm-3 would be required for stripping the gas from a dIrr over a Hubble time and inferred the presence of such gas through indirect arguments. Recently, FUSE and CHANDRA observations have provided evidence for extended coronal gas surrounding either the Milky Way galaxy or the Local Group with a density of 10-6 cm-3 (Nicastro et al. 2002; 2003). Additionally, Stanimirovic et al. (2002) estimate surprisingly high densities of 10-4 cm-3 for the Galactic halo via observations of pressure confined clouds in the Magellanic Stream. Thus, there does appear to be material with the potential for stripping the gas from Local Group dwarf galaxies. Indeed, the HI cloud associated with the Phoenix dwarf (Young & Lo 1997; St. Germain et al. 1999; Irwin & Tolstoy 2002) may be direct evidence of a stripping event having occurred in the last 100 Myr (Holtzman et al. 2000).
The main problem with drawing a direct evolutionary link between IC 1613 and Leo I would appear to be the total number of stars. With an MV 14.7, IC 1613 is much more luminous than Leo I (MV 11.9). While small differences in luminosity could be explained by fading of the dSph after truncation of star formation, the nearly 3 magnitude difference would be difficult to account for. Although the V-band central surface brightnesses are comparable (22.8 0.3 for IC 1613 versus 22.4 0.3 for Leo I, Mateo 1998), the optical scale lengths are significantly different ( 700 pc for IC 1613 and 130 pc for Leo I). Given that Leo I is a dark matter dominated system, it does not seem likely that ram pressure stripping of the HI gas would result in a significantly greater optical scale length. (Indeed, Faber & Lin calculated that IC 1613 was too large to evolve into a present day dSph.) A possible solution to this could be that only the central region of Leo I has a smaller scale length and that there is an underlying larger scale length stellar distribution (perhaps as suggested by Stoehr et al. 2002). In sum, the difference in luminosity between IC 1613 and Leo I is another manifestation of the bimodal nature of the metallicity-luminosity relationships for dwarf galaxies (Mateo 1998; Grebel et al. 2003), which remains as a key hurdle for the proposal of converting dSphs to dIrrs via ram pressure stripping.
7. Impact on Our Understanding of Galaxy Evolution
Low-mass dwarf irregular galaxies provide an important testing ground for several fundamental questions about galaxy evolution and cosmology. Given our SFH for IC 1613, we now consider the implications under the assumption that IC 1613 is typical of dwarf irregular galaxies which are evolving primarily as isolated galaxies in low relatively low density environments.
7.1. Evidence for Suppression of Early Star Formation by Photoionization?
An especially interesting question in this regard is the effect of reionization on the suppression of dwarf galaxy formation. Originally discussed within the context of explaining the absorbers responsible for the Ly- forest (Ikeuchi 1986; Rees 1986), later papers realized the potentially important effects of early heating of the ISM on the evolution of dwarf galaxies (Efstathiou 1992; Babul & Rees 1992; Chiba & Nath 1994; Quinn, Katz, & Efstathiou 1996; Thoul & Weinberg 1996; Kepner, Babul, & Spergel 1997; Barkana & Loeb 1999; Bullock et al. 2000). With a rotation curve maximum of 25 km s-1, IC 1613 is clearly in the regime of galaxies which should be susceptible to this effect. The model of Babul & Rees (1992) specifically predicts a gap or a fallow period of star formation from the time of reionization ( 6, Fan et al. 2002; or 17 5, Spergel et al. 2003) to the time when the UV background dropped sufficiently for the gas in low mass haloes to cool (which they estimate to be about 1). A redshift timeline has been added to Figure 17 so that one can look at the SFH as a function of both real time and redshift. Although the time resolution is course, it appears that the heightened SFR in IC 1613 started between of 0.5 and 1. It could be argued that the SFH of IC 1613 is exactly what one expects from an isolated galaxy with roughly 109 M☉. It might have formed as a virialized structure sometime before reionization, and started to make stars then. After reionization, the high UV background prevented further infall and kept the gas within IC 1613 from cooling rapidly, so that it never formed too many stars until star formation in M31 and the Milky Way settled down enough to drop the UV background, at a redshift roughly between 1 and 2. It then took some time for that gas to cool, until finally at z 0.5 the star-formation ramped up to a peak and slowly declined later. This is not “delayed galaxy formation,” as we do see evidence for very old stars in IC 1613 (e.g., RR Lyrae stars), but formation of a dwarf in which much of the star formation was deferred.
Within the collapse and dissipation model of galaxy formation (White & Rees 1978), the effects of reionization on the evolution of dwarf galaxies is twofold (see discussion in Benson et al. 2002a and references therein). The ionizing background heats the IGM which suppresses the collapse of low mass structures. The ionizing background can also heat the ISM in low mass haloes which have already formed and reduce the rate of radiative cooling by reducing the number of neutral atoms. The first effect has a strong influence on the low end of the galaxy luminosity function. The photoioinzing background will reduce the fraction of gas which collapses with the dark matter especially in systems which are less massive than the “filtering mass” (Gnedin 2000b). Benson et al. (2002a) point out that the formation history is also an important parameter in determining the final gas content of a dark matter halo. In order to solve the perceived problem of the mismatch between the theoretically expected and observed low end of the galaxy luminosity function, much attention has been given to the effects of the suppression of the formation of dwarf galaxies (e.g., Bullock et al. 2000; Chiu, Gnedin, & Ostriker 2001; Somerville 2002; Benson et al. 2002b, 2003; Tassis et al. 2003). However, these studies generally concentrate on the luminosity function and star formation histories of individual galaxies are not explored in depth.
The second effect is relevant to the question of suppressed star formation at intermediate ages. Can star formation in dwarf galaxies which have already formed before reionization be suppressed by the photoionizing background and then recommence at redshifts of 0.5 and lower? Babul & Rees (1992) point to the fast decline in the UV background between = 2 and the present and estimate that new star formation would precipitate in dwarfs at 1. Calculating a specific SFH depends strongly on the influence of both external (the photoionizing background) and internal (stellar feedback) variables (Tassis et al. 2003). The evidence of an environmental dependence of the low end of the galaxy luminosity function (Tully et al. 2002; Trentham & Hodgkin 2002) may imply a very large range of SFHs due simply to environmental differences on the effects of photoionization (Benson et al. 2003).
Could the low SFR in IC 1613 at early ages indicated by our CMD analysis be the signature of suppression of star formation by the photoionizing background? The effect could be environmentally dependent (i.e., for dwarf galaxies close to large galaxies, the effects of the UV radiation from the neighbor galaxies could be more important than the realtively uniform UV background from distant sources), so a statistically significant sample of SFHs for dwarf irregular galaxies will be needed for any definitive statements. However, it is interesting that the bulk of the star formation in IC 1613 occurs at intermediate ages, which may well be after much of the gas in the central parts of the galaxy has had time to recombine and cool. It is also interesting that the star formation and chemical enrichment histories for IC 1613 are similar to those of the SMC and Leo I. These three galaxies show very different morphologies, so why should their evolutionary characteristics be so similar? This would be possible if their evolution is driven by external forces and if these galaxies shared relatively similar environments. The extreme cases of Leo A (Tolstoy et al. 1998) and Sextans A (Dolphin et al. 2003), in which it appears that star formation has been suppressed until 0.2 – 0.3, may present even stronger challenges. Note that while Sextans A is nearly identical to IC 1613 in terms of luminosity and rotation curve maximum (Skillman et al. 1988) Leo A is an order of magnitude fainter and shows almost no rotation at all (Young & Lo 1996).
However, it should be noted that the evolutionary characteristics of IC 1613 are not universal. Early enhancements in SFR are detected in several of the dwarf galaxies in the Local Group. Our suggestion that we are able to detect the effects of reionization in the SFHs of the nearby dwarfs may raise as many questions as it answers. The UV background is just one of many factors which can influence the SFH of a dwarf galaxy, and it may be the dominant factor for only a fraction of dwarf galaxies. At this point it would be very useful for the galaxy evolution modelers to present compilations of the SFHs for the dwarf galaxies in their simulations. As the quality of the CMDs in the observational studies increases, and thus the time resolution improves, detailed comparisons between observational SFHs and theoretical simulations may prove to better constrain ideas about the relative importance of different effects on dwarf galaxy evolution.
7.2. Enrichment of the IGM by Outflows from Dwarf Galaxies?
It is currently thought that the bulk of the intergalactic medium (IGM) was chemically enriched above roughly 0.1% of the solar value at least by 3 and possibly as early as (Songaila 2001; Pettini et al. 2003; Boksenberg, Sargent, & Rauch 2003; and references therein). Because of the lower masses of dwarf galaxies, they are a natural source to consider for the formation and ejection of the metals that are found in the IGM (e.g, Dekel & Silk 1986; Nath & Trentham 1997; Efstathiou 2000; Garnett 2002). The SFH for IC 1613 indicates that it may have produced the bulk of its metals at intermediate ages (i.e., 3 - 6 Gyr ago). This is not the correct time frame for the observed enrichment of the IGM. Assuming the currently favored CDM model with 1.0, 0.73, and H0 71 km s-1 (Freedman et al. 2001; Spergel et al. 2003), a redshift of 3 corresponds to a lookback time of 11.5 Gyr (for an age of the universe of 13.7 Gyr). Thus, the slow time scale for the production of elements for present day dwarf irregular galaxies does not fit in with what is needed for the rapid enrichment of the IGM.
Perhaps this should be clarified. This does not rule out prompt enrichment by the first structures to form (e.g., Tegmark et al. 1997) or “pre-galactic outflows” (e.g., Madau, Ferrara, & Rees 2001; Mori, Ferraro, & Madau 2002). In fact, there are many classes of models which successfully explain the early enrichment (cf. Aguirre et al. 2001b). Notably, the recognition that outflows appear to be universal in Lyman break galaxies at high redshift (Pettini et al. 2001) allows the early enrichment to be conducted entirely by larger ( 1010 M☉) galaxies (Aguirre et al. 2001a). Currently, a great deal of attention has focused on the supermassive stars thought to form only at the earliest epochs (e.g., Oh et al. 2001). The only scenario which we cast doubt on is that the present day dwarf galaxies are responsible for the bulk of the prompt enrichment of the IGM via star formation with a “normal” IMF.
7.3. Dwarf Galaxies and the Faint Blue Galaxy Population
Wyder (2001) explored whether analogs to the Local Group dwarf irregular NGC 6822 could be contributing to the faint blue galaxy excess. Based on WFPC2 images that reached the level of the red clump, he concluded that NGC 6822 was likely never bright enough for its = 0.5 analogs to contribute to current redshift surveys. However, his derivation of the history of NGC 6822 lacked age resolution, due to the relatively shallow (MV 1) limiting magnitude of the data. Thus an extreme burst of star-formation in NGC 6822 could temporarily brighten it enough to qualify as a faint blue galaxy, while remaining consistent with the observed CMD.
Using our deeper data for IC 1613, and motivated by the evidence for a significantly higher star-formation rate during the epoch corresponding to redshifts 0.3–0.6, we can estimate the likelihood that IC 1613 analogs are represented in large-scale galaxy surveys. Following Wyder (2001), we adopt an updated version of the PEGASE.2 evolutionary synthesis code (Fioc & Rocca-Volmerange 1997) to model the evolution of IC 1613’s integrated magnitudes and colors. We take a rough average of the three SFHs presented in Section 3 as our baseline input model for the synthesis code. Because the extinction to IC 1613 is small, it can be neglected to first order. The PEGASE.2 output is then renormalized to match the observed absolute B magnitude of IC 1613, MB = 14.6. A very basic check on the modeling procedure is provided by the output integrated color, BV = 0.53. This is in good agreement with the observed BV = 0.6 0.1.
Our baseline model for IC 1613 has been gradually brightening for most of its history, with a steeper increase after its era of enhanced star formation roughly 3–6 Gyr ago, and a small subsequent decline. It reached its brightest absolute B magnitude MB = 15 during this episode. For reasonable CDM cosmologies, this corresponds to a redshift 0.4. Using the formulae for cosmological distance modulus (e.g., Peebles 1993), and appropriate spectral windowing to account for the K-correction, the baseline model for IC 1613 would have apparent magnitudes B 27.5 and 30 at redshifts = 0.5 and 1, respectively. This is far too faint to be included in the present generation of redshift surveys.
If IC 1613 had a history of starbursts, it could have been much brighter and bluer in the past than the relatively smoothly evolving baseline would predict. We modify our baseline model by replacing the star-formation rate between ages of 2.5 and 7 Gyr, i.e., we excise the era of enhanced star-formation rate. We replace the removed portion with an equal mass of stars, but we force them to form during an 0.1 Gyr interval centered at 5.0 Gyr. This lookback time would correspond to a redshift of = 0.5 for a distant analog of IC 1613. The timescale is chosen to be a realistic estimate for the burst lifetimes in nearby dwarf galaxies (cf. Cannon et al. 2003). The resulting burst has an amplitude of 20 over the long-term average star-formation rate. This history produces a synthesis model that is 0.7 mag brighter (in rest-frame B) than the baseline model at = 0.5, when normalized to reproduce the present-day MB and BV. The relatively small effect on the integrated magnitudes of the model galaxy can be traced to the long era of low star-formation which precedes the burst, diluting the impact of the numerous massive, young stars which are injected into the model 5 Gyr ago. The smaller K-correction implied by the larger fraction of UV-bright stars in the bursting model makes it relatively even brighter than the baseline model, but still at the very faint limit of current redshift surveys (e.g., Lilly et al. 1995).
The perturbation in both color and magnitude dies down after less than 109 yr, so that bursts have to be frequent and extreme in order to add many IC 1613-like galaxies into the observed samples of faint blue galaxies. Note that such models with high burst amplitudes and short durations then also require large numbers of quiescent objects (Tyson & Scalo 1988). However, there is no evidence in our data for such an event (in agreement with the lack of older star clusters, c.f., van den Bergh 2000b). The expected errors on an individual data point at the level of the main-sequence turnoff of a 5 Gyr old population are comparable to the separation between isochrones aged 3 and 6 Gyr at the distance of IC 1613 (see Figure 4). However, the aggregate distribution of data points are inconsistent with a dominant coeval population smeared by photometric errors. An instantaneous burst with an amplitude of 20 would produce a clear envelope to the subgiant branch and a steep break in the main-sequence luminosity function that are not observed. This is reflected in the analyses which led to our baseline model. Somewhat smaller bursts, staggered in time, could be hidden in the data, but these would have much less effect on the integrated model colors. We find it highly unlikely that analogs of IC 1613 have contributed to the excess of faint blue galaxies in existing redshift surveys. This is in agreement with the results of Carollo & Lilly (2001), who found that a subsample of star-forming galaxies in the redshift range 0.5 1 have metallicities more like present-day giant galaxies than today’s dwarfs.
We can also ask whether the Sloan Digital Sky Survey (SDSS) will be sensitive to analogs of IC 1613 at cosmologically interesting distances. York et al. (2000) give limiting magnitudes of 23.3 for the SDSS, and our synthesis models show roughly neutral (V ) colors for IC 1613. The absolute V magnitude of IC 1613 is 15.2, and so it would be cataloged by SDSS out to distance moduli 38.5, or distances of 500 Mpc. This corresponds to redshift 0.1.
8. Summary and Conclusions
We have taken deep images of an outlying field in the Local Group dwarf irregular galaxy IC 1613 with the WFPC2 aboard the Hubble Space Telescope in the standard broad-band F555W (V, 8 orbits) and F814W (I, 16 orbits) filters. We analyze the resulting color-magnitude diagram (CMD) and compare it with CMDs created from theoretical stellar models using three different methods to derive a SFH as well as constrain the chemical evolution for IC 1613.
All three methods find an enhanced SFR, at roughly the same magnitude (factor of 3), over roughly the same period (from 3 to 6 Gyr ago). Additionally, all three methods were driven to similar age-metallicity relationships which show an increase from [Fe/H] 1.3 at earliest times to [Fe/H] 0.7 at present. We investigate the age-metallicity relationship which is derived independently of the SFH in order to see if the two are self-consistent. Good agreement is found between the AMR which is derived from the CMD analysis and that which can be inferred from the derived SFH at all but the earliest ages (where our model SFH is not well constrained). The agreement between the three models and the self-consistency of the derived chemical enrichment history support the reality of the derived SFH of IC 1613 and, more generally, are supportive of the practice of constructing galaxy SFHs from CMDs.
A comparison of the newly observed outer field with an earlier studied central field of IC 1613 shows that the SFR in the outer field has been significantly depressed during the last Gyr. This implies that the optical scale length of the galaxy has been decreasing with time and that comparison of galaxies at intermediate redshift with present day galaxies should take this effect into account.
Comparing the CMD of the outer field of IC 1613 with CMDs of Milky Way dSph companions, we find strong similarities between IC 1613 and the more distant dSph companions (Carina, Fornax, Leo I, and Leo II) in that all are dominated by star formation at intermediate ages. In particular, the SFH and AMR for IC 1613 and Leo I are indistinguishable. This implies that dIrr galaxies cannot be distinguished from dSphs by their intermediate age stellar populations. This may support scenarios of dwarf galaxy evolution where dSph galaxies are produced via the stripping of gas from dIrr galaxies.
This type of a SFH may also be evidence for slower or suppressed early star formation in dwarf galaxies due to photoionization after the reionization of the universe by background radiation. Theoretical models have suggested that star formation will be suppressed until a redshift of 1, and we find that most of the star formation in IC 1613 has taken place after a redshift of 0.5.
Assuming that IC 1613 is typical of a dIrr evolving in isolation, since most of the star formation occurs at intermediate ages, “normal” star formation (i.e., with a universal IMF) in these dwarf systems cannot be responsible for the fast chemical enrichment of the IGM which is seen at high redshift. There is no evidence for any large amplitude bursts of star formation in IC 1613, and we find it highly unlikely that analogs of IC 1613 have contributed to the excess of faint blue galaxies in existing galaxy redshift surveys.
References
- (1)
- (2) Aguirre, A., Hernquist, L., Schaye, J., Weinberg, D. H., Katz, N., & Gardner, J. 2001a, ApJ, 560, 599
- (3)
- (4) Aguirre, A., Hernquist, L., Schaye, J., Katz, N., Weinberg, D. H., & Gardner, J. 2001b, ApJ, 561, 521
- (5)
- (6) Albert L., Demers, S., & Kunkel, W.E. 2000 AJ, 119, 2780
- (7)
- (8) Aloisi, A. et al. 2001, AJ, 121, 1425
- (9)
- (10) Allende Prieto, C., Lambert, D. L., & Asplund, M. 2001, ApJ, 556, L63
- (11)
- (12) Antonello, E., Fugazza, D., & Mantegazza, L. 2000, A&A, 356, L37
- (13)
- (14) Aparicio, A., Gallart, C., Chiosi, C., & Bertelli, G. 1996, ApJ, 469, L97
- (15)
- (16) Baade, W. 1963, The Evolution of Stars and Galaxies, ed. C. Payne-Gaposhkin (Cambridge: Harvard Univ. Press)
- (17)
- (18) Babul, A. & Rees, M. J. 1992, MNRAS, 255, 346
- (19)
- (20) Babul, A. & Ferguson, H. C. 1996, ApJ, 458, 100
- (21)
- (22) Barkana, R., & Loeb, A. 1999, ApJ, 523, 54
- (23)
- (24) Barmina, R., Girardi, L., & Chiosi, C. 2002, A&A, 385, 847
- (25)
- (26) Barton, E. J. & van Zee, L. 2001, ApJ, 550, L35
- (27)
- (28) Battinelli, P., & Demers, S. 2000, AJ, 120, 1801
- (29)
- (30) Bellazzini, M., Pecci, F. F., Ferraro, F. R., Galleti, S., Catelan, M., & Landsman, W. B. 2001, AJ, 122, 2569
- (31)
- (32) Benson, A. J., Lacey, C. G., Baugh, C. M., Cole, S., & Frenk, C. S. 2002a, MNRAS, 333, 156
- (33)
- (34) Benson, A. J., Frenk, C. S., Lacey, C. G., Baugh, C. M., & Cole, S. 2002b, MNRAS, 333, 177
- (35)
- (36) Benson, A. J., Frenk, C. S., Baugh, C. M., Cole, S., & Lacey, C. G. 2003, astro-ph/0210354
- (37)
- (38) Bertelli, G. & Nasi, E. 2001, AJ, 121, 1013
- (39)
- (40) Boksenberg, A., Sargent, W. L. W., & Rauch, M. 2003, ApJS, submitted
- (41)
- (42) Borissova, J., Georgiev, L., Kurtev, R., Rosado, M., Ivanov, V.D., Richer, M., & Valdez-Gutiérrez, M. 2000, RMxAA, 36, 151
- (43)
- (44) Bragaglia, A. et al. 2001, AJ, 121, 327
- (45)
- (46) Bullock, J.S., Kravtsov, A.V., & Weinberg, D.H. 2000, ApJ, 539, 517
- (47)
- (48) Cannon, J.M., Dohm-Palmer, R.C., Skillman, E.D., Bomans, D.J., Côté, S., & Miller, B.W. 2003, AJ, submitted.
- (49)
- (50) Carollo, C.M., & Lilly, S.J. 2001, ApJ, 584, 153
- (51)
- (52) Carraro, G., Chiosi, C., Bressan, A., & Bertelli, G. 1994, A&AS, 103, 375
- (53)
- (54) Carraro, G., Chiosi, C., Girardi, L., & Lia, C. 2001, MNRAS, 327, 69
- (55)
- (56) Catelan, M., Bellazzini, M., Landsman, W. B., Ferraro, F. R., Fusi Pecci, F., & Galleti, S. 2001, AJ, 122, 3171
- (57)
- (58) Chiba, M. & Nath, B. B. 1994, ApJ, 436, 618
- (59)
- (60) Chiosi, C., Bertelli, G., & Bressan, A. 1992, ARA&A, 30, 235
- (61)
- (62) Chiu, W. A., Gnedin, N. Y., & Ostriker, J. P. 2001, ApJ, 563, 21
- (63)
- (64) Cole, A.A. 2003, in prep.
- (65)
- (66) Cole, A.A., Tolstoy, E., Gallagher, J.S., Hoessel, J.G., Mould, J.R., Holtzman, J.A., Saha, A. & the WFPC2 IDT 1999, AJ, 118, 1657
- (67)
- (68) Colless, M., Ellis, R. S., Broadhurst, T. J., Taylor, K., & Peterson, B. A. 1993, MNRAS, 261, 19
- (69)
- (70) Cook K.H., Aaronson M. & Norris J. 1986 ApJ, 305, 634
- (71)
- (72) Cook, K. H. & Aaronson, M. 1988, PASP, 100, 1218
- (73)
- (74) Da Costa, G.S. 1998, in Stellar Astrophysics for the Local Group, eds. A. Aparicio, et al., Cambridge University Press, p. 351
- (75)
- (76) D’Antona, F. 2002, IAU Symposium, 207, 599
- (77)
- (78) Dekel, A. & Silk, J. 1986, ApJ, 303, 39
- (79)
- (80) Demers, S. & Battinelli, P. 2002, AJ, 123, 238
- (81)
- (82) Dohm-Palmer, R. C. et al. 1997, AJ, 114, 2527
- (83)
- (84) Dohm-Palmer, R. C. et al. 1998, AJ, 116, 1227
- (85)
- (86) Dohm-Palmer, R. C., Skillman, E. D., Mateo, M., Saha, A., Dolphin, A., Tolstoy, E., Gallagher, J. S., & Cole, A. A. 2002, AJ, 123, 813
- (87)
- (88) Dolphin, A. 1997, New Astronomy, 2, 397
- (89)
- (90) Dolphin, A. E. 2000a, PASP, 112, 1383
- (91)
- (92) Dolphin, A. E. 2000b, PASP, 112, 1397
- (93)
- (94) Dolphin, A. E. 2000c, ApJ, 531, 804
- (95)
- (96) Dolphin, A. E. 2002, MNRAS, 332, 91
- (97)
- (98) Dolphin, A. E. et al. 2001a, MNRAS, 324, 249
- (99)
- (100) Dolphin, A.E., Saha, A., Skillman, E.D., Tolstoy, E., Cole, A. A., Dohm-Palmer, R. C., Gallagher, J.S., Mateo, M. & Hoessel, J.G. 2001b, ApJ, 550, 554
- (101)
- (102) Dolphin, A. E., Walker, A. R., Hodge, P. W., Mateo, M., Olszewski, E. W., Schommer, R. A., & Suntzeff, N. B. 2001c, ApJ, 562, 303
- (103)
- (104) Dolphin, A. E. et al. 2002, AJ, 123, 3154
- (105)
- (106) Dolphin, A.E., Saha, A., Skillman, E.D., Dohm-Palmer, R. C., Tolstoy, E., Cole, A. A., Gallagher, J.S., Hoessel, J.G., & Mateo, M. 2003, AJ, in press.
- (107)
- (108) Duquennoy A. & Mayor M. 1991, A&A, 248, 485
- (109)
- (110) Efstathiou, G. 1992, MNRAS, 256, 43P
- (111)
- (112) Efstathiou, G. 2000, MNRAS, 317, 697
- (113)
- (114) Faber, S. M. & Lin, D. N. C. 1983, ApJ, 266, L17
- (115)
- (116) Fan, X., Narayanan, V. K., Strauss, M. A., White, R. L., Becker, R. H., Pentericci, L., & Rix, H. 2002, AJ, 123, 1247
- (117)
- (118) Fioc, M., & Rocca-Volmerange, B. 1997, A&A, 326, 950
- (119)
- (120) Ferguson, H. C. & Binggeli, B. 1994, A&A Rev., 6, 67
- (121)
- (122) Ferrara, A. & Tolstoy, E. 2000, MNRAS, 313, 291
- (123)
- (124) Freedman, W.L. 1988 ApJ, 326, 691
- (125)
- (126) Freedman, W. L. et al. 2001, ApJ, 553, 47
- (127)
- (128) Freeman, K., & Bland-Hawthorn, J. 2002, ARA&A, 40, 487
- (129)
- (130) Fusi Pecci, F., Ferraro, F. R., Corsi, C. E., Cacciari, C., & Buonanno, R. 1992, AJ, 104, 1831
- (131)
- (132) Fusi Pecci, F., Ferraro, F. R., Bellazzini, M., Djorgovski, S., Piotto, G., & Buonanno, R. 1993, AJ, 105, 1145
- (133)
- (134) Gallagher, J. S. & Hunter, D. A. 1984, ARA&A, 22, 37
- (135)
- (136) Gallagher, J. S., Hunter, D. A., & Tutukov, A. V. 1984, ApJ, 284, 544
- (137)
- (138) Gallagher, J. S., Tolstoy, E., Dohm-Palmer, R. C., Skillman, E. D., Cole, A. A., Hoessel, J. G., Saha, A., & Mateo, M. 1998, AJ, 115, 1869
- (139)
- (140) Gallagher, J. S. & Wyse, R. F. G. 1994, PASP, 106, 1225
- (141)
- (142) Gallart, C., Aparicio, A., Bertelli, G., & Chiosi, C. 1996, AJ, 112, 1950
- (143)
- (144) Gallart, C., Freedman, W. L., Aparicio, A., Bertelli, G., & Chiosi, C. 1999a, AJ, 118, 2245
- (145)
- (146) Gallart, C. et al. 1999b, ApJ, 514, 665
- (147)
- (148) Gardiner, L. T. & Hatzidimitriou, D. 1992, MNRAS, 257, 195
- (149)
- (150) Garnett, D. R. 2002, ApJ, 581, 1019
- (151)
- (152) Georgiev, L., Borissova, J., Rosado, M., Kurtev, R. Ivanov, G., & Koenigsberger, G. 1999, A&AS, 134, 21
- (153)
- (154) Girardi, L., Bressan, A., Bertelli, G. & Chiosi, C. 2000 A&AS, 141, 371
- (155)
- (156) Glazebrook, K., Ellis, R., Santiago, B., & Griffiths, R. 1995, MNRAS, 275, L19
- (157)
- (158) Gnedin, N. 2000a, ApJ, 535, L75
- (159)
- (160) Gnedin, N. Y. 2000b, ApJ, 542, 535
- (161)
- (162) Grebel, E. K. 1999, in IAU Symp. 192, The Stellar Content of Local Group Galaxies, ed. P. Whitelock & R. Cannon (Provo: ASP), 17
- (163)
- (164) Grebel, E. K. 2001, Astrophysics and Space Science Supplement, 277, 231
- (165)
- (166) Grebel, E. K., Gallagher, J. S., & Harbeck, D. 2003, AJ, 125, 1926
- (167)
- (168) Harbeck, D. et al. 2001, AJ, 122, 3092
- (169)
- (170) Harris, J. & Zaritsky, D. 2001, ApJS, 136, 25
- (171)
- (172) Hatzidimitriou, D. 1999, IAU Symp. 190: New Views of the Magellanic Clouds, 190, 299
- (173)
- (174) Hernandez, X., Valls-Gabaud, D., & Gilmore, G. 1999, MNRAS, 304, 705
- (175)
- (176) Hodge P.W. 1978, ApJS, 37, 145
- (177)
- (178) Hodge, P. 1989, ARA&A, 27, 139
- (179)
- (180) Hodge, P., Lee, M. G., & Gurwell, M. 1990, PASP, 102, 1245
- (181)
- (182) Hodge P.W., Smith T.R., Eskridge P.B., MacGillivray H.T. & Beard S.M. 1991 ApJ, 369, 372
- (183)
- (184) Holtzman, J. A. et al. 1999, AJ, 118, 2262
- (185)
- (186) Holtzman, J. A., Smith, G. H., & Grillmair, C. 2000, AJ, 120, 3060
- (187)
- (188) Hopkins, A. M., Irwin, M. J., & Connolly, A. J. 2001, ApJ, 558, L31
- (189)
- (190) Hunter, D. A. & Gallagher, J. S. 1986, PASP, 98, 5
- (191)
- (192) Hurley-Keller, D., Mateo, M., & Nemec, J. 1998, AJ, 115, 1840
- (193)
- (194) Ikeuchi, S. 1986, Ap&SS, 118, 509
- (195)
- (196) Irwin, M. & Tolstoy, E. 2002, MNRAS, 336, 643
- (197)
- (198) Kennicutt, R. C. & Skillman, E. D. 2001, AJ, 121, 1461
- (199)
- (200) Kepner, J. V., Babul, A., & Spergel, D. N. 1997, ApJ, 487, 61
- (201)
- (202) Klypin, A., Kravtsov, A. V., Valenzuela, O,, & Prada, F. 1999, ApJ, 522, 82
- (203)
- (204) Koo, D. C. & Kron, R. G. 1992, ARA&A, 30, 613
- (205)
- (206) Kormendy, J. 1985, ApJ, 295, 73
- (207)
- (208) Kroupa P., Tout, C.A. & Gilmore G. 1993 MNRAS, 262, 545
- (209)
- (210) Kurtev R., Georgiev L., Borissova J., Li W.D., Filippenko A.V. & Treffers R.R. 2001 A&A, 378, 449
- (211)
- (212) Kurucz, R.I., 1993, ATLAS9 Stellar Atmospheres Programs and 2 km s-1 grid, (Kurucz CD-ROM No. 13)
- (213)
- (214) Lake G. & Skillman E.D. 1989 AJ, 98, 127
- (215)
- (216) Larson, R. B. 1998, MNRAS, 301, 569
- (217)
- (218) Lee, H., Grebel, E. K., & Hodge, P. W. 2003, A&A, 401, 141
- (219)
- (220) Lee, M. G., Freedman, W. L., & Madore, B. F. 1993, ApJ, 417, 553
- (221)
- (222) Lee, M. G., Freedman, W., Mateo, M., Thompson, I., Roth, M., & Ruiz, M. 1993, AJ, 106, 1420
- (223)
- (224) Li Causi, G., De Marchi, G., & Paresce, F. 2002, PASP, 114, 770
- (225)
- (226) Lilly, S. J. 1993, ApJ, 411, 501
- (227)
- (228) Lilly, S.J., LeFevre, O., Crampton, D., Hammer, F., & Tresse, L. 1995, ApJ, 455, 50
- (229)
- (230) Lin, D. N. C. & Faber, S. M. 1983, ApJ, 266, L21
- (231)
- (232) Lynds, R., Tolstoy, E., O’Neil., E. J., & Hunter, D. A. 1998, AJ, 116, 146
- (233)
- (234) Madau, P., Ferrara, A., & Rees, M. J. 2001, ApJ, 555, 92
- (235)
- (236) Maeder, A. 1992, A&A, 264, 105
- (237)
- (238) Mantegazza, L., Antonello, E., Fugazza, D., Bossi, M., & Covino, S. 2001, A&A, 367, 759
- (239)
- (240) Mateo, M. 1998, ARA&A, 36, 435
- (241)
- (242) Matteucci, F. & Chiosi, C. 1983, A&A, 123, 121
- (243)
- (244) Mayer, L., Governato, F., Colpi, M., Moore, B., Quinn, T., Wadsley, J., Stadel, J., & Lake, G. 2001a, ApJ, 547, L123
- (245)
- (246) Mayer, L., Governato, F., Colpi, M., Moore, B., Quinn, T., Wadsley, J., Stadel, J., & Lake, G. 2001b, ApJ, 559, 754
- (247)
- (248) Mazeh T., Goldberg A., Duquennoy A. & Mayor M. 1992 ApJ, 401, 265
- (249)
- (250) Mighell, K. J. 1990, A&AS, 82, 1
- (251)
- (252) Mighell, K. J. 1997, AJ, 114, 1458
- (253)
- (254) Mighell, K. J. & Rich, R. M. 1996, AJ, 111, 777
- (255)
- (256) Miller, B. W., Dolphin, A. E., Lee, M. G., Kim, S. C., & Hodge, P. 2001, ApJ, 562, 713
- (257)
- (258) Minniti, D. & Zijlstra, A. A. 1997, AJ, 114, 147
- (259)
- (260) Moore, B., Ghigna, S., Governato, F., Lake, G., Quinn, T., Stadel, J., & Tozzi, P. 1999, ApJ, 524, L19
- (261)
- (262) Mori, M., Ferrara, A., & Madau, P. 2002, ApJ, 571, 40
- (263)
- (264) Mould, J. & Aaronson, M. 1983, ApJ, 273, 530
- (265)
- (266) Murakami, I. & Babul, A. 1999, MNRAS, 309, 161
- (267)
- (268) Nath, B. B. & Chiba, M. 1995, ApJ, 454, 604
- (269)
- (270) Nath, B. B. & Trentham, N. 1997, MNRAS, 291, 505
- (271)
- (272) Nicastro, F. et al. 2002, ApJ, 573, 157
- (273)
- (274) Nicastro, F. et al. 2003, Nature, 421, 719
- (275)
- (276) Oh, S. P., Nollett, K. M., Madau, P., & Wasserburg, G. J. 2001, ApJ, 562, L1
- (277)
- (278) Olszewski, E. W., Suntzeff, N. B., & Mateo, M. 1996, ARA&A, 34, 511
- (279)
- (280) Pagel, B.E.J. & Tautvaišienė, G. 1998, MNRAS, 299, 535
- (281)
- (282) Parodi, B. R. & Binggeli, B. 2003, A&A, 398, 501
- (283)
- (284) Peebles, P.J.E. 1993, “Principles of Physical Cosmology”, (Princeton: Princeton Univ. Pr.)
- (285)
- (286) Peimbert, M., Bohigas, J., & Torres-Peimbert, S. 1988, RevMxAA, 16, 45
- (287)
- (288) Pettini, M., Madau, P., Bolte, M., Prochaska, J. X., Ellison, S. L., & Fan, X. 2003, ApJ, in press, astro-ph/0305413
- (289)
- (290) Pettini, M., Shapley, A. E., Steidel, C. C., Cuby, J., Dickinson, M., Moorwood, A. F. M., Adelberger, K. L., & Giavalisco, M. 2001, ApJ, 554, 981
- (291)
- (292) Pisano, D. J., Kobulnicky, H. A., Guzmán, R., Gallego, J., & Bershady, M. A. 2001, AJ, 122, 1194
- (293)
- (294) Price, J. S., Mason, S. F., & Gullixson, C. A. 1990, AJ, 100, 420
- (295)
- (296) Quinn, T., Katz, N., & Efstathiou, G. 1996, MNRAS, 278, L49
- (297)
- (298) Rees, M. J. 1986, MNRAS, 218, 25P
- (299)
- (300) Saha, A., Freedman, W. L., Hoessel, J. G., & Mossman, A. E. 1992, AJ, 104, 1072
- (301)
- (302) Sandage, A. R. 1971, ApJ, 166, 13
- (303)
- (304) Sandage, A., Bell, R. A., & Tripicco, M. J. 1999, ApJ, 522, 250
- (305)
- (306) St-Germain, J., Carignan, C., Côte, S., & Oosterloo, T. 1999, AJ, 118, 1235
- (307)
- (308) Schiavon, R. P., Faber, S. M., Rose, J. A., & Castilho, B. V. 2002, ApJ, 580, 873
- (309)
- (310) Schulte-Ladbeck, R. E., Crone, M. M., & Hopp, U. 1998, ApJ, 493, L23
- (311)
- (312) Schulte-Ladbeck, R. E., Hopp, U., Drozdovsky, I. O., Greggio, L., & Crone, M. M. 2002, AJ, 124, 896
- (313)
- (314) Searle, L. & Sargent, W. L. W. 1972, ApJ, 173, 25
- (315)
- (316) Skillman, E. D., & Gallart, C., 2003, in Observed HR Diagrams and Stellar Evolution: The Interplay Between Observational Constraints and Theory, eds. T. Lejeune and J. Fernandes, ASP Conf. Ser. 274, in press
- (317)
- (318) Skillman, E. D. & Bender, R. 1995, Revista Mexicana de Astronomia y Astrofisica Conference Series, 3, 25
- (319)
- (320) Skillman, E. D., Côté, S., & Miller, B. W. 2003, AJ, 125, 593
- (321)
- (322) Skillman, E. D., Kennicutt, R. C., & Hodge, P. W. 1989, ApJ, 347, 875
- (323)
- (324) Skillman, E. D., Terlevich, R., Teuben, P. J., & van Woerden, H. 1988, A&A, 198, 33
- (325)
- (326) Smecker-Hane, T. A., Cole, A. A., Gallagher, J. S., & Stetson, P. B. 2002, ApJ, 566, 239
- (327)
- (328) Smecker-Hane, T. A., Stetson, P. B., Hesser, J. E., & Lehnert, M. D. 1994, AJ, 108, 507
- (329)
- (330) Somerville, R. S. 2002, ApJ, 572, L23
- (331)
- (332) Songaila, A. 2001, ApJ, 561, L153
- (333)
- (334) Spergel, D. N., et al. 2003, astro-ph/0302209
- (335)
- (336) Stanimirović, S., Dickey, J. M., Krčo, M., & Brooks, A. M. 2002, ApJ, 576, 773
- (337)
- (338) Stoehr, F., White, S. D. M., Tormen, G., & Springel, V. 2002, MNRAS, 335, L84
- (339)
- (340) Tassis, K., Abel, T., Bryan, G. L., & Norman, M. L. 2003, ApJ, 587, 13
- (341)
- (342) Tegmark, M., Silk, J., Rees, M. J., Blanchard, A., Abel, T., & Palla, F. 1997, ApJ, 474, 1
- (343)
- (344) Thoul, A. A. & Weinberg, D. H. 1996, ApJ, 465, 608
- (345)
- (346) Tolstoy, E. 1996, ApJ, 462, 684
- (347)
- (348) Tolstoy, E. 1999, Ap&SS, 265, 1999
- (349)
- (350) Tolstoy, E. et al. 1998, AJ, 116, 1244
- (351)
- (352) Tolstoy, E. & Saha, A. 1996, ApJ, 462, 672
- (353)
- (354) Tolstoy, E., Venn, K. A., Shetrone, M., Primas, F., Hill, V., Kaufer, A., & Szeifert, T. 2003, AJ, 125, 707
- (355)
- (356) Tosi, M., Greggio, L., Marconi, G., & Focardi, P. 1991, AJ, 102, 951
- (357)
- (358) Tosi, M., Sabbi, E., Bellazzini, M., Aloisi, A., Greggio, L., Leitherer, C., & Montegriffo, P. 2001, AJ, 122, 1271
- (359)
- (360) Trentham, N. 1994, Nature, 372, 157
- (361)
- (362) Trentham, N. & Hodgkin, S. 2002, MNRAS, 333, 423
- (363)
- (364) Tully, R. B., Somerville, R. S., Trentham, N., & Verheijen, M. A. W. 2002, ApJ, 569, 573
- (365)
- (366) Tyson, J. A. 1988, AJ, 96, 1
- (367)
- (368) Tyson, N. D. & Scalo, J. M. 1988, ApJ, 329, 618
- (369)
- (370) Valdez-Gutiérrez, M., Rosado, M., Georgiev, L., Borissova, J., & Kurtev, R. 2001, A&A, 366, 35
- (371)
- (372) van den Bergh, S. 1979, ApJ, 230, 95
- (373)
- (374) van den Bergh, S. 1994a, AJ, 107, 1328
- (375)
- (376) van den Bergh, S. 1994b, ApJ, 428, 617
- (377)
- (378) van den Bergh, S. 2000a, “The Galaxies of the Local Group”, Cambridge University Press
- (379)
- (380) van den Bergh, S. 2000b, PASP, 112, 932
- (381)
- (382) White, S. D. M. & Rees, M. J. 1978, MNRAS, 183, 341
- (383)
- (384) Wyder, T. K. 2001, AJ, 122, 2490
- (385)
- (386) Wyder T.K., Hodge P.W., & Cole, A.A. 2000, PASP, 112, 594
- (387)
- (388) Yi, S. K., Kim, Y., & Demarque, P. 2003, ApJS, 144, 259
- (389)
- (390) Yi, S., Demarque, P., Kim, Y., Lee, Y., Ree, C. H., Lejeune, T., & Barnes, S. 2001, ApJS, 136, 417
- (391)
- (392) York, D.G., et al. 2000, AJ, 120, 1579
- (393)
- (394) Young, L. M. & Lo, K. Y. 1996, ApJ, 462, 203
- (395)
- (396) Young, L. M. & Lo, K. Y. 1997, ApJ, 490, 710
- (397)
| Feature | N(central) | N(outer) | Ratio |
|---|---|---|---|
| Main Sequence (V 24.5) | 2023 | 240 | 8.4 0.6 |
| Red Supergiants | 521 | 69 | 7.6 1.0 |
| Blue Loop | 681 | 102 | 6.7 0.7 |
| Red Clump (23.1 I 24.5) | 8333 | 1434 | 5.8 0.2 |
| RGB (I 23.1) | 1890 | 344 | 5.5 0.3 |