A preference for a non-zero neutrino mass from cosmological data
Abstract
We present results from the analysis of cosmic microwave background (CMB), large scale structure (galaxy redshift survey) and X-ray galaxy cluster (baryon fraction and X-ray luminosity function) data, assuming a geometrically flat cosmological model and allowing for tensor components and a non-negligible neutrino mass. From a combined analysis of all data, assuming three degenerate neutrinos species, we measure a contribution of neutrinos to the energy density of the universe, (68 per cent confidence limits), with zero falling on the 99 per cent confidence limit. This corresponds to per cent of the total mass density of the Universe and implies a species-summed neutrino mass eV, or 0.2 eV per neutrino. We examine possible sources of systematic uncertainty in the results. Combining the CMB, large scale structure and cluster baryon fraction data, we measure an amplitude of mass fluctuations on Mpc scales of , which is consistent with measurements based on the X-ray luminosity function and other studies of the number density and evolution of galaxy clusters. This value is lower than that obtained when fixing a negligible neutrino mass (). The combination of CMB, large scale structure and cluster baryon fraction data also leads to remarkably tight constraints on the Hubble constant, , mean matter density, and physical baryon density, , of the Universe.
keywords:
cosmic microwave background — cosmological parameters — dark matter — large-scale structure of the universe — X-rays: galaxies: clusters1 Introduction
The first results from the Wilkinson Microwave Anisotropy Probe (WMAP; Bennett et al. 2003; Spergel et al. 2003) have confirmed, at high statistical significance, what has become known as the ‘standard’ cosmological model. We appear to live in an approximately flat, vacuum energy dominated universe, with a mean matter density and Hubble constant , that was seeded by predominantly adiabatic, Gaussian primordial fluctuations.
The initial papers from the WMAP team concentrated on results extracted from the WMAP data alone, and on results obtained by combining the WMAP and other cosmic microwave background (CMB) data with information from the 2dF Galaxy Redshift Survey (2dFGRS) and observations of the Lyman- forest. In this paper, we present results based on similar CMB and 2dFGRS data, but drop the Lyman- forest constraints. Instead, we include constraints provided by the baryonic mass fraction in X-ray luminous, dynamically relaxed galaxy clusters studied with the Chandra Observatory, and constraints obtained from the local X-ray luminosity function (XLF) of the most X-ray luminous galaxy clusters (Allen et al. 2002, 2003).
Neutrinos are fundamental particles of the Standard Model of particle physics, and their masses have significant implications. Experiments to observe neutrino oscillations have shown there to be small, but non-zero, mass squared differences between three neutrino mass eigenstates (e.g. Fukuda et al. 1998; Ahmad et al. 2002; Eguchi et al. 2003). If the lowest eigenstate has zero mass then these differences imply a mass of eV for at least one of the remaining two mass eigenstates. Due to the effect of the neutrino mass on the growth of structure in the Universe, cosmological observations are sensitive to the neutrino mass density. So far, only upper limits have been obtained from cosmological observations. The WMAP team (Spergel et al. 2003) found eV per neutrino (95 per cent confidence) from combining CMB, 2dFGRS and Lyman- forest data, assuming three neutrino species of degenerate mass (see Elgaroy & Lahav 2003 for a more detailed discussion of the assumptions).
Our primary motivation for this work was to compare and combine the constraints from the new CMB and X-ray cluster data, with particular attention being paid to the linearly-evolved amplitude of mass fluctuations. Whereas the CMB data probe large to intermediate length scales in the early universe (), the XLF constraints are much more local () and probe intermediate length scales. These different properties also make the combination of CMB and XLF data well suited to examining the contribution of neutrinos to the mass density of the universe.
The amplitude of spatial fluctuations in the mass density is a strong function of both scale and epoch. Conventionally, the amplitude of fluctuations is quoted on an intermediate length scale at the present day (z=0): is the root-mean-square matter fluctuation within Mpc spheres, calculated using linear theory. As discussed by e.g. Efstathiou & Bond (1999), there are a large number of different (degenerate) combinations of parameters that can give almost identical CMB power spectra, most importantly (assuming a flat universe) the Hubble constant, , the neutrino mass density, , and the mean matter density in units of the critical density, . Current CMB data alone cannot, therefore, provide strong constraints on (Spergel et al. 2003, Bridle et al. 2003).
Although the normalization of the CMB power spectrum on large scales is insensitive to the neutrino mass, allowing for the presence of massive neutrinos will lower the value of inferred from the CMB data. This is because massive neutrinos affect the growth of fluctuations on small scales at late times ( being calculated at the present day). Conversely, whereas the number density of galaxy clusters in the local universe is sensitive to the neutrino mass, the value of inferred from the XLF observations is only mildly affected, since the length scale probed by clusters is very similar to Mpc.
Given an accurate measurement of , the cluster XLF data can yield a precise determination of . can be obtained from measurements of the baryonic gas mass fraction, , in large, dynamically relaxed clusters of galaxies, together with results on the Hubble constant and mean baryon density of the Universe from the ratio of first to second peak heights in the CMB temperature angular power spectrum. Thus, the combination of CMB, and cluster XLF data can together yield an estimate of the neutrino mass.
Our approach in constraining the neutrino mass is similar to that described by Fukugita, Liu & Sugiyama (2000). A number of earlier papers have also placed limits on the neutrino mass using the observed slope of the galaxy (and by assumption matter) power spectrum obtained from the 2dFGRS, which is sensitive to a combination of cosmological parameters (see Elgaroy et al. 2002, Elgaroy & Lahav 2003, Hannestad 2003 and references therein). We show that including the 2dFGRS constraint is helpful in constraining the neutrino mass, but not essential to our analysis.
2 Method
2.1 Analysis of the CMB and large scale structure data
Our analysis of CMB observations uses the WMAP temperature (TT) data for multipoles (Hinshaw et al. 2003) and temperature-polarization (TE) data for (Kogut et al. 2003). To extend the analysis to higher multipoles (smaller scales), we also include data from the Cosmic Background Imager (CBI; Pearson et al. 2003) and Arcminute Cosmology Bolometer Array Receiver (ACBAR; Kuo et al. 2003) for . The comparison of model angular power spectra with the WMAP data employs the likelihood calculation routines released by the WMAP team (Verde et al. 2003).
For part of the analysis, we also include large scale structure data from the 2dFGRS. We use the power spectrum obtained from the first 147,000 redshifts of the survey, covering scales , where non-linear effects are thought to be negligible (Percival et al. 2002). Over this range, we assume that the 2dFGRS power spectrum is directly proportional to the matter power spectrum at , marginalizing over the constant of proportionality using a wide prior.
Our analysis of the CMB and 2dFGRS data uses the CosmoMC code111http://cosmologist.info/cosmomc/. This in turn uses CAMB (Lewis, Challinor & Lasenby 2000), which is based on CMBFAST (Seljak & Zaldarriaga 1996), to generate the CMB and matter power spectrum transfer functions, and a Metropolis-Hastings Markov Chain Monte Carlo (MCMC) algorithm to explore parameter space. We used the covariance matrix of the parameters to improve sampling efficiency (see Lewis & Bridle 2002 for more details).
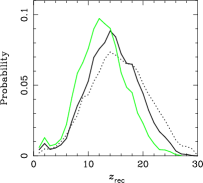
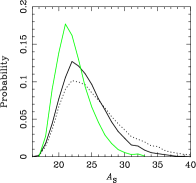
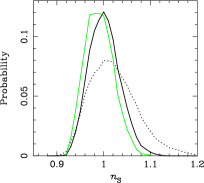
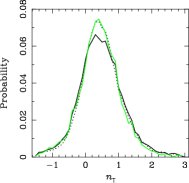
We have fitted the data using a cosmological model with nine free parameters: the physical dark (cold+hot) matter and baryon densities in units of the critical density, and , the Hubble constant , the neutrino mass fraction , the recombination redshift (at which the reionization fraction is a half, assuming instantaneous reionization), the amplitude of the scalar power spectrum , the scalar and tensor spectral indexes and , and the ratio of the normalization of tensor and scalar components , where is evaluated at and is evaluated at . We assume three neutrinos of degenerate (equal) mass throughout. Each parameter had a wide uniform prior applied. We assume a flat geometry with a cosmological constant (=1).
The analysis was carried out on the Cambridge X-ray group Linux cluster. For our main analyses of the CMB and CMB+2dFGRS data, using the nine-parameter model and allowing for massive neutrinos and tensors, we accumulated at total of correlated samples in 10 separate chains. In order to investigate the effects of neutrinos and tensors in detail, we also carried out two additional runs in which the neutrino density and tensor amplitude ratio were separately fixed to zero ( and , respectively). For these runs, we accumulated samples in 6 separate chains. We satisfied ourselves that the chains had converged by ensuring that consistent final results were obtained from numerous small subsets of the chains. In all cases, we allowed a conservative burn-in period of samples.
2.2 Importance sampling using the X-ray cluster constraints

In order to obtain improved results on cosmological parameters we have importance sampled the CMB and CMB+2dFGRS MCMC results, applying further, independent constraints based on X-ray studies of galaxy clusters. Firstly, we applied constraints from the observed X-ray gas mass fraction, , in dynamically relaxed clusters. These data provide one of the most simple and robust cosmological probes currently available, constraining a combination of , and . We have used the data and methods of Allen, Schmidt & Fabian (2002) and Allen et al. (2003). The data are drawn from Chandra observations of X-ray luminous, dynamically relaxed clusters spanning the redshift range . Consistent measurements of the mass profiles in the clusters are available from X-ray and gravitational lensing methods in most cases, keeping systematic uncertainties to a minimum.
Each of the MCMC samples obtained from the CMB and CMB+2dFGRS analyses provides values for , and . Using these values, we fit the observed data with the model function (Allen et al. 2002)
| (1) |
where , and define the reference cosmology used for the measurements. The X-ray gas dominates the baryonic mass content of the clusters and the factor converts the X-ray gas mass into the total baryonic mass (Fukugita, Hogan & Peebles 1998). The quantity is a bias factor, motivated by gasdynamical simulations which suggest that the baryon fraction in clusters is slightly lower than for the universe as a whole (e.g. Cen & Ostriker 1994; Eke, Navarro & Frenk 1998; Bialek et al. 2001). We use the results of Eke et al. (1998) from simulations of 10 X-ray luminous, massive clusters to constrain . Excluding the data for the most dynamically active cluster in the study of Eke et al. (1998; recall that the data are drawn from Chandra observations of dynamically relaxed systems), the simulated clusters show consistent, relatively flat baryonic mass fraction profiles for radii (Fig 1). At , a radius comparable to the measurement radius for the Chandra observations, the simulations of Eke et al. (1998) give .
Employing a Gaussian prior on the bias factor and fitting the model described by Eq. 1, we obtain a value for each of the MCMC samples. The weight of the MCMC samples is then multiplied by . Note that we assume that the effect of massive neutrinos on the constraints is negligible, which would be true if the neutrino to dark matter ratio within the galaxy clusters were typical of the universe as a whole. However, even in the most extreme case in which neutrinos completely avoid galaxy clusters, in the pre-factor of Eq. 1 need only be replaced by . Since we find from this work, even this extreme case would only increase by and have negligible effect on our conclusions regarding the neutrino mass.
Secondly, we have also importance sampled the MCMC results applying additional constraints from the observed, local X-ray luminosity function (XLF) of galaxy clusters. For this analysis, we use the results of Allen et al. (2003; see Fig. 3 of that paper), which are based on the XLF for the most X-ray luminous () galaxy clusters within redshift observed in the ROSAT All-Sky Survey (Ebeling et al. 2000; Böhringer et al. 2002), and a mass-luminosity relation determined from Chandra X-ray and weak lensing observations. The XLF results constrain the combination of and . To importance sample, we multiply the weight of each of the MCMC samples by the probability of that , parameter pair from the analysis of Allen et al. (2003).
3 Results
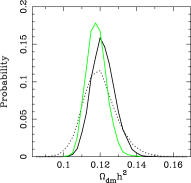
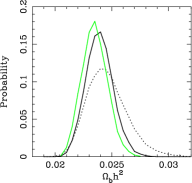
The marginalized results on cosmological parameters obtained from the analysis of the CMB+2dF, CMB+2dF+, CMB+2dF+XLF, CMB++XLF, and CMB+2dF++XLF data, using the nine parameter model with the neutrino mass fraction and tensor amplitude ratio included as free parameters, are summarized in Table 1. This table also lists the values of other quantities that can be derived from the parameter values: the matter density in units of the critical density, (), the linearly-evolved amplitude of mass fluctuations on 8Mpc scales, , the physical neutrino density in units of the critical density, , and the optical depth to reionization, .
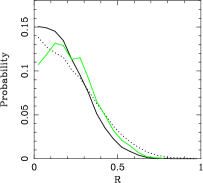
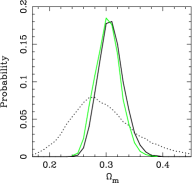
The marginalized, posterior probability distributions for the parameters are also shown in Fig. 2. The results obtained from the additional runs with the neutrino mass fraction, and then the tensor amplitude ratio, fixed to zero are, in general, consistent with those listed in Table 1. The most notable exception to this is the result on in the case of a negligible neutrino mass, which is discussed below. We note, however, that the run without tensors gives peak-probability values for , , , and that are slightly lower (and a result on that is slightly higher) than the tabulated values, although consistent within 68 per cent uncertainties. We also note that the limit on the ratio of the scalar to tensor amplitudes is constrained more tightly in the case ( at 95 per cent confidence).
| CMB+2dF | CMB+2dF+ | CMB+2dF+XLF | CMB++XLF | CMB+2dF++XLF | |
|---|---|---|---|---|---|
3.1 The cosmic neutrino density and amplitude of mass fluctuations
Two of the more interesting results to come from the analysis are the effects of allowing for massive neutrinos on the present day, linearly-evolved amplitude of mass fluctuations, , and the implied contribution of such neutrinos to the energy density of the universe, .
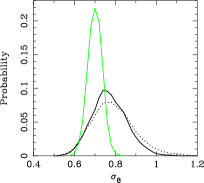
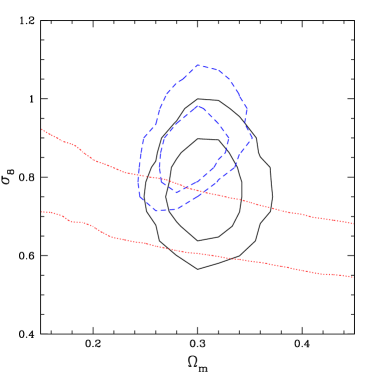
Fig. 3 shows the joint 68.3 and 95.4 per cent confidence limits on and obtained from the CMB+2dF+ data. The independent constraints from the cluster XLF are also shown overlaid. In the absence of massive neutrinos (), we obtain a marginalized result on the amplitude of mass fluctuations from the CMB+2dF+ data of (dashed curve in Fig. 3), which is only marginally consistent with the cluster XLF constraints. When the neutrino density is included as a free parameter, however, the agreement with the XLF results is improved significantly, with a marginalized result on from the CMB+2dF+ data of (solid curve in Fig. 3. A similar degeneracy between and is visible in the analysis of pre-WMAP CMB (and other) data by Lewis & Bridle 2003). We note that the effects of neutrinos on the cluster XLF analysis are negligible, reducing the measured value of by only per cent from the no-neutrino case (see Section 4).
The marginalized results on from the CMB+2dF+ data are also consistent with those obtained from other recent studies of the number density and evolution of galaxy clusters, which generally find for (e.g. Borgani et al. 2001; Reiprich & Böhringer 2002; Viana, Nichol & Liddle 2002; Schuecker et al. 2003; Pierpaoli et al. 2003; Voevodkin & Vikhlinin 2003 and references therein) as well as some of the more recent measurements of cosmic shear on large angular scales (Brown et al. 2003; Jarvis et al. 2003 and references therein). We caution, however, that some other cosmic shear studies (e.g. Van Waerbeke et al. 2002; Refregier, Rhodes & Groth 2002) have inferred higher values of , for .
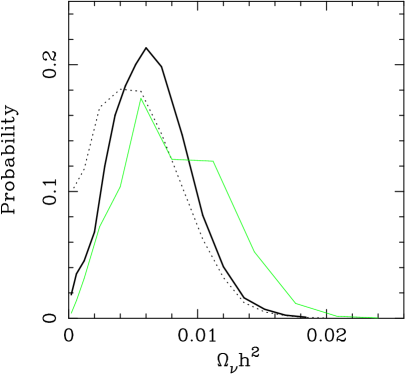

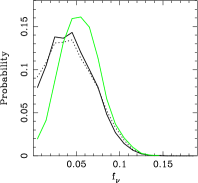
Fig. 4(a) shows the constraints on obtained from various combinations of the data, as described in Table 1. Using the CMB+2dF+ data, we measure a neutrino density , with a 95.4 per cent confidence upper limit of (or ; the same upper limit is also obtained using only the CMB+2dF data.) For the full CMB+2dF++XLF data set, we obtain , with the region between and the corresponding equi-probability upper value for containing 99 per cent of the probability. Finally, for the CMB++XLF data, we find , with at more than 99 per cent confidence. We thus see that including the 2dFGRS constraint is helpful in the analysis, but not essential to our detection of a non-zero neutrino mass. Our most probable result on the neutrino density from the CMB++XLF and CMB+2dF++XLF data sets corresponds to per cent of the critical value required for closure.
Fig. 4(b) shows how the results on are modified when we exclude the presence of tensor components. In this case, the full CMB+2dF++XLF data set gives . Although the most probable value for is reduced when we exclude tensor components, we still find at 93 per cent confidence.
The results on can be converted into a constraint on the neutrino mass, summed over species, using the relation . For the full CMB+2dF++XLF data set, we find eV.
Our result on the contribution of neutrinos to the energy density of the universe differs slightly from that reported by the WMAP team, (95 per cent confidence limit; Spergel et al. 2003). The primary reason for this difference is the inclusion of Lyman- forest data in the WMAP team’s analysis (see discussions in Elgaroy & Lahav 2003 and Hannestad 2003) and the inclusion of cluster XLF data in ours. Our results are, however, consistent with those of 2dFGRS team: eV (Elgaroy et al. 2002; Hannestad 2003) as well as those of Lewis & Bridle (2003) and Slosar et al. (2003) from the analysis of pre-WMAP CMB, 2dFGRS and other data using MCMC techniques.
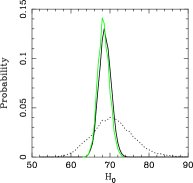
3.2 The Hubble constant and mean matter density
Our results on the Hubble constant are in good agreement with, but more tightly constrained than, that from the Hubble Key Project (; Freedman et al. 2001). Including the neutrino energy density as a free parameter, our analysis of the CMB+2dF data gives . The introduction of the Chandra data improves this constraint significantly, to . For the full CMB+2dF++XLF data set, we find .
The introduction of the data also leads to significant improvements in our measurements of the mean matter and baryon densities. As can be seen from Table 1, the combination of CMB+2dF data gives a per cent uncertainty on and an eight per cent uncertainty on . The introduction of the data improves these constraints to seven per cent on and five per cent on . The further inclusion of the XLF data makes little difference to the results, providing us with final answers of and . The improvement in the constraints on and obtained with the introduction of the Chandra data can be clearly seen in Fig. 5.
We note that the tight constraints on , and are primarily due to the combination of CMB and data. From an analysis of these two data sets alone, we find , and .
4 Discussion
The main result of this paper is the tentative detection of a non-negligible neutrino mass. Recent years have seen significant progress in our understanding of neutrinos from particle physics. The Large Electron Positron Collider (LEP) and Stanford Linear Accelerator Centre Linear Electron-Positron Collider (SLC) showed there to be three light, active neutrino species (electron, muon, tau). Solar and atmospheric neutrino experiments such as Super-Kamiokande, the Sudbury Neutrino Observatory and Kamland (Fukuda et al. 1998; Ahmad et al. 2002; Eguchi et al. 2003) have since provided strong evidence for oscillations between these neutrino species, and determined two of the mass-squared differences to be eV2 and eV2. Given the relatively small mass-squared differences, the result on the species-summed neutrino mass presented here, eV (for the CMB+2dF++XLF data) implies an approximately degenerate neutrino mass. Writing and setting (assuming an absence of further, heavy sterile neutrino species), we obtain eV. Note, however, that our results are also marginally consistent with indications from the Liquid Scintillator Neutrino Detector experiment (Aguilar et al. 2001) for the presence of sterile neutrinos.
Our results are consistent with the upper limit on the electron neutrino mass, eV (95 per cent confidence limit), from laboratory tritium beta decay end-point experiments (Weinheimer et al. 1999; Bonn et al. 2002). We note that our results are also consistent with the neutrino mass inferred from Z-burst models (Fargion, Mele & Salis 1999; Weiler 1999) for ultrahigh energy cosmic rays, eV (Fodor, Katz & Ringwald 2001; assuming an extragalactic origin for the cosmic rays), some indications from neutrinoless double beta decay experiments, eV (Klapdor-Kleingrothaus et al. 2002; although see also Aalseth et al. 2002; Feruglio, Strumia & Vissani 2002) and the neutrino mass range inferred from anthropic arguments by Tegmark & Vilenkin (2003).
As was discussed in Section 1, our result on the neutrino mass density originates primarily from the fact that the XLF provides a robust constraint on for a given value of , while the CMB data predict as a function of the neutrino mass. The primary effect of the introduction of massive neutrinos is to suppress the formation and growth of structure on small scales ( Mpc-1; Hu, Eisenstein & Tegmark 1998). The large momenta of such neutrinos prevents them from clustering with the cold mass components and they stream freely. The suppression of the matter power spectrum as a function of scale in the case of massive neutrinos, relative to the massless neutrino case, is shown in Fig. 6.

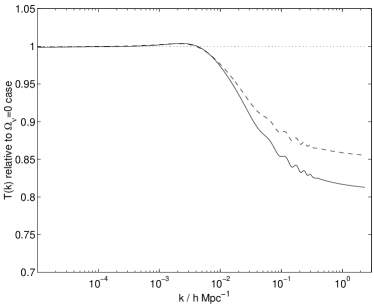
Since the CMB data normalize the power spectrum primarily on large scales, the amplitude of fluctuations on (relatively small) Mpc scales, , inferred from the CMB data will always be smaller in the presence of massive neutrinos ( per cent smaller for ; Fig 6). In contrast, the value of inferred from the cluster XLF analysis is relatively insensitive to massive neutrinos, since clusters measure the power on scales similar to Mpc. (The mean length scale corresponding to the virial masses of the clusters in the XLF study of Allen et al. 2003 is Mpc.) For , the value of inferred from the XLF study is reduced by only per cent when accounting for the effects of the neutrinos.
We note that on scales significantly smaller than those of clusters, accounting for the presence of neutrinos at the measured level will increase the inferred value of by a small amount ( per cent for measurements on Mpc scales, for ). This may be relevant to studies of cosmic shear and the Lyman forest. Note, however, that non-linear corrections to the matter power spectrum also become important on such scales (e.g. Smith et al. 2003).
In what follows, we examine the most significant assumptions and systematic uncertainties affecting our result on the neutrino mass. These primarily concern the data sets used and the parameters varied in the analysis.
Reliability of XLF constraints. As was mentioned above, the result on as a function of from the cluster XLF study is crucial to our measurement of the neutrino mass. Systematic uncertainties in the XLF analysis are discussed by Allen et al. (2003). The main uncertainty in that work lies in the mass-luminosity relation used to convert model mass functions into X-ray luminosity functions, which are then compared with the observations. Allen et al. (2003) find for , accounting for uncertainties in the normalization, slope and scatter of the mass-luminosity relation. Replacing the Allen et al. (2003) XLF constraints with a Gaussian probability density function (pdf) with leads to similar results on the neutrino mass.
We have examined the effects on the measured neutrino mass of introducing additional, systematic offsets in the mass-luminosity relation. For example, replacing the Allen et al. (2003) XLF constraints with a Gaussian pdf with (which corresponds to raising the normalization of the mass-luminosity curve by a factor ) reduces the neutrino mass inferred from the CMB+2dF++(replaced) XLF data to eV. Conversely, lowering the normalization of the mass-luminosity relation by a similar factor using a Gaussian pdf with increases the neutrino mass to eV. (Note that the inclusion of the CMB+ data maintains .)
The results on the neutrino mass are not sensitive to moderate changes in the uncertainty in from the XLF data. Approximately doubling the uncertainty in using a Gaussian pdf with still gives eV with at more than per cent confidence for the CMB+2dF++(replaced) XLF data (allowing for tensor components). Only if the uncertainty in is quadrupled from its nominal value of 0.04 does the detection of a non-zero neutrino mass drop below the 95 per cent confidence level.
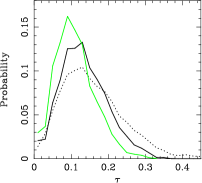
Reliability of CMB polarization data. The CMB temperature-polarization correlation power spectrum helps to constrain the optical depth to reionization, . The most probable values for found from this analysis and by the WMAP team (Kogut et al. 2003; Spergel et al. 2003) are higher than were expected prior to the release of the WMAP results. If we were to exclude the CMB polarization data, then the CMB would constrain only the degenerate combination . Since this product decreases with increasing , the CMB+2dF+ constraint could also be matched with the XLF constraint on if the value of were lowered. For example, if we constrain in the analysis of the CMB+2dF+ data, then we obtain . In this case, when combining with the XLF data, a negligible neutrino mass falls on the instead of per cent confidence limit.
We note that the measured optical depth to reionization, from our default analysis of the full CMB+2dF++XLF data set, is lower, and has larger uncertainties, than the value quoted in the abstracts of the WMAP papers (; Kogut et al. 2003; Spergel et al. 2003). Taken together with the constraints on , our results may be slightly easier to explain within the context of standard UV reionization models, even allowing for the suppression of power on small scales due to the free-streaming action of massive neutrinos.
Reliability of the 2dFGRS. The 2dFGRS constraints used in this paper rely on the assumption of linear bias. This issue was discussed by Elgaroy & Lahav (2003). However, the main point here is that our result on the neutrino mass is largely unchanged when removing the 2dFGRS constraint (Section 3.1).
The effect of tensors. Including the presence of primordial gravity waves in our analysis increases power on the largest scales. This is reflected by the fact that a fit to the CMB+2dF++XLF data in the presence of tensor components gives a slightly higher scalar spectral index, , than is obtained in the absence of tensors . The higher scalar spectral index in the presence of tensors slightly increases the power on intermediate scales, relative to the largest scales and, therefore, also slightly increases the neutrino mass relative to the no-tensors case. However, the detection of a non-zero neutrino mass in the absence of tensors remains significant (Section 3.1).
We note that the most probable scalar spectral index obtained from our analysis is consistent with standard inflation models. The ratio of the tensor to scalar components is also consistent with single-field, slow-roll inflation ().
The effect of a running spectral index. There has been recent speculation about a non-power law primordial power spectrum. Evidence for a running spectral index was found by Spergel et al. (2003), when the WMAP and other CMB data were combined with 2dFGRS and Lyman- forest constraints. It is interesting to consider whether our constraint on a significant neutrino mass could be negated by allowing for a non-zero value of . For the CMB+2dF+ data, we find an value consistent with that of Spergel et al. (2003), but with wider error bars (assuming a negligible neutrino mass). This is mainly due to the fact that we do not use the Lyman- forest data in our analysis. However, we find that although the constraint on is widened when including as a free parameter, the lower limit on is hardly changed. This acts in an opposite sense to allowing freedom in the neutrino mass and does not improve the agreement between CMB+2dF+ and XLF constraints shown in Fig. 3.
The effect of quintessence. We can lower the value of allowed by the CMB data if we increase the dark energy equation of state parameter, , above the cosmological constant-like value of (see e.g. Bridle et al. 2003b). Repeating the analysis of CMB data, but replacing the free neutrino mass by a free equation of state parameter, we obtain for . However, such a solution is disfavoured by the combination of CMB+ data, which prefer a value for . Our result on quintessence is in line with supernovae studies, which also require for (Tonry et al. 2003).
In future work, we will examine in more detail the constraints that the combination of CMB and X-ray cluster data can place on the dark energy density and .
Acknowledgements
We thank G. Efstathiou for the suggestion to examine the cosmological constraints that can be obtained from the combination of CMB and X-ray galaxy cluster data. We thank G. Efstathiou, O. Elgaroy, A. Fabian, A. Lewis and J. Ostriker for helpful discussions. We are grateful to A. Lewis for making the CosmoMC code publicly available and V. Eke for communicating the results from his simulations. The CMB+2dF chains with variable are taken from Bridle et al. (2003a). We thank the members of the X-ray group at the Institute of Astronomy for their generosity with computing power and R. Johnstone for help with optimizing the codes. SWA acknowledges the support of the Royal Society.
References
- [1] Aalseth C.E. et al. , 2002, Mod. Phys. Lett., A17, 1475
- [2] Aguilar A. et al. , 2001, Phys. Rev. D., 64, 112007
- [3] Ahmad Q.R. et al. , 2002, Phys. Rev. Lett, 89, 011301
- [4] Allen S.W., Schmidt R.W., Fabian A.C., 2002, MNRAS, 334, L11
- [5] Allen S.W., Schmidt R.W., Fabian A.C., Ebeling, 2003, MNRAS, 342, 287
- [6] Bennett C.L. et al. , 2003, ApJ, in press, (astro-ph/0302207)
- [7] Bialek J.J., Evrard A.E., Mohr J.J., 2001, ApJ, 555, 597
- [8] Böhringer H. et al. 2002, ApJ, 566, 93
- [9] Bonn J., et al. 2002, Nucl. Phys. B Proc. Suppl., 110, 395
- [10] Borgani S. et al. , 2001, ApJ, 561, 13
- [11] Bridle S.L, Lewis A.M., Weller J., Efstathiou G., 2003a, MNRAS, in press (astro-ph/0302306)
- [12] Bridle S.L, Lahav O., Ostriker J.P., Steinhardt P.J., 2003b, Science, 1532
- [13] Cen R., Ostriker J.P., 1994, ApJ, 429, 4
- [14] Ebeling H., Edge A.C., Allen S.W., Crawford C.S., Fabian A.C., Huchra J.P., 2000, MNRAS, 318, 333
- [15] Efstathiou G., Bond J.R., 1999, MNRAS, 304, 75
- [16] Eguchi K. et al. , 2003, Phys. Rev. Lett, 90, 021802
- [17] Eke V.R., Navarro J.F., Frenk C.S., 1998, ApJ, 503, 569
- [18] Elgaroy O., Lahav O., 2003, JCAP, 04, 004
- [19] Elgaroy et al. 2002, Phys. Rev. Lett, 89, 061301
- [20] Fargion D., Mele B., Salis A., 1999, ApJ, 517, 725
- [21] Feruglio F., Strumia A., Vissani F., 2002, Nucl. Phys., B637, 345
- [22] Fodor Z., Katz S.D., Ringwald A., 2002, Phys. Rev. Lett., 88, 171101
- [23] Freedman W. et al. , 2001, ApJ, 553, 47
- [24] Fukuda Y. et al. , 1998, Phys. Rev. Lett, 82, 2430
- [25] Fukugita M., Hogan C.J., Peebles P.J.E., 1998, ApJ, 503, 518
- [26] Fukugita M., Liu G-C., Sugiyama N., 2000, Phys. Rev. Lett, 84, 1082
- [27] Hannestad S., 2003, JCAP, 05, 004
- [28] Hinshaw G. et al. , 2003, ApJ, submitted (astro-ph/0302217)
- [29] Hu W., Eisenstein D.J., Tegmark M., 1998, Phys. Rev. Lett, 80, 5255
- [30] Klapdor-Kleingrothaus H.V., Dietz A., Harney H.L., Krivosheina I.V., 2002, Mod. Phys. Lett. A, 16, 2409
- [31] Kogut A. et al. , 2003, ApJ, submitted (astro-ph/0302213)
- [32] Kuo C.L. et al. 2003, ApJ, submitted (astro-ph/0212289)
- [33] Lewis A., Bridle S., 2002, Phys. Rev. D, 66, 103511
- [34] Lewis A., Challinor A., Lasenby A., 2000, ApJ, 538, 473
- [35] Pearson T.J. et al. 2003, ApJ, in press (astro-ph/0205388)
- [36] Percival W.J. et al. , 2002, MNRAS, 337, 1068
- [37] Refregier A., Rhodes J., Groth E.J., 2002, ApJL, 572, L131
- [38] Reiprich T.H., Böhringer H., 2002, ApJ, 567, 716
- [39] Seljak U., Zaldarriaga M., 1996, ApJ, 469, 437
- [40] Slosar A. et al. 2003, MNRAS, 341, 29
- [41] Smith R.E. et al. 2003, MNRAS, 341, 1311
- [42] Spergel D.N. et al. 2003, ApJ, in press (astro-ph/0302209)
- [43] Tegmark M., Vilenkin A., 2003, astro-ph (0304536)
- [44] Tonry J.L. et al. 2003, ApJ, in press (astro-ph/0305008)
- [45] Van Waerbeke, L, Mellier Y., Pello R., Pen U.-L., McCracken H.J., Jain B., 2002, A&A, 393, 369
- [46] Verde L. et al. , 2003, ApJ, in press (astro-ph/0302218)
- [47] Viana P.T.P., Nichol R.C., Liddle A.R., 2002, ApJ, 569, L75
- [48] Voevodkin A., Vikhlinin A., 2003, ApJ, submitted (astro-ph/0305549)
- [49] Weiler T.J., 1999, Astropart. Phys., 11, 303
- [50] Weinheimer C., Degenddag B., Bleile A., Bonn J., Bornschein O., Kazachenko O., Kovalik A., Otten E.W., 1999, Phys. Lett. B, 460, 219