Chandra observations of the X-ray luminous star-forming galaxy
merger Arp 299
Abstract
We report results of a Chandra observation of the X-ray luminous star-forming galaxy Arp299 (NGC3690/IC694). We detect 18 discrete X-ray sources with luminosities above erg s-1 (0.5-8.0 keV band), which contribute of the total galactic emission in this band. The remaining emission is associated with a diffuse component spatially coincident with regions of widespread star-formation. We detect X-ray emission from both nuclei. One of the discrete sources within the complex nuclear region of NGC 3690 is found to have a very hard spectrum and therefore we associate it with the origin of the AGN-like spectrum that has also been detected at high X-ray energies using Beppo-SAX.
1 Introduction
Arp299 is one of the nearest (D=40.4 Mpc111Throughout this paper we assume an and ) Luminous Infrared Galaxies (LIRGs; Sanders & Mirabel 1996; ) and is therefore an excellent candidate for detailed studies of their energy source222In some papers Arp299 is referred to as a ULIRG, based on the use of . Optical, infrared (IR) and radio observations show that it hosts galaxy-wide star-formation with estimated rates for discrete regions ranging from M up to M and typical ages of Myr (Alonso-Herrero et al. 2000 henceforth referred to as AH00; Zhao et al. 1997). Mid IR observations indicate that the major part of this star-forming activity is obscured by large amounts of dust (Charmandaris et al. 2002).
X-ray observations show that Arp299 is one of the most X-ray luminous star-forming galaxies in the nearby universe, with an observed luminosity of erg s-1 in the 0.1-10.0 keV band (Zezas et al. 1998; Heckman et al. 1999). Its X-ray spectrum is well represented by a two component model with either a double thermal plasma or a thermal plasma and a power-law, and was found to be very similar to that of other much less luminous star-forming galaxies. However, recent observations of Arp 299 with Beppo-SAX revealed a heavily obscured AGN (Della Ceca et al. 2002). In order to further study the origin of the X-ray emission from this exceptionally luminous star-forming galaxy we obtained a relatively short exposure with the Chandra X-ray observatory (Weisskopf et al. 2000). In this paper we report on the properties of the discrete sources in Arp 299. A more detailed study of the X-ray emission from this system will be presented in a forthcoming paper.
2 Observations and Data Analysis
Arp 299 was observed with the ACIS-I camera (Garmire et al. 1997) on board Chandra for 24.2 ks on the 13th of July 2001. In our analysis we used the event-2 type files and followed the standard procedures for analysis of Chandra data333http://asc.harvard.edu using the CIAO v2.2 tool suite. We corrected the absolute astrometry for known offsets444http://asc.harvard.edu/ciao/threads/arcsec_correction/. Comparison between the positions of the brightest isolated sources in the field and the coordinates of their radio counterparts (kindly provided by S. Neff) showed that the absolute astrometry is accurate to within . The background level during our observation was nominal.
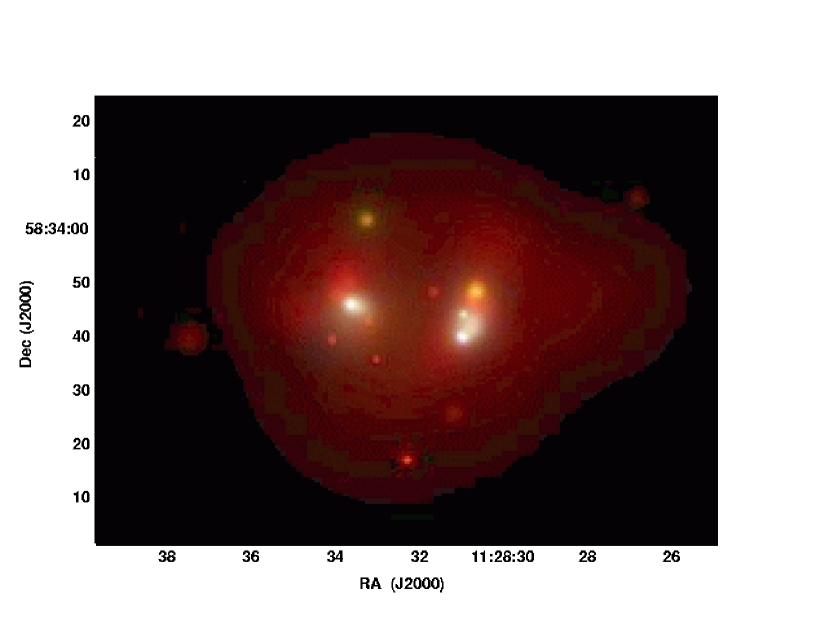
We created images in the full (0.5-8.0 keV) as well as soft (0.5-2.5 keV), medium (2.5-4.0 keV) and hard (4.0-8.0 keV) bands. We adaptively smoothed these images using the csmooth tool, with a maximum signal-to-noise (S/N) ratio of 5. In order to avoid over-smoothing weak features we set the maximum FWHM of the smoothing Gaussian to 16′′, resulting in a minimum S/N of in regions of the galaxy with weak X-ray emission. Figure 1 shows a true colour X-ray image of the galaxy, constructed from the combined soft (red), medium (green) and hard (blue) band smoothed images. It is clear from this image that a significant fraction of the X-ray emission from the galaxy is associated with a diffuse soft component and that there are also a few hard discrete sources.
We searched the images in each band for discrete sources using the CIAO wavedetect algorithm (Freeman et al. 2002). This resulted in the detection of 18 discrete sources, 4 of which appear to have an extended component based on the wavdetect results. The properties of these sources are presented in Table 1. Figure 2 shows a full band image with the discrete sources indicated following the notation of Table 1. We estimated the intensity of each source from within an aperture including most of the observed emission (in the case of point-like sources the aperture radius was and encompassed 90% of the total emission at 1.4 keV). These apertures are shown projected onto the X-ray image in Fig. 2. The background was derived from an annulus placed around each source (excluding any encompassed sources). The absorption corrected luminosity of the sources range from erg s-1 up to erg s-1 (0.1-10.0 keV), assuming a power-law () with the Galactic line-of-sight HI column density (= cm-2 ; Stark et al. 1992). We note that because of the varying intensity of the diffuse emission over the galaxy, the detection limit is not uniform. The discrete sources contribute % of the galactic X-ray emission in the broad 0.5-8.0 keV energy band. Their contributions are % and 65% in the soft and medium bands, respectively.
For the 6 X-ray sources with more than 80 counts,
(ie. Src2 = C1 in NGC 3690; Src3; Src4 = B2 in NGC 3690;
Src6 = B1 in NGC 3690; Src14 and Src16 = A in IC 694, following the notation of AH00), we extracted X-ray spectra
from the above apertures. We fitted these spectra using the XSPEC
v11.2 spectral fitting package. In order to take account of the
absorption due to the build-up on the window of the ACIS detector we
used the acisabs
model555http://asc.harvard.edu/cal/Acis/Cal_prods/qeDeg/
http://www.astro.psu.edu/users/chartas/xcontdir/xcont.html. The
results of the spectral fits are presented in Table 2.
In all but one case (Src6) a power-law or a Raymond-Smith
thermal plasma with an absorption column left free to vary, gave good fits.
For these sources we derived power-law photon indices between
and . The best fit column density was consistent with values significantly in
excess of the Galactic line of sight value in all cases.
For source Src 6, in order to obtain a reasonable fit an additional spectral component was required. We obtained the best fit () using a double power-law model (note: a thermal plasma plus absorbed power-law model did not give a good fit; ). In this case the best fit photon indices were and , while the overall absorption was moderate (= cm-2 ). By introducing a second absorber for one of the power-law components we obtain a photon index and a column density for the second power-law component of = cm-2 and a fit of similar quality (; the indices of the two power-laws were bound together, since when fitted individually they were poorly constrained). Our results strongly suggest that the AGN in Arp299 recently revealed at high X-ray energies (Della Ceca et al. 2002), is associated with this source, identified with the infrared source B1. The high spatial resolution of Chandra allows the source to be separated from the surrounding emission, and hence permits a much improved study of the spectrum below 10 keV than was possible using the Beppo-SAX data. We also modeled the spectrum with the best fit spectrum reported in Dela Cecca et al. (2002), keeping the parameters of the absorbed component (slope and normalization) fixed to the values determined from the Beppo-SAX data while leaving the other parameters free to vary. Our results show that neither a thermal component nor a strong Fe-K line are required by the fit: the former most probably because of the very small region used in the spectral extraction, while the latter was because of the poor photon statistics in the 6 keV region. This fit gave an unabsorbed power-law of slope , an overall of cm-2 ( cm-2 ) and a column density for the hard component of cm-2 , very similar to the values derived from the Beppo-SAX data. For the other sources we calculated hardness ratios (Table 1), which are consistent with power-laws in the range .
2.1 Multiwavelength associations
We have compared the X-ray data with observations made in the radio (Zhao et al. 1997; Neff et al. private communication, 2002) and at NIR wavelengths (AH00). From complex-A we detect X-ray emission associated with sources A (=IC 694), A3-4 and A6 (following the notation of AH00). From complex-B we detect the X-ray counterparts of components B1 (=NGC 3690), B2, B21 and possibly B23. Finally from complex-C we detect a discrete X-ray source coincident with components C1-2 as well as diffuse emission in the neighborhood of C4 and C5.
In the radio regime, we can identify X-ray counterparts for all of the major radio components (A, B1, B2, C) based on the accurate radio coordinates kindly provided by S. Neff (private communication). We also find an X-ray counterpart (Src 8) for a radio source in the East of C′, which we will refer to as C′′ (, ; J2000). In addition we have detected an X-ray counterpart (Src10) of the radio source IC 694+1990 (which lies 5′′ south-west of component A (Huang et al. 1990; Zhao et al. 1997; Neff et al. 2002) which is also associated with a NIR source (not identified by AH00). Its relatively soft X-ray colors suggest that it may be associated with a radio supernova, as was originally proposed by Huang et al. (1990), rather than a background QSO (Zhao et al. 1997).
3 Discussion
3.1 Discrete sources
This relatively short duration Chandra observation of Arp299 shows that 40% of the galactic X-ray emission in the (0.5-8.0) keV band arises from 18 discrete sources with luminosities above erg s-1, which is similar to results obtained for other star-forming galaxies eg. the Antennae (Fabbiano et al. 2001), M 82 (Zezas et al. 2001) and NGC 3256 (Lira et al. 2002). All of the major optical, NIR and radio components of the system (including the two nuclei) are detected in X-rays in this Chandra observation.
We have compared the luminosity distribution of the point-like sources in Arp 299 with that for sources detected in NGC 3256 (D=34 Mpc; Lira et al. 2002) and the Antennae (Zezas & Fabbiano 2002), after rebinning the X-ray data for the latter by a factor of 2 in order to match the spatial resolution of Arp 299. We find that the luminosity distributions, excluding the extended sources and the nuclei, are very similar indicating that these galaxies have comparable intrinsic numbers of luminous sources. Therefore the apparently large number of sources with luminosities above erg s-1 in both Arp 299 and NGC 3256 compared with the Antennae, is most likely due to source confusion (at 40 Mpc one resolution element corresponds to a physical scale of pc).
3.2 The nuclei
The excellent spatial resolution of Chandra allows us to individually study the two nuclei and to compare their X-ray properties with those at other wavelengths. The X-ray spectrum of Source 16 which is associated with the nucleus of IC 694 (infrared source A) is well fit with a heavily absorbed ( cm-2 ) power-law () consistent with either a population of X-ray binaries or an AGN. Its observed luminosity in the 0.1-10.0 keV band is erg s-1, that is % of the overall emission from Arp 299. The measured absorbing column density is consistent with the extinction derived from mid-IR observations ( mags; Charmandaris et al. 2002), and narrow-band NIR photometry and spectroscopy (AH00).
Although the contribution of the nuclear point source (Src 16) to the overall X-ray emission of Arp 299 is small, we detect a significant circumnuclear extended component ( kpc). This region has an absorption corrected luminosity of erg s-1 (0.1-10.0 keV; providing 8% of the observed emission Arp 299 in this band). Based on modeling of the stellar population, the dominant stellar component in nucleus A has an age of 11 Myr. Given the large young stellar population, this region may be expected to contain a significant number of High Mass X-ray Binaries (HMXB). Taking the derived Lyman continuum flux (Lyc) of this region (Zhao et al. 1997; AH00) and assuming a mean Lyc flux of per O-type star, we estimate a population of O-type stars. Based on the minimum specific X-ray luminosity per O-type star found in the SMC (Helfand & Moran 2001) we estimate a luminosity of erg s-1 for the HMXB component, which is in good agreement with the intrinsic X-ray luminosity from this region.
Turning now to the case of X-ray Source 6, which we identify with the nuclear component B1 in NGC 3690, we find that it has a very hard X-ray spectrum typical of a heavily obscured AGN, indicating that this component is the nucleus of NGC 3690. In the light of these spectroscopic results we associate the recently discovered highly obscured AGN in Arp 299 (Della-Ceca et al. 2002) with the nucleus of NGC 3690. The observed luminosity of this nucleus is erg s-1 (0.1-10 keV), and contributes 2% and 15% of the overall X-ray emission of Arp 299 in the 0.1-2.0 keV and 2.0-10.0 keV X-ray bands respectively. However, as reported by Della Ceca et al. (2002), even its absorption corrected intrinsic hard X-ray luminosity, is only a small fraction of the bolometric energy output of Arp 299. From the combined Beppo-SAX Chandra fits we find that the spectrum below 10.0 keV is dominated by a relatively flat power-law, which could either be associated with scattered emission from the AGN or with a population of HMXBs in the circumnuclear region. The intrinsic luminosity of this spectral component is erg s-1 in the 0.1-10.0keV band, which is relatively high for a population of X-ray binaries given the physical size of the extraction region, unless it is dominated by a few Ultra-Luminous X-ray Sources (ULXs) as has been seen in M 82 (e.g. Kaaret et al. 2001). Given the presence of diffuse hard X-ray emission (extending up to 8 keV) in the region of NGC 3690, some fraction of this luminosity might be associated with a starburst component. However, from Fig. 1, we do see a clear displacement between the location of the AGN and the peak of the diffuse emission (coincident with Src 4), indicating that the most vigorous star-formation is not spatially coincident with the AGN.
This extended X-ray source (Src 4) with a luminosity of erg s-1 (0.1-10.0 keV band) is associated with the second brightest near IR peak in NGC3690 (component B2). Its X-ray spectrum is quite soft () but has large uncertainties. It is also seen through a screen of relatively thick obscuring material ( cm-2 ), in agreement with the extinction derived from NIR observations (AH00). Its intrinsic luminosity is erg s-1 similar to the total luminosity from the central region of M82 (excluding the bright ULX source), and consistent with this component of NGC 3690 being associated with a compact starburst region.
Similar results are derived for the other sources with available X-ray spectra. The relatively large column density measured towards them indicates that most of the star-formation in Arp 299 is enshrouded by dust, in agreement with results from the mid-IR band (Charmandaris et al. 2002), and as expected for a young burst of star-formation. Stellar population evolutionary synthesis models give ages of Myrs (AH00), for most star-forming regions, indicating that the dominant X-ray components will be High Mass X-ray binaries and supernova remnants.
Finally, the non detection of X-ray emission from component C′ is quite consistent with a very young region (4 Myr) undergoing an instantaneous burst of star-formation (AH00). A calculation similar to that made above for IC 694, gives a total number of 60 HMXBs from the Lyc emission of C′. However, given its probable young age, very few stars in binary systems have produced compact objects and even fewer will have reached the end of their main sequence lifetimes, when they become observable as X-ray binaries. Therefore the expected X-ray luminosity of this component would be much less than erg s-1 which is the typical detection limit of our observation.
4 Conclusions
We present preliminary results from a short Chandra ACIS-I observation of the merger system Arp 299. This observation reveals that the X-ray emission is produced by a population of discrete sources which dominate above 2.0 keV, as well as emission from a diffuse softer component. These properties are very similar to those found for other well studied merging star-forming galaxies (e.g. Antennae: Fabbiano et al. 2001, Zezas et al. 2002; NGC 3256: Lira et al. 2002). However, there is a single very hard source in the nuclear region of NGC 3690 which produces about 15% of the observed galactic emission above 2.0 keV in the Chandra energy band, which we identify with the AGN reported by Della Ceca et al. (2002). The X-ray and multiwavelength properties of the other near infrared nuclei are fully consistent with those found in other galaxies with nuclear starbursts, although the possibility of a relativelty weak mildly obscured AGN cannot be excluded in the case of Src16 (assocaited with near infrared source A).
These results together with the recent detection of two AGNs coincident which the double nuclei of the LIRG NGC 6240 (Komossa et al. 2002), suggest that galaxy mergers are a very efficient means of fueling AGNs (e.g. Combes et al. 2001). However, at the same time mergers may result in burying AGN within large concentrations of obscuring material, thereby rendering them invisible in all but the high energy X-ray domain. Although the AGN ouput may not dominate the bolometric energy budget, nevertheless their detection is important for any complete AGN demographic study, and also in furthering our understanding of the AGN/starburst connection.
References
- Alonso-Herrero, Rieke, Rieke, & Scoville (2000) Alonso-Herrero, A., Rieke, G. H., Rieke, M. J., & Scoville, N. Z. 2000, ApJ, 532, 845 (AH00)
- Charmandaris, Stacey, & Gull (2002) Charmandaris, V., Stacey, G. J., & Gull, G. 2002, ApJ, 571, 282
- Combes (2001) Combes, F. 2001, Advanced Lectures on the Starburst-AGN , 223
- (4) Della Ceca R., et al. 2001, astro-ph/0211077
- Fabbiano, Zezas, & Murray (2001) Fabbiano, G., Zezas, A., & Murray, S. S. 2001, ApJ, 554, 1035
- Freeman, Kashyap, Rosner, & Lamb (2002) Freeman, P. E., Kashyap, V., Rosner, R., & Lamb, D. Q. 2002, ApJS, 138, 185
- Garmire (1997) Garmire, G. P. 1997, AAS, 190, 3404
- Gehrels (1986) Gehrels, N. 1986, ApJ, 303, 336
- Heckman, Armus, Weaver, & Wang (1999) Heckman, T. M., Armus, L., Weaver, K. A., & Wang, J. 1999, ApJ, 517, 130
- Huang, Condon, Yin, & Thuan (1990) Huang, Z. P., Condon, J. J., Yin, Q. F., & Thuan, T. X. 1990, IAU Circ., 4988, 1
- Komossa et al. (2003) Komossa, S., Burwitz, V., Hasinger, G., Predehl, P., Kaastra, J. S., & Ikebe, Y. 2003, ApJ, 582, L15
- Lira et al. (2002) Lira, P., Ward, M., Zezas, A., Alonso-Herrero, A., & Ueno, S. 2002, MNRAS, 330, 259
- Sanders & Mirabel (1996) Sanders, D. B. & Mirabel, I. F. 1996, ARA&A, 34, 749
- Stark et al. (1992) Stark, A. A., et al. 1992, ApJS, 79, 77
- Sugai et al. (1999) Sugai, H., Davies, R. I., Malkan, M. A., McLean, I. S., Usuda, T., & Ward, M. J. 1999, ApJ, 527, 778
- Weisskopf et al. (2000) Weisskopf, M., Tananbaum, H., Van Speybroeck, L . & O’Dell, S. 2000, Proc. SPIE 4012 (astro-ph 0004127)
- Zezas, Georgantopoulos, & Ward (1998) Zezas, A. L., Georgantopoulos, I., & Ward, M. J. 1998, MNRAS, 301, 915
- Zezas et al. (2001) Zezas, A., Fabbiano, G., Prestwich, A., Murray, S., & Ward, M. 2001, ASP Conf. Ser. 249: The Central Kiloparsec of Starbursts and AGN: The La Palma Connection, 425
- Zezas & Fabbiano (2002) Zezas, A. & Fabbiano, G. 2002, ApJ, 577, 726
- Zhao, Anantharamaiah, Goss, & Viallefond (1997) Zhao, J., Anantharamaiah, K. R., Goss, W. M., & Viallefond, F. 1997, ApJ, 482, 186
| Src | RA (J2000) | Dec (J2000) | Net | Sign. | HR1 | HR2 | HR3 | , () | Notes1 |
|---|---|---|---|---|---|---|---|---|---|
| h m s | ∘′ ′′ | counts | (S-M)/(S+M) | (S-H)/(S+H) | (M-H)/(M+H) | erg s-1 | |||
| 1 | 11 28 26.8 | +58 34 07.0 | 20.3 | 9.3 | 1.7 (2.0) | ||||
| 2 | 11 28 30.7 | +58 33 49.0 | 233.3 | 27.8 | 20.1 (22.5) | Ext; NIR: C1 | |||
| 3 | 11 28 30.7 | +58 33 44.5 | 68.6 | 11.2 | 5.9 (6.6) | ||||
| 4 | 11 28 30.8 | +58 33 42.6 | 105.5 | 15.2 | 9.1 (10.2) | Ext; NIR: B2 | |||
| 5 | 11 28 30.9 | +58 33 45.0 | 248.3 | 41.0 | 21.4 (23.9) | NIR: B21 | |||
| 6 | 11 28 31.0 | +58 33 41.2 | 74.8 | 10.6 | 6.4 (7.2) | Ext; NIR: B1 | |||
| 7 | 11 28 31.2 | +58 33 26.2 | 12.6 | 4.6 | 1.1 (1.2) | ||||
| 8 | 11 28 31.7 | +58 33 49.5 | 38.4 | 8.8 | 3.3 (3.7) | Ext; Rad: C′′ | |||
| 9 | 11 28 32.3 | +58 33 18.4 | 52.3 | 23.6 | 4.5 (5.0) | ||||
| 10 | 11 28 33.1 | +58 33 37.0 | 29.3 | 7.2 | 2.5 (2.8) | Rad.: IC 694-1990 | |||
| 11 | 11 28 33.1 | +58 33 56.0 | 19.3 | 4.9 | 1.7 (1.9) | ||||
| 12 | 11 28 33.2 | +58 33 43.9 | 36.1 | 6.8 | 3.1 (3.5) | ||||
| 13 | 11 28 33.3 | +58 34 02.9 | 46.6 | 15.4 | 4.0 (4.5) | ||||
| 14 | 11 28 33.4 | +58 33 46.9 | 60.4 | 11.7 | 5.2 (5.8) | ||||
| 15 | 11 28 33.7 | +58 33 51.2 | 42.2 | 9.0 | 3.6 (4.1) | ||||
| 16 | 11 28 33.7 | +58 33 47.2 | 132.6 | 15.6 | 11.4 (12.8) | Ext; NIR: A | |||
| 17 | 11 28 34.1 | +58 33 40.0 | 30.0 | 6.4 | 2.6 (2.9) | ||||
| 18 | 11 28 37.5 | +58 33 40.9 | 9.2 | 4.1 | 0.8 (0.9) |
| Src | (dof) | , ()1 | , ()1 | ||
|---|---|---|---|---|---|
| cm-2 | (0.1-2.0) keV | (2.0-10.0) keV | |||
| 2 | 13.3 (10) | 7.4 (83.0) | 6.4 (6.6) | ||
| 3 | 0.9 (1) | 1.4 (4.4) | 9.2 (9.5) | ||
| 4 | 4.4 (3) | 2.7 (22.1) | 3.9 (4.1) | ||
| 62 | 8.8 (9) | 5.4 (17.1) | 66.3 (66.6) | ||
| 14 | 1.2 (1) | 1.7 (19.9) | 2.5 (2.7) | ||
| 16 | 1.6 (6) | 1.8 (13.6) | 2.1 (2.3) |