KINEMATIC MASSES OF SUPER STAR CLUSTERS IN M82 FROM HIGH-RESOLUTION NEAR-INFRARED SPECTROSCOPY11affiliation: Based on observations made at the W.M. Keck Observatory, which is operated as a scientific partnership among the California Institute of Technology, the University of California and the National Aeronautics and Space Administration. The Observatory was made possible by the generous financial support of the W.M. Keck Foundation.
Abstract
Using high-resolution ( 22,000) near-infrared (1.51 – 1.75 m) spectra from Keck Observatory, we measure the kinematic masses of two super star clusters (SSCs) in M82. Cross-correlation of the spectra with template spectra of cool evolved stars gives stellar velocity dispersions of km s-1 for J0955505+694045 (‘MGG-9’) and km s-1 for J0955502+694045 (‘MGG-11’). The cluster spectra are dominated by the light of red supergiants, and correlate most closely with template supergiants of spectral types M0 and M4.5. King model fits to the observed profiles of the clusters in archival HST/NICMOS images give half-light radii of pc for MGG-9 and pc for MGG-11. Applying the virial theorem, we determine masses of M⊙ for MGG-9 and M⊙ for MGG-11 (where the quoted errors include , and the distance). Population synthesis modelling suggests that MGG-9 is consistent with a standard initial mass function, whereas MGG-11 appears to be deficient in low-mass stars relative to a standard IMF. There is, however, evidence of mass segregation in the clusters, in which case the virial mass estimates would represent lower limits.
1 Introduction
Starburst galaxies are the site of about 25% of the high-mass ( 8M⊙) star formation in the local Universe (Heckman 1998). As high-mass stars form predominantly in dense clusters and OB associations (Miller & Scalo 1978), massive stellar clusters in nearby starburst galaxies provide a laboratory for studying intense star formation and related feedback processes. Star formation in starbursts is resolved into massive, compact super star clusters (SSCs) which account for perhaps 20% of the new stars formed in the burst (Meurer et al. 1995; Zepf et al. 1999). The combination of high-resolution HST imaging and high-resolution near-infrared and optical spectroscopy has found SSC sizes ( 1–5 pc) and masses (– M⊙) comparable with those of globular clusters. Estimates of cluster ages have shown the SSCs to be much older than the crossing time, indicating that they are gravitationally bound. In addition, radial profiles of the clusters are best fit with the King models (e.g., Mengel et al. 2002) derived for globular clusters (King 1962). These observations suggest that SSCs are young globular clusters, forming in the present-day universe.
While SSCs have been identified in a number of galaxies, kinematic masses have been measured for relatively few. Among these are dwarf galaxies NGC 1569 (Ho & Filippenko 1996a; Gilbert & Graham 2001) and NGC 1705 (Ho & Filippenko 1996b), and the NGC 4038/4039 merger (Mengel et al. 2002). While much of this work has relied upon optical spectroscopy, there are distinct advantages in the near-infrared. SSCs are often situated in dusty regions where extinction is high; the most heavily-reddened clusters are not seen in optical images. In addition, the spectra of SSCs older than Myr are dominated by the light of cool supergiant stars. The near-IR spectra of these evolved stars feature a multitude of atomic and molecular absorption lines which are suitable for measurement of the stellar velocity dispersion within a cluster via spectral cross-correlation. Combined with high-resolution images, this technique allows determination of cluster masses.
Kinematic masses for SSCs are relevant to the debate over the form of the initial mass function (IMF) in starburst galaxies (e.g., Eisenhauer 2001; Gilmore 2001). Notably, Rieke et al. (1993) use population synthesis models for the nuclear starburst in M82 to conclude that the IMF is deficient in low-mass stars (M⊙) relative to the IMF of the solar neighborhood. Sternberg (1998) finds that SSC NGC 1705-1 appears to be deficient in low-mass stars, whereas a large fraction of the stellar mass in the SSC NGC 1569A is contained in low-mass stars. Measurement of the kinematic mass of an SSC provides the only means of characterizing the low-mass stellar population of the cluster. While the light of these stars is overwhelmed by the far more luminous supergiants, the low-mass stars comprise a substantial fraction of the cluster’s mass for a normal IMF. Quantifying the low-mass stellar content is critical to constraining the IMF as well as assessing whether a cluster can remain bound as a globular cluster.
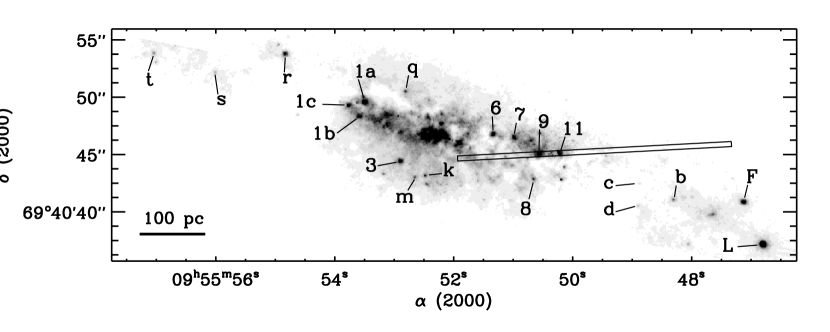
M82 (NGC 3034) provides an interesting case. As one of the nearest starburst galaxies (3.6 Mpc) it has been extensively observed from X-rays to radio wavelengths. Its proximity results in an obvious resolution advantage: star-forming regions can be studied on small spatial scales ( pc) and individual SSCs are resolved by HST. A NICMOS F160W mosaic (Figure 1) of the nuclear starburst region shows many luminous SSCs within pc of the nucleus. The nuclear starburst is thought to be active in the sense that the typical age for the starburst clusters is years (Satyapal et al. 1997). Evolutionary synthesis models by Förster Schreiber (1998) suggest the nuclear starburst (i.e., the central 450 pc) consists of two distinct events with ages of about 5 Myr and 10 Myr. O’Connell et al. (1995) imaged M82 in the - and -bands with the high-resolution Planetary Camera aboard HST, identifying over 100 SSCs within a few hundred parsecs of the nucleus. de Grijs et al. (2001) imaged a region in the disk of M82, 1 kpc from the nuclear starburst, with WFPC2 and NICMOS. They identified 113 SSC candidates which they believe were part of a starburst episode 600 Myr ago (a “fossil starburst”). Smith & Gallagher (2001) derived the kinematic mass of SSC ‘M82-F’ using high-resolution optical (6010–8132Å) spectroscopy and WFPC2 (F439W) images. M82-F (hereinafter MGG-F) lies 500 pc west of the nucleus of M82; Smith & Gallagher estimate an age of Myr, intermediate between the ongoing nuclear burst and the fossil burst farther out in the disk.
In this paper, we investigate the kinematic mass of two clusters (J0955502+694045, hereinafter MGG-11, and J0955505+694045, hereinafter MGG-9) on the western edge of the active nuclear starburst. These particular clusters were chosen for this pilot program based on their brightness () and the ability to place both on a single slit position.
Freedman et al. (1994) measured the distance to neighboring galaxy M81 using Cepheids, determining a value of Mpc. Observations of HI (e.g., Appleton et al. 1981) indicate a physical link between M81 and M82. As the projected separation between the galaxies is only kpc, well within the uncertainty on the distance, we adopt this value for M82. The corresponding distance modulus is .
2 Observations
We observed super star clusters MGG-9 and MGG-11 with the 10-m Keck II telescope on 2002 February 23, using the facility near-infrared echelle spectrometer NIRSPEC (McLean et al. 1998). We obtained high-resolution (), cross-dispersed spectra in the wavelength range 1.51–1.75 m using the NIRSPEC-5 order-sorting filter. The data fall in seven echelle orders, ranging from 44 through 50. The clusters were imaged in four nods along the slit, with successive nods separated by (spatial resolution of the spectra is ). Each integration was 600 seconds, providing a total time of 2400 seconds on the clusters. The spectra were dark subtracted, flat-fielded and corrected for cosmic rays and bad pixels. The curved echelle orders were then rectified onto an orthogonal slit-position/wavelength grid based on a wavelength solution from sky (OH) emission lines. Each pixel in the grid has a width of Å. We sky-subtracted by fitting third-order polynomials to the 2D spectra column-by-column. The individual extracted spectra had average signal-to-noise ratios of for MGG-9 and for MGG-11.
The NIRSPEC echelle turret is jostled whenever the cryogenic image rotator is slewed. When large slews, with amplitudes comparable to the permitted range of motion, are executed, the echellegram shifts by several pixels. However, when the image rotator is making the small, slow motions necessary to remove sidereal rotation, the wavelength solution is stable to better than a few hundredths of a pixel. This is true even when an object is crossing the meridian and the sidereal rotation is fastest. Thus the velocity broadening reported here is intrinsic to the source and not an instrumental effect.
The cluster spectra were extracted using Gaussian weighting functions matched to the wavelength-integrated profiles. To correct for atmospheric absorption, we observed a B8V star, HD 74604. Both the clusters and the calibration star were observed at an airmass of . To account for photospheric absorption features (particularly Brackett and helium lines) and continuum slope, the calibration star spectrum was divided by a spline function fit. The resulting atmospheric absorption spectrum was then divided into the cluster spectra.
We also observed several late-type stars of luminosity class I, II or III with NIRSPEC for use as spectroscopic templates in cross-correlation analysis (see Section 3). Table 1 summarizes these observations. Template stars were observed with the same slit, filter, and cross-disperser and echelle grating positions as the clusters. Reduction, rectification and extraction steps were identical to those described above for the clusters, with the exception that sky subtraction for the high signal-to-noise stars was performed by pairwise subtraction of successive nods along the slit.
For photometry and determination of structural parameters of super star clusters in M82, we obtained images from the HST archive (HST Proposal 7218, Marcia Rieke, PI). The images were taken 1998 April 12 with the NIC2 camera on NICMOS and cover the nuclear region with four adjacent, overlapping fields along the major axis. We used the images taken with the broadband F160W and F222M filters. NIC2 has a plate scale of 75 mas per pixel, and is therefore critically sampled at 1.75m. Each field was observed in a spiral dither of four images, resulting in a field of view of for each pointing center. We relied upon the NICMOS data reduction pipeline (calnicb) for combination of the dithered images. The dither pattern used a point-spacing of (2.87 pixels). At the distance of M82, one pixel corresponds to 1.3 pc. A mosaic of the four fields covers an area of approximately . Total exposure time for each of the four fields was 192 seconds in F160W and 448 seconds in F222M (except the western-most field, which was 576 seconds). We relied on the standard pipeline reduction procedures (calnica) for dark-subtraction, flat-fielding and cosmic ray rejection, and did not perform any additional calibration steps ourselves.
We compared the astrometry of identifiably common clusters between the NICMOS images and the positions listed in Kronberg et al. (1972), and found discrepancies of . All astrometry quoted in this paper has been adjusted to match Kronberg et al., and is correspondingly accurate to .
3 Cluster Velocity Dispersion
In the near-infrared, SSC spectra are dominated by the light of cool evolved stars, the spectra of which contain a large number of molecular and atomic absorption features (Gilbert & Graham 2001). We have assembled high-resolution NIRSPEC spectra of a number of evolved (luminosity class I, II and III) stars, ranging in spectral type from G2 through M4.5. Cross-correlation of these template spectra with the spectrum of an individual super star cluster allows identification of the dominant spectral type of stars in the SSC as well as determination of the line-of-sight velocity dispersion. For each cluster in the present work, we have 28 measurements to cross-correlate with the template star spectra: four nods in each of seven echelle orders. We have chosen not to sum the spectra for a given echelle order to avoid the interpolation required in registering the separate measurements to a consistent wavelength grid and the resulting smearing of the spectral resolution.
Certain atmospheric OH emission lines were incompletely removed in the sky subtraction process. The residuals of these bright lines, generally close doublets, must be removed prior to cross-correlation to avoid introduction of systematic bias. We have replaced the pixels affected by residual sky emission with the median value of the five pixels on either side of the contaminated range. The fraction of pixels replaced in a given echelle order typically amounts to a few percent. Tests on an OH emission-free echelle order indicate that the cross-correlation result is unaffected within the stated uncertainities, with the following exception. At the systemic velocity of M82, the bright telluric OH P2(3.5) emission line at m overlies the CO () bandhead in echelle order 47 (m m). The CO bandhead feature is so prominent in the spectrum that residual noise from sky subtraction introduces significant systematic error for this echelle order. The results of the cross-correlation analysis for echelle order 47 are therefore unreliable, and have not been used in this analysis.
The remaining 24 spectra for each cluster are cross-correlated with the corresponding echelle orders of the template stars, and the template star spectra are auto-correlated. Our cross-correlation is based on the method of Tonry & Davis (1979). We fit a fifth-order Chebychev polynomial to the spectrum to subtract the continuum, and apodize with a cosine bell to remove mismatch at the edges. The spectrum is then transformed into Fourier space, and multiplied by fourth-order Butterworth filters to remove low-frequency continuum variations and high-frequency noise. The filter frequencies are selected to minimize any systematic bias introduced by the presence of noise. By the convolution theorem, multiplication (in Fourier space) of the continuum-subtracted, apodized, filtered spectrum and its complex conjugate, followed by inverse Fourier transformation, gives the cross-correlation function. Invoking the central limit theorem, we fit the auto- and cross-correlation peaks with Gaussians to determine their respective widths. The excess width of the cross-correlation relative to the auto-correlation of a template star is a measure of the stellar velocity dispersion within the cluster. Cross-correlation of a pair of template stars should reflect only differences in rotation (), macroturbulence, and noise. The advantage of using the auto-correlation is that it fully accounts for the intrinsic width of absorption features when the correct template spectral type is used. Only the dispersion of photospheric macroturbulence within that spectral type and luminosity class affects our analysis, and no first-order correction to the measured velocity dispersion is necessary. The observed macroturbulence for K supergiants is 11 km s-1 with a peak-to-peak range of km s-1 (Gray & Toner 1987). Our analysis assumes that our template stars are representative of their spectral type and luminosity class.
One potential difficulty is metallicity differences between Galactic supergiants used as templates and the supergiants producing the cluster light. McLeod et al. (1993, and refs.) cited evidence from emission-line studies of various elements and concluded that the present-day ISM in M82 has solar or slightly higher metallicity. Förster Schreiber et al. (2001) determined that near-IR stellar absorption features observed in the starburst core are consistent with the light from solar-metallicity red supergiants (RSG). Metallicity factors are unlikely to significantly bias our measured velocity dispersions.
The results of the cross-correlation with the template stars are presented in Table 2. The peak amplitude of the cross-correlation function (CCF) measures the similarity of the cluster to the template spectral type. The CCF peak increases steadily with spectral type from 0.3 for the G2I template to 0.8 for the M0I and M4.5I templates. We find that the spectra of clusters MGG-9 and MGG-11 closely match the spectrum of the M0Iab (e.g., Figures 2 and 3) and M4.5Iab stars. The average of the CCF over the 24 spectra for each cluster is shown in Figure 4. Unfortunately, our spectral atlas does not presently include any template supergiant spectra between M0 and M4.5. Intermediate spectral types, e.g. M2, should match the clusters at least as well as M0 and M4.5.
Asymmetries in the CCF indicate kinematic substructure, such as the presence of an additional cluster. NGC 1569A, for example, displays an asymmetric CCF which is the result of a kinematically distinct cluster which is projected onto the same slit position (Gilbert & Graham 2002; Ho & Filippenko 1996a). The CCFs for these M82 SSCs are quite symmetrical, and are well fit by Gaussians. The clusters show evidence of only a single kinematic component.
Based on an average of the results from the best-match templates, we measure velocity dispersions of km s-1 for MGG-9 and km s-1 for MGG-11. (The uncertainties quoted here are the standard errors — the standard deviation of the independent measurements divided by .)
Cross-correlation with a mismatched template spectrum can introduce systematic bias to the velocity dispersion determination. We note a roughly linear trend between the measured velocity dispersion and the peak value of the CCF for a given template. In the case of MGG-11, extrapolation of the trend to a hypothetical “perfect” correlation of 1.0 gives a value of which is consistent with the value quoted above. In the case of MGG-9, the strong decreasing trend of with the CCF peak value suggests that the quoted value may be slightly inflated due to systematic bias from template mismatch. Comparison to a correlation of 1.0, however, is not the correct metric; the velocity dispersion of the cluster stars reduces the CCF peak even for a perfect spectral match. As a test, we convolved the M0Iab spectrum with a Gaussian velocity distribution, and then cross-correlated the result with the template M0Iab spectrum. The CCF peaked at 0.90 for a velocity dispersion of 16.2 km s-1; increasing the velocity dispersion decreases the CCF peak (note the higher CCF peak values for MGG-11, which has a lower velocity dispersion than MGG-9). We adopt the quoted values with the caveat that there may be a small amount ( 1 km s-1) of systematic bias present due to template mismatch.
Cross-correlation analysis also measures the heliocentric radial velocities of the clusters. We find that MGG-9 has km s-1 and MGG-11 has km s-1. These values are based on cross-correlation with HD 43335, which has a radial velocity of 38.9 km s-1 (per SIMBAD111http://simbad.u-strasbg.fr/). The spectrum of HD 43335 is was taken immediately before the cluster spectra, and we find no grating shifts which would systematically bias the radial velocities.
Millimeter observations of CO emission by Shen & Lo (1995) provide context for the radial velocities. The clusters lie in a “saddle” feature in the velocity-integrated CO emission map, roughly west of the kinematic center. Plotted on Shen & Lo’s major axis – cut, the clusters lie on the western shoulder of a prominent second spatial component, separate from the primary velocity gradient. The radial velocities of the clusters measured in the near-IR are consistent with the velocity of CO at their locations, suggesting a potential kinematic link between the clusters and their natal molecular gas. Deprojecting the galaxy and applying the Shen & Lo CO velocity gradient to a simple cylindrical solid-body rotation model gives an orbital period of Myr for the clusters. They have not had sufficient time to complete an orbit of the galaxy, and may yet be near their birthplaces. Future high-resolution studies will shed more light on the kinematic connection between dense molecular gas and young super star clusters in the starburst.
4 Cluster Integrated Luminosity
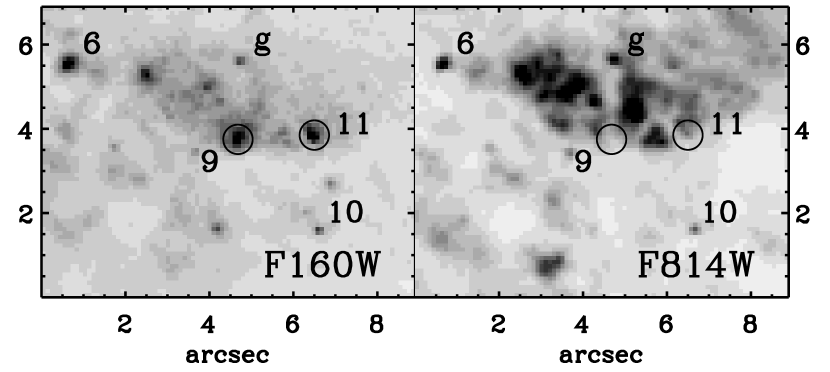
Figure 1 shows the NICMOS F160W mosaic of the nuclear starburst in M82, with the clusters treated in this paper labelled with our secondary designations. The region is notoriously complex, showing structure on virtually any spatial scale resolvable. In the NICMOS images, many of the candidate super star clusters appear against a mottled background of relatively strong diffuse emission. In order to perform photometry and measure size parameters, we must isolate the cluster light from the background. We placed a 0.′′15-wide annulus at an inner radius of 0.′′5 (9 pc) from the centroid of each cluster, and fit a minimum-least-squares plane to the points within the annulus. Subtraction of this plane removes the background emission, allowing us to fit the cluster light.
Calculation of the virial mass of a cluster (Section 5.1) requires determination of the half-light radius. Special care is required, in that many of the clusters are only marginally resolved. The effect of the instrumental point spread function must therefore be taken into account. For each cluster, we generated a model NIC2 PSF using the Tiny Tim program (Krist 1995). The PSF models were matched to the centroid location of each cluster on the detector, oversampled and rebinned to match the pixel size of NIC2. To model the observed cluster images, we tested various functional forms of the radial brightness profile. We found good fits to the data for the empirical King model (King 1962) of the form:
where . The King model has three free parameters: the core radius , the central concentration (where is the tidal radius), and a scaling factor . The King model is convolved with the PSF model and compared to the data. The best-fit model is determined using a Levenberg-Marquardt minimization, finding the least squares fit to the data through iterative search of parameter space. The resulting models give very good fits, as illustrated in Figure 5. Once the King model parameters have been fit for a given cluster, the projected half-light radius () is the numerical solution of
Likewise, integration of the fitted King model over the interval , in conjunction with the NIC2 photometric keyword PHOTFNU, provides the total apparent magnitude of the cluster. Table 3 lists the astrometry, photometry and derived half-light radii for the 20 NICMOS-resolved clusters labelled in Figure 1. In particular, we find projected half-light radii () of mas for MGG-9 and mas for MGG-11. At the adopted distance of Mpc, the projected half-light radii are pc for MGG-9 and pc for MGG-11.
To determine the uncertainties associated with the photometry and half-light radii, we performed a Monte Carlo simulation wherein we added fake star clusters to the NICMOS images and used our fitting algorithm to recover them. We tested fake clusters with a range of luminosities and King model parameters, placed against a representative range of background conditions. While the algorithm could not reliably recover the values of and central concentration (), it must be noted that these parameters are highly covariant; a particular halflight radius may be represented by a family of and values. The fitting algorithm identified the projected halflight radii to within an uncertainty of 12%, independent of the input values of and . Photometric uncertainities scaled with cluster luminosity, ranging from 0.03 to 0.4 mag in low background conditions. In regions of high and/or variable background emission, the algorithm produced larger scatter around the correct luminosity. The results of this analysis are reflected in the photometric uncertainties in Table 3.
We have chosen to use the F160W images for determination of the half-light radii rather than the F222M images for two reasons: (1) we are measuring the velocity dispersion of our test particle stars at 1.51 – 1.75 m, and it is consistent to determine structural parameters of the test particles by using the same light; and (2) warm circumstellar dust may result in excess continuum emission longward of 2 m, complicating cross-correlation analysis.
MGG-F has been closely examined by other authors, and provides a comparison for our measurements. O’Connell et al. (1995) imaged MGG-F in the -band (F555W) with WFPC. They deconvolve the images using a Tiny Tim PSF model, and find a mean FWHM of 160 mas (2.8 pc). The authors note that the deconvolution is “not highly reliable” because the cluster falls near the edge of the detector. Smith & Gallagher (2001) performed circular aperture photometry on MGG-F in F439W images from WFPC2 and find a projected half-light radius of mas ( pc). This value does not reflect deconvolution, but rather a “simple approach” of subtracting 150 mas from the observed value in quadrature to correct for the PSF. By comparison, our profile-fitting method finds a smaller projected half-light radius of mas ( pc) in both F160W and F222M. Sternberg (1998) notes that if the massive red supergiants are spatially segregated from intermediate mass stars, the SSCs will appear more compact in the near-IR than in the visible. The smaller size of MGG-F as measured in the NICMOS images may thus be evidence of mass segregation.
5 Discussion
The combination of spectroscopic and photometric data enables us to examine the stellar composition of the clusters. In particular, we can use measured light-to-mass ratios to draw inferences on the form of the cluster IMFs. Using the stellar velocity dispersions and half-light radii determined above, we find the cluster masses in §5.1. Extinction to the clusters, which plays a critical role in subsequent analysis, is estimated in §5.2, and cluster ages are estimated in §5.3. The light-to-mass ratios and IMF implications are discussed in §5.4, leading to discussion of the fate of the clusters in §5.5.
5.1 Kinematic Masses
The mass of a star cluster may be determined by application of the virial theorem, which dictates that for a cluster in equilibrium, kinetic and potential energy are related by . Spitzer (1969) shows that when expressed in terms of the radius containing half of the mass of the cluster (), the constant of proportionality is well approximated by the value for most mass distribution models. Assuming that the light profile traces the mass distribution, the half-light radius is used as a proxy for the half-mass radius. For an isotropic velocity dispersion, the half-light radius is related to the observed half-light radius in projection () by (Spitzer 1987), and the three-dimensional rms velocity is related to the measured one-dimensional line-of-sight velocity dispersion by . Armed with determinations of the velocity dispersion and projected half-light radius, we are thus able to estimate the mass of a virialized super star cluster:
Under these assumptions, we find a mass of M⊙ for MGG-9. This corresponds to an average mass density of M⊙ pc-3 within the half-mass radius. MGG-11 is less massive at M⊙, with a higher average mass density within of M⊙ pc-3.
As noted in Section 4, MGG-F shows evidence of mass segregation. While extensive dynamical mass segregation in MGG-9 and MGG-11 is unlikely (Section 5.3), it is possible that the most massive stars formed nearer the cluster cores. In this case, the red supergiant velocity dispersions we measure in the near-IR would be smaller than the cluster mean and the masses we derive would represent lower limits.
5.2 Extinction
As noted in Section 4, near-IR images of the nuclear starburst show substantial diffuse emission which hints at the importance of interstellar extinction (see also Figure 6). Theoretical studies (e.g., Hills 1980) indicate that the star formation efficiency is high () in massive star clusters. Considering the additional gas-dispersing effects of supernovae and stellar winds from young, high-mass stars, it is unlikely that much gas from the natal cloud remains in the clusters after a few million years. We have thus assumed a foreground screen model for our extinction estimates.
The spectra of both MGG-9 and MGG-11 are dominated by the light of early M-type supergiants. Based on the intrinsic color of an M2I star (representing the midpoint of the M0I – M4.5I range), we can estimate extinction along the line of sight to the clusters. We calculated synthetic magnitudes for stars in the Pickles (1998) spectral library for NICMOS filters. The Pickles library includes an M2I star, which has a synthetic [F160W] [F222M] color of 0.52. We adopt this as the intrinsic color of the clusters, and allow for a scatter of when calculating uncertainties.
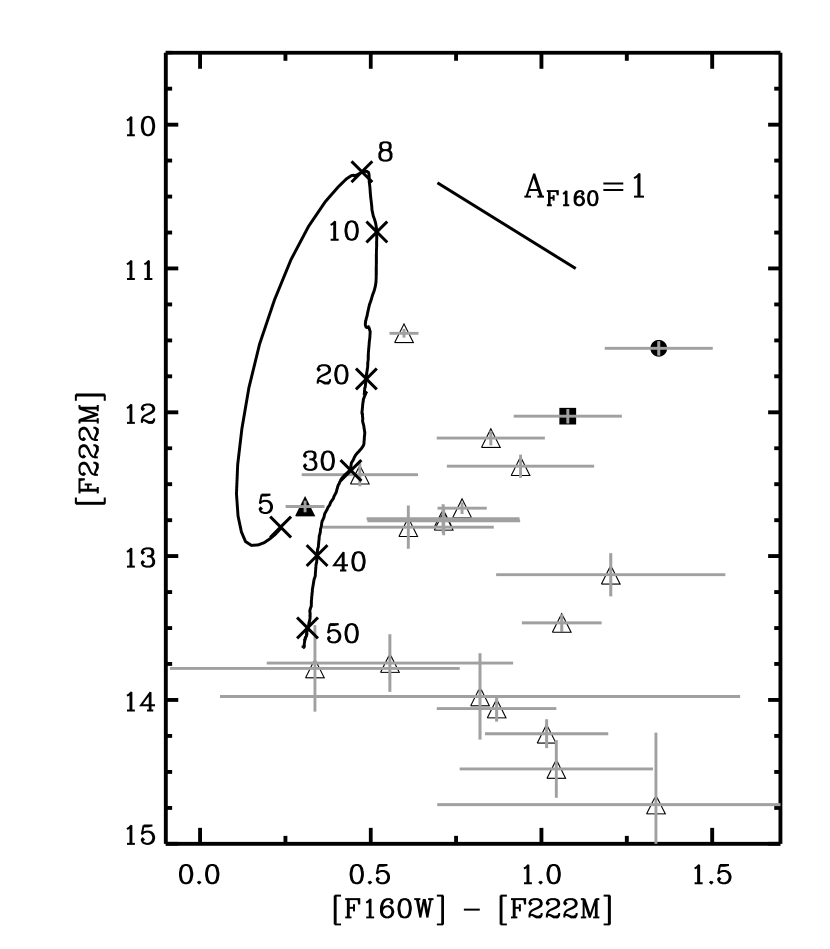
Evolutionary tracks from population synthesis models predict a similar color ([F160W] [F222M] ) for the clusters, as seen in the color-magnitude diagram (CMD) for the nuclear starburst (Figure 7). The Starburst99 (Leitherer et al. 1999) models used generate and magnitudes on the Johnson system. We used the method of Marleau et al. (2000) to determine the color transformation between the Starburst99 output and the NICMOS filters:
Using the data in Table 3, the [F160W] [F222M] colors of MGG-9 and MGG-11 are and , respectively. Subtracting the adopted intrinsic color of the clusters, we find color excesses of E([F160W] [F222M]) for MGG-9 and for MGG-11. Applying the extinction law of Cardelli et al. (1989), we estimate the extinction in the F160W bandpass as . Thus we find for MGG-9 and for MGG-11.
As noted by Cardelli et al., there exists a single extinction law for m. As such, the estimated extinction is independent of assumptions regarding the value of . For reference, if , and if , . The clusters plotted in Figure 7 display differential extinction, from zero to as high as perhaps 12 magnitudes in . This is not surprising given the range of background intensities of the diffuse emission seen in the NICMOS images (Figure 1). Extinction plays a critical role in determining the light-to-mass ratios of the clusters (Section 5.4). Observers should be wary when attempting to trace star formation with UBV photometry and optical spectra in dusty starburst and interacting galaxies.
5.3 Ages
The ages of the SSCs may be constrained by several inferences drawn from their spectra. The absence of nebular emission lines indicates that there are no O stars remaining in the clusters. This sets a lower age limit of about 6–7 Myr, the main sequence lifetime of O stars. As noted above, the spectra are dominated by the light of red supergiant stars as evidenced by the strong photospheric CO absorption. This is broadly consistent with somewhat older starburst populations (ages yrs).
Cool, intrinsically luminous asymptotic giant branch (AGB) stars contribute substantially to the near-IR light of clusters between ages 0.3 to 1.5 Gyr, dominating the near-IR light at Myr (Mouhcine & Lançon 2002). The thermally-pulsing AGB (TP-AGB) phase begins to significantly affect the near-IR colors of a population at an age of about 100 Myr. The TP-AGB phase is not modelled by the Geneva evolutionary tracks used in Starburst99, compromising the applicability of the population synthesis models beyond this point. The deep CO bands of TP-AGB stars could be mistaken for features of RSG stars in a younger population in the absence of other age indications (Gilbert 2002). Unfortunately, the best test for the predominance of AGB stars, the H2O/C2 index (Lançon et al. 1999), falls just outside our spectral range at 1.77m. However, Förster Schreiber (1998) notes that none of the features expected of AGB stars are present in her near-IR spectra of the nuclear region of M82, setting an upper age limit of yrs.
We can estimate the age range more precisely through population synthesis modelling. Gilbert (2002) used Starburst99 models to predict the flux-weighted average spectral type as a function of cluster age. Applying this technique at -band, we find that the light of a cluster population is dominated by M0 stars, as indicated by our cross-correlation analysis for these SSCs, at two different ages in a Salpeter IMF model: 5–7 Myr and 12–14 Myr. The former can be ruled out in this case, as there are no O stars present. During the intervening period (7–12 Myr), the dominant spectral type in -band is later than M0, but is at no time later than M3. The latest template star in our high-resolution NIRSPEC spectral atlas is type M4.5; this spectral type matches the cluster spectra as well as the M0 template. This suggests that the best match is likely M2 or M3, spectral types as yet missing from our template atlas. We therefore estimate ages of 7–12 Myr. This is consistent with the 10–12 Myr age of the “older” burst population found by Förster Schreiber (1998) for the nuclear starburst region.
Figure 7 shows the CMD for the nuclear clusters. For context, we have overplotted an evolutionary track based upon a model M⊙ cluster with a Kroupa IMF (Section 5.4) for stellar masses of 0.1 to 100 M⊙. The clusters fall in a region which is consistent with ages of 8 to 60 Myr, and exhibit differential extinction (Section 5.2). Ages cannot be read directly from Figure 7 because of the dependence of F222M luminosity on total mass. Dereddening MGG-9 until it meets the evolutionary track for a cluster with its derived mass of M⊙, we find a most likely age of approximately 10 Myr. When dereddened, MGG-11 is too bright for the Kroupa IMF evolutionary track corresponding to its derived mass at any age. Using the evolutionary track of a Salpeter IMF truncated at a minimum mass of 1 M⊙, we find a most likely age for MGG-11 of approximately 9 Myr. This is discussed further in Section 5.4, along with predictions of the time evolution of light-to-mass ratios. It should be noted, however, that these age estimates are based on an assumed IMF, and cannot therefore be used to infer information on the stellar content. For this purpose, we will use the IMF independent age estimates of 7-12 Myr.
Measurement of the half-light radii and velocity dispersions provides an estimate of the dynamical (crossing) times for the clusters. Both MGG-9 and MGG-11 have years. The clusters are clearly hundreds of crossing times old and thus gravitationally bound. Calculating the characteristic relaxation time using the prescription of Meylan (1987), we find years for these SSCs. At the present young ages of the clusters, we do not expect significant, cluster-wide dynamical mass segregation. (See Section 5.4 for further discussion on mass segregation.)
Smith & Gallagher (2001) estimated the age of MGG-F as Myr. Our population synthesis models indicate a younger age of Myr. In the age range of 25–40 Myr, the cluster light in -band is dominated by the light of G-type stars. This implies E([F160W]–[F222M]) for MGG-F and thus , in close agreement with the estimated of Smith & Gallagher.
5.4 Light-to-Mass Ratios and the IMF
The near-infrared light of SSCs older than Myr is dominated by high-luminosity, massive, evolved stars. Lower-mass stars contribute very little to the spectrum of a young SSC, even if they comprise a majority of the cluster’s mass. Measurement of the cluster’s kinematic mass enables detection of the presence of low-mass stars independent of any assumptions regarding the form of the IMF. Quantification of the low-mass stellar content in turn provides insight as to whether the SSC can remain gravitationally bound over a globular cluster lifetime.
From our photometry, we determine the total luminosity of the clusters in the F160W filter: (where Hz for the filter bandwidth of Å). Before adjustment for interstellar extinction, we find of (in solar units, L⊙/M⊙) for MGG-9 and for MGG-11. Dereddening by the estimated extinctions (Section 5.2) gives of for MGG-9 and for MGG-11.
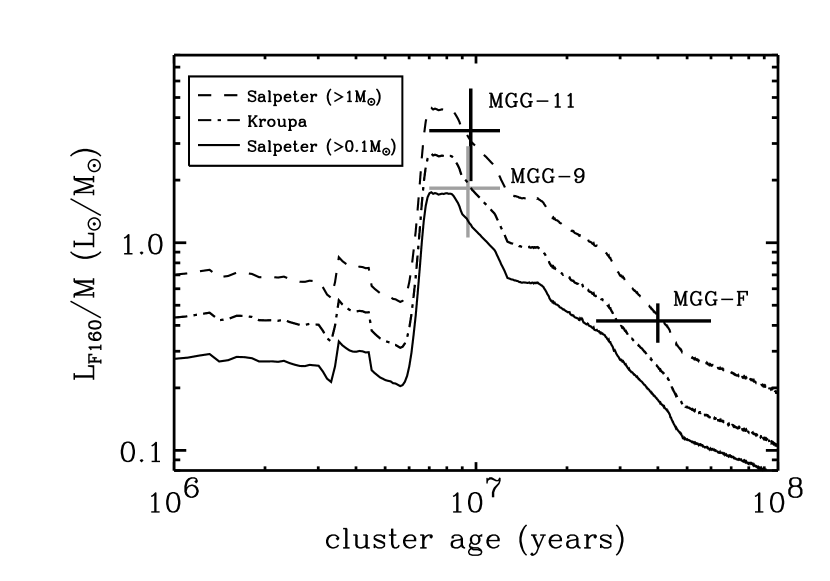
Figure 8 shows predicted ratios as a function of cluster age, based on population synthesis models. We have plotted models for three different IMF forms: a Salpeter (1955) power-law IMF with stellar masses of 0.1–100 M⊙, a Kroupa (2001) IMF, and a Salpeter power law truncated with a minimum stellar mass of 1M⊙.
The stellar IMF is more complex than a single power law IMF extending down to the lowest stellar masses (see review in Meyer et al. 2000). In general, the IMF is represented as a broken power law, with one slope for the distribution of high-mass stars and a lower slope or slopes for the low-mass (M⊙) stars. The overall effect of such a distribution is to reduce the relative proportion of low-mass stars with respect to a single-slope power law distribution. The Kroupa IMF is respresentative: where
We find that the ratio of MGG-9 is consistent with a solar-metallicity Kroupa IMF for the cluster’s age and dereddened luminosity. It does not appear that there is any dimunition in the relative proportion of low-mass stars in this cluster. MGG-11, however, has a dereddened luminosity which is too bright for a Kroupa IMF at any age. MGG-11 appears to be deficient in low-mass stars. This suggests either a non-standard IMF or mass segregation within the cluster (see below). For comparison, Figure 8 shows the ratio of a single-power law IMF (with , as in a Salpeter IMF) which is truncated at a minimum mass of 1M⊙. Such a distribution of stellar masses would lead to a ratio consistent with our observations for MGG-11.
We also consider MGG-F. Using the mass estimate of Smith & Gallagher (2001) in combination with our photometry, we find a dereddened . This light-to-mass ratio is likely too high for the cluster’s age and a standard Kroupa IMF, again suggesting a deficiency of low-mass stars. Smith & Gallagher conclude that the lower mass limit is 2–3M⊙ for a power-law IMF of slope ; our lower estimate of the age suggests that the lower mass cutoff need only occur around 1M⊙.
As noted in Section 4, there is evidence of mass segregation in MGG-F. The relaxation timescale is too great for significant dynamical mass segregation to have occurred throughout clusters MGG-9 and MGG-11 (ages yr). Numerical simulations by Bonnell & Davies (1998) indicate that although clusters younger than their relaxation timescale are not fully mass-segregated, they are likely to show some measure of mass segregation at young ages. Specifically, mass segregation of the most massive stars is known to occur more rapidly than relaxation of the entire cluster (Gerhard 2000). The near-IR light is dominated by RSG stars which are evolved from high-mass main sequence stars — stars which are expected to approach energy equipartition most rapidly. In addition, there is evidence of primordial mass segregation in young massive clusters such as the Orion Nebula Cluster (Hillenbrand & Hartmann 1998), R136 in 30 Doradus (e.g., Brandl et al. 1996), and several clusters in the Large Magellanic Cloud (de Grijs et al. 2002b). If star formation processes have conspired to concentrate high mass stars at the center of the clusters, the relaxation timescale there will be shorter; dynamical mass segregation will proceed more rapidly at the core of the clusters, on the order of a few crossing times (de Grijs et al. 2002a). As a result, the cores of SSCs may undergo significant dynamical evolution in as little as 25 Myr (de Grijs et al. 2002c), somewhat younger than MGG-F.
It is therefore not unlikely that there is significant mass segregation, either primordial or dynamical, in the clusters. In that case, the RSG starlight observed in F160W samples only the inner portion of the clusters which is dominated by evolved high-mass stars. The velocity dispersions determined by our cross-correlation analysis are affected by only the mass located within the volume occupied by RSG stars. If a significant amount of mass lies at larger radii, the half-light radius measured for the RSG stars will not trace the half-mass radius, leading to an underestimation of the cluster mass.
If, for example, the half-mass radius of cluster MGG-11 is greater than the measured RSG half-light radius by a factor of 1.5, the ratio would be in line with a standard Kroupa IMF. Under such a segregation of masses, the RSG stars would occupy a volume filling factor of 30% within the cluster.
5.5 Fate of the Clusters
Whether SSCs MGG-9 and MGG-11 will resemble globular clusters 10–15 billion years from now depends in large part upon two issues: whether the clusters can remain bound despite mass loss due to stellar evolution and whether that evolution leads to a mass function simliar to old globular clusters. We will deal with these issues in turn.
With ages in excess of 7 Myr, the OB stars formed in the clusters have begun evolving off the main sequence. We see no spectral evidence of nebular emission; stellar winds and ionization from the massive stars have cleared residual gas from the clusters’ formation. In addition, any O stars in the clusters have likely exploded as supernovae, clearing any gas not removed gradually during the main sequence lifetime of the OB stars. Studies (e.g., Hills 1980; Goodwin 1997) have shown that loss of more than half of a cluster’s mass in less than a crossing time can dissociate the cluster.222However, stars in the low velocity tail of the distribution function can remain bound in spite of loss of as much as 80% of the cluster mass (e.g., Adams 2000). The context for such studies is expulsion of residual gas and the implied star formation efficiencies of bound clusters. Although the residual gas has been removed from MGG-9 and MGG-11, the clusters will continue to lose mass over time due to evolution of the member stars. If the mass loss is gradual, the stellar orbits have time to adjust to the new potential and the cluster will simply expand to a new equilibrium radius. The remaining opportunity for substantial, impulsive gas loss is from supernovae of B stars. For a standard Kroupa IMF, 14% of the cluster’s mass is in stars with mass M⊙. Truncating the lower end of the IMF at 1M⊙ shifts more of the cluster’s mass to these supernova progenitors: 35% would be in stars with mass M⊙. In either case, however, there is not enough mass for impulsive mass loss via supernovae to dissociate the clusters.
While the clusters are likely to remain bound in spite of internal threats, they still must face various external destruction mechanisms (e.g., evaporation, disk-shocking and dynamical friction). Although the prospects of these clusters against these mechanisms is beyond the scope of the present work, we can make some general comments. Low-mass clusters are more easily dispersed by each of these processes (Ashman & Zepf 1998); the large masses of MGG-9 and MGG-11 (relative to Galactic globular clusters) will make these clusters less prone to disruption. The low galactocentric radii of the clusters, however, will tend to make them more prone to disruption by dynamical friction.
The second issue is whether the SSCs will resemble globular clusters after 10–15 Gyr of stellar evolution. The most metal-poor globular clusters in the Galaxy are about 15 Gyr old (Vandenberg et al. 1996), with little or no dispersion in age among the Galactic globular cluster system (Stetson et al. 1996). These old globular clusters have main sequence turn-offs at M⊙, with higher-mass stars having evolved, leaving behind remnants. Sternberg (1998) quotes typical mass fractions for the component objects in globular clusters: MS, WD, and NS for the fraction of the mass contained in main sequence stars, white dwarfs and neutron stars, respectively. Applying Sternberg’s simple model for mapping main sequence progenitors to remnants, we are able to estimate the composition of a cluster after 15 Gyr of evolution (assuming the cluster remains bound and loses no stars, e.g. due to evaporation).
For the case of a power law IMF truncated at a lower mass of 1 M⊙, it is clear that no stars will remain on the main sequence after 15 Gyr; such a cluster could not resemble a globular cluster as described here. More interesting are the effects of evolution on the Kroupa IMF of Section 5.4. After 15 Gyr, the cluster will have lost 51% of its SSC mass (i.e., the mass present at an age of 10 Myr). The composition of the cluster would be MS, WD, and NS. This is similar to the typical globular cluster composition quoted by Sternberg, but with a larger proportion of the mass in the form of stellar remnants. Evolving MGG-9 for a globular cluster lifetime of 15 Gyr leaves a cluster of M M⊙ with a composition somewhat high in remnants but not dissimilar to Galactic globular clusters.
Finally, we note that low-mass stars are preferentially lost in the process of stellar evaporation. This effect is exacerbated by mass segregation, as low-mass stars are in a shallower potential and have lower escape velocities. Dynamical effects are likely to decrease the mass fraction of low-mass main sequence stars, particularly in low-mass clusters for which these effects are strongest.
6 Conclusions
We have used high resolution near-IR spectra to measure the velocity dispersions of two spatially-resolved super star clusters in the nuclear starburst of M82. We have combined these data with high-resolution NICMOS images to determine the kinematic masses and light-to-mass ratios of these SSCs. The near-IR spectra of the clusters are dominated by the light of RSG stars, consistent with ages of 7–12 Myr.
The derived masses, sizes and ages are consistent with the hypothesis that the SSCs are young globular clusters. Whether they can evolve into objects resembling old Galactic globular clusters depends upon the IMF of the clusters. When compared to population synthesis models, the light-to-mass ratio of MGG-9 appears to be consistent with a standard Kroupa IMF, and the cluster could resemble a globular cluster 15 Gyr from now. The light-to-mass ratios of MGG-11 and MGG-F suggest a deficiency of low-mass stars; it is unlikely that the composition of these clusters will resemble globular clusters after 15 Gyr of stellar evolution. There is evidence for mass segregation in MGG-F; if the red supergiant stars are sampling only the inner portion of the clusters, our mass estimates would represent lower limits. This could account for the apparent deficiency of low-mass stars and bring the ratios in line with standard IMFs. The presence of mass segregation would further suggest that the SSCs are scaled-up, high-mass analogues of young Galactic clusters (e.g., the Orion Nebula Cluster and NGC 3603).
These results are critically dependent on extinction estimates. The population of clusters in the nuclear starburst suffers from a wide range of differential extinction, complicating optical studies. The lower extinction in the near-infrared is a distinct advantage in determination of cluster properties in young, dusty starburst regions.
In order to assess whether the young SSCs in M82 can evolve into a population of old globular clusters, they should be characterized both as a system and as individual objects. The present work represents a pilot project in preparation for a more complete study of the SSCs in the nuclear starburst. We have undertaken an observing program at the Keck Observatory to use NIRSPEC to measure velocity dispersions for additional SSCs in the nuclear starburst. With these spectra, we will determine the masses and light-to-mass ratios for the population of SSCs and examine the luminosity and mass functions of the cluster system. The presence of system-wide deviations from a standard IMF would be more compelling than suggestive results for individual clusters.
References
- Adams (2000) Adams, F. C. 2000, ApJ, 542, 964
- Appleton et al. (1981) Appleton, P. N., Davies, R. D., & Stephenson, R. J. 1981, MNRAS, 195, 327
- Ashman & Zepf (1998) Ashman, K. M. & Zepf, S. E. 1998, Globular Cluster Systems (New York : Cambridge University Press)
- Bonnell & Davies (1998) Bonnell, I. A. & Davies, M. B. 1998, MNRAS, 295, 691
- Brandl et al. (1996) Brandl, B., Sams, B. J., Bertoldi, F., Eckart, A., Genzel, R., Drapatz, S., Hofmann, R., Loewe, M., & Quirrenbach, A. 1996, ApJ, 466, 254
- Cardelli et al. (1989) Cardelli, J. A., Clayton, G. C., & Mathis, J. S. 1989, ApJ, 345, 245
- de Grijs et al. (2002a) de Grijs, R., Gilmore, G. F., Johnson, R. A., & Mackey, A. D. 2002a, MNRAS, 331, 245
- de Grijs et al. (2002b) de Grijs, R., Gilmore, G. F., Mackey, A. D., Wilkinson, M. I., Beaulieu, S. F., Johnson, R. A., & Santiago, B. X. 2002b, MNRAS, 337, 597
- de Grijs et al. (2002c) de Grijs, R., Johnson, R. A., Gilmore, G. F., & Frayn, C. M. 2002c, MNRAS, 331, 228
- de Grijs et al. (2001) de Grijs, R., O’Connell, R. W., & Gallagher, J. S. 2001, AJ, 121, 768
- Eisenhauer (2001) Eisenhauer, F. 2001, in Starburst Galaxies: Near and Far, ed. L. Tacconi & D. Lutz (Berlin: Springer), 24
- Förster Schreiber (1998) Förster Schreiber, N. M. 1998, PhD thesis, Lugwig-Maximilians-Universität München
- Förster Schreiber et al. (2001) Förster Schreiber, N. M., Genzel, R., Lutz, D., Kunze, D., & Sternberg, A. 2001, ApJ, 552, 544
- Freedman et al. (1994) Freedman, W. L., Hughes, S. M., Madore, B. F., Mould, J. R., Lee, M. G., Stetson, P., Kennicutt, R. C., Turner, A., Ferrarese, L., Ford, H., Graham, J. A., Hill, R., Hoessel, J. G., Huchra, J., & Illingworth, G. D. 1994, ApJ, 427, 628
- Gerhard (2000) Gerhard, O. 2000, in ASP Conf. Ser. 211: Massive Stellar Clusters, ed. A. Lançon & C. M. Boily (San Francisco: ASP), 12
- Gilbert (2002) Gilbert, A. M. 2002, PhD thesis, Univ. of California, Berkeley
- Gilbert & Graham (2001) Gilbert, A. M. & Graham, J. R. 2001, in Starburst Galaxies: Near and Far, ed. L. Tacconi & D. Lutz (Berlin: Springer), 123
- Gilbert & Graham (2002) Gilbert, A. M. & Graham, J. R. 2002, in IAU Symposium 207: Extragalactic Star Clusters, ed. D. Geisler, E. K. Grebel, & D. Minniti (San Francisco: ASP), 471
- Gilmore (2001) Gilmore, G. 2001, in Starburst Galaxies: Near and Far, ed. L. Tacconi & D. Lutz (Berlin: Springer), 34
- Goodwin (1997) Goodwin, S. P. 1997, MNRAS, 284, 785
- Gray & Toner (1987) Gray, D. F. & Toner, C. G. 1987, ApJ, 322, 360
- Heckman (1998) Heckman, T. M. 1998, in ASP Conf. Ser. 148: Origins, ed. C. E. Woodward, J. M. Shull, & H. A. Thronson (San Francisco: ASP), 127
- Hillenbrand & Hartmann (1998) Hillenbrand, L. A. & Hartmann, L. W. 1998, ApJ, 492, 540
- Hills (1980) Hills, J. G. 1980, ApJ, 235, 986
- Ho & Filippenko (1996a) Ho, L. C. & Filippenko, A. V. 1996a, ApJ, 466, L83
- Ho & Filippenko (1996b) —. 1996b, ApJ, 472, 600
- King (1962) King, I. 1962, AJ, 67, 471
- Krist (1995) Krist, J. 1995, in ASP Conf. Ser. 77: Astronomical Data Analysis Software and Systems IV, ed. R. Shaw, H. E. Payne, & J. E. Hayes, Vol. 4 (San Francisco: ASP), 349
- Kronberg et al. (1972) Kronberg, P. P., Pritchet, C. J., & van den Bergh, S. 1972, ApJ, 173, L47
- Kroupa (2001) Kroupa, P. 2001, MNRAS, 322, 231
- Lançon et al. (1999) Lançon, A., Mouhcine, M., Fioc, M., & Silva, D. 1999, A&A, 344, L21
- Leitherer et al. (1999) Leitherer, C., Schaerer, D., Goldader, J. D., Delgado, R. M. G. ., Robert, C., Kune, D. F., de Mello, D. . F., Devost, D., & Heckman, T. M. 1999, ApJS, 123, 3
- Marleau et al. (2000) Marleau, F. R., Graham, J. R., Liu, M. C., & Charlot, S. 2000, AJ, 120, 1779
- McLean et al. (1998) McLean, I. S., Becklin, E. E., Bendiksen, O., Brims, G., Canfield, J., Figer, D. F., Graham, J. R., Hare, J., Lacayanga, F., Larkin, J. E., Larson, S. B., Levenson, N., Magnone, N., Teplitz, H., & Wong, W. 1998, in Proc. SPIE Vol. 3354, Infrared Astronomical Instrumentation, ed. A. M. Fowler (Bellingham: SPIE), 566
- McLeod et al. (1993) McLeod, K. K., Rieke, G. H., Rieke, M. J., & Kelly, D. M. 1993, ApJ, 412, 111
- Mengel et al. (2002) Mengel, S., Lehnert, M. D., Thatte, N., & Genzel, R. 2002, A&A, 383, 137
- Meurer et al. (1995) Meurer, G. R., Heckman, T. M., Leitherer, C., Kinney, A., Robert, C., & Garnett, D. R. 1995, AJ, 110, 2665
- Meyer et al. (2000) Meyer, M. R., Adams, F. C., Hillenbrand, L. A., Carpenter, J. M., & Larson, R. B. 2000, in Protostars and Planets IV, ed. V. Mannings, A. P. Boss, & S. S. Russell (Tucson: Univ. Arizona Press), 121
- Meylan (1987) Meylan, G. 1987, A&A, 184, 144
- Miller & Scalo (1978) Miller, G. E. & Scalo, J. M. 1978, PASP, 90, 506
- Mouhcine & Lançon (2002) Mouhcine, M. & Lançon, A. 2002, A&A, 393, 149
- O’Connell et al. (1995) O’Connell, R. W., Gallagher, J. S., Hunter, D. A., & Colley, W. N. 1995, ApJ, 446, L1
- Pickles (1998) Pickles, A. J. 1998, PASP, 110, 863
- Rieke et al. (1993) Rieke, G. H., Loken, K., Rieke, M. J., & Tamblyn, P. 1993, ApJ, 412, 99
- Salpeter (1955) Salpeter, E. E. 1955, ApJ, 121, 161
- Satyapal et al. (1997) Satyapal, S., Watson, D. M., Pipher, J. L., Forrest, W. J., Greenhouse, M. A., Smith, H. A., Fischer, J., & Woodward, C. E. 1997, ApJ, 483, 148
- Shen & Lo (1995) Shen, J. & Lo, K. Y. 1995, ApJ, 445, L99
- Smith & Gallagher (2001) Smith, L. J. & Gallagher, J. S. 2001, MNRAS, 326, 1027
- Spitzer (1987) Spitzer, L. 1987, Dynamical Evolution of Globular Clusters (Princeton, NJ, Princeton University Press, 1987)
- Spitzer (1969) Spitzer, L. J. 1969, ApJ, 158, L139
- Sternberg (1998) Sternberg, A. 1998, ApJ, 506, 721
- Stetson et al. (1996) Stetson, P. B., Vandenberg, D. A., & Bolte, M. 1996, PASP, 108, 560
- Tonry & Davis (1979) Tonry, J. & Davis, M. 1979, AJ, 84, 1511
- Vandenberg et al. (1996) Vandenberg, D. A., Stetson, P. B., & Bolte, M. 1996, ARA&A, 34, 461
- Zepf et al. (1999) Zepf, S. E., Ashman, K. M., English, J., Freeman, K. C., & Sharples, R. M. 1999, AJ, 118, 752


| Template Star | Spectral Type | Date | Airmass | Atmospheric Calibrator |
|---|---|---|---|---|
| HR 3459 | G2Iab | 2000 Dec 10 | 1.12 | HR 2432 (B1Ib) |
| HD 186293 | K0I | 2001 Jun 17 | 1.08 | HR 7767 (O9V) |
| HR 2119 | K0II | 2000 Dec 10 | 1.26 | HR 2432 (B1Ib) |
| HR 8248 | K1Iab | 2001 Jun 17 | 1.11 | HR 7767 (O9V) |
| HD 38054 | K3III | 2002 Feb 23 | 1.53 | HD 32249 (B3V) |
| HD 201251 | K4Iab | 2001 Jun 17 | 1.14 | HR 7767 (O9V) |
| HD 185622 | K4Ib | 2001 Jun 17 | 1.08 | HR 7767 (O9V) |
| HD 200905 | K4.5Ib | 2001 Jun 17 | 1.10 | HR 7767 (O9V) |
| HD 43335 | K5Iab | 2002 Feb 23 | 1.18 | HD 41753 (B3V) |
| HR 2289 | M0Iab | 2000 Dec 10 | 1.28 | HR 2432 (B1Ib) |
| HD 14488 | M4.5Iab | 2003 Jan 19 | 1.26 | HD 14372 (B5V) |
| MGG-9 | MGG-11 | ||||
|---|---|---|---|---|---|
| Template | Spectral | Cross-Correlation | bb is the stellar velocity dispersion as determined from the cross-correlation function. | Cross-Correlation | bb is the stellar velocity dispersion as determined from the cross-correlation function. |
| Star | Type | PeakaaMaximum value of the cross-correlation function. | (km s-1) | PeakaaMaximum value of the cross-correlation function. | (km s-1) |
| HR 3459 | G2Iab | ||||
| HD 186293 | K0I | ||||
| HR 2119 | K0II | ||||
| HR 8248 | K1Iab | ||||
| HD 38054 | K3III | ||||
| HD 201251 | K4Iab | ||||
| HD 185622 | K4Ib | ||||
| HD 200905 | K4.5Ib | ||||
| HD 43335 | K5Iab | ||||
| HR 2289 | M0Iab | ||||
| HD 14488 | M4.5Iab | ||||
| SSC | MGG | R.A.††Offsets from coordinates: R.A. = 09 55 00.0, Dec. = 69 40 00.0 (J2000.0). The quoted astrometry is . | Dec.††Offsets from coordinates: R.A. = 09 55 00.0, Dec. = 69 40 00.0 (J2000.0). The quoted astrometry is . | ∗∗Total magnitudes (uncorrected for reddening) based upon integration of King model fits to the data. | ∗∗Total magnitudes (uncorrected for reddening) based upon integration of King model fits to the data. | ‡‡The projected half-light radius, , is based on King model fits to the F160W image. |
|---|---|---|---|---|---|---|
| (sec) | (arcsec) | (mags) | (mags) | (mas) | ||
| J0955468+694937 | L | 46.8 | 37.1 | 12.05 0.03 | 11.45 0.03 | 83 10 |
| J0955471+694940 | F | 47.1 | 40.8 | 12.96 0.04 | 12.65 0.04 | 89 11 |
| J0955483+694941 | b | 48.3 | 41.0 | 14.5 0.1 | 13.46 0.06 | 113 14 |
| J0955488+694942 | c | 48.8 | 42.5 | 16.1 0.4 | 14.7 0.5 | 73 9 |
| J0955489+694940 | d | 48.9 | 40.5 | 15.5 0.2 | 14.5 0.2 | 94 11 |
| J0955502+694945 | 11 | 50.2 | 45.1 | 13.10 0.15 | 12.03 0.05 | 66 8 |
| J0955505+694945 | 9 | 50.5 | 45.1 | 12.90 0.15 | 11.55 0.05 | 146 18 |
| J0955506+694942 | 8 | 50.6 | 42.9 | 14.3 0.3 | 13.13 0.15 | 91 11 |
| J0955510+694946 | 7 | 51.0 | 46.6 | 13.4 0.2 | 12.80 0.15 | 156 19 |
| J0955513+694946 | 6 | 51.3 | 46.8 | 13.03 0.15 | 12.18 0.05 | 79 9 |
| J0955525+694943 | k | 52.5 | 43.2 | 14.1 0.3 | 13.8 0.3 | 166 20 |
| J0955526+694943 | m | 52.6 | 43.0 | 14.8 0.7 | 14.0 0.3 | 79 9 |
| J0955528+694950 | q | 52.8 | 50.6 | 14.3 0.3 | 13.7 0.2 | 113 14 |
| J0955529+694944 | 3 | 52.9 | 44.4 | 13.3 0.2 | 12.37 0.08 | 90 11 |
| J0955535+694949 | 1a | 53.5 | 49.7 | 12.90 0.15 | 12.43 0.08 | 119 14 |
| J0955536+694948 | 1b | 53.6 | 48.4 | 13.5 0.2 | 12.8 0.1 | 108 13 |
| J0955537+694949 | 1c | 53.8 | 49.4 | 13.5 0.2 | 12.7 0.1 | 87 11 |
| J0955548+694953 | r | 54.8 | 53.9 | 13.43 0.06 | 12.67 0.04 | 101 12 |
| J0955560+694952 | s | 56.0 | 52.3 | 15.25 0.15 | 14.2 0.1 | 105 13 |
| J0955571+694954 | t | 57.1 | 54.0 | 14.93 0.15 | 14.06 0.09 | 100 12 |
Note. — As recommended by the IAU, we have assigned each SSC a principal, coordinate-based designation. In addition, we refer to each source by a shorter nickname, prefaced by an acronym composed of the authors’ initials, MGG.