Chapter 1 Propagation of Light Elements in the Galaxy
LANL Report # LA-UR-03-3406
Abstract
The origin and evolution of isotopes of the lightest elements H2, He3, Li, Be, B in the universe is a key problem in such fields as astrophysics of CR, Galactic evolution, non-thermal nucleosynthesis, and cosmological studies. One of the major sources of these species is spallation by CR nuclei in the interstellar medium. On the other hand, it is the B/C ratio in CR and Be10 abundance which are used to fix the propagation parameters and thus the spallation rate. We study the production and Galactic propagation of isotopes of elements using the numerical propagation code GALPROP and updated production cross sections.
1. Introduction
It has been shown recently [9] that accurate measurements of the antiproton flux made during the last solar minimum [12] pose a challenge to conventional CR propagation models. A solution has been proposed [10] that the observed CR may contain a fresh, local, “unprocessed” component at low energies (LE), perhaps associated with the Local Bubble (LB). This component reduces the production of B at LE allowing to fit the B/C ratio and antiproton flux simultaneously. For more discussion see [11].
Isotopes of the lightest elements H2, He3, Li, Be, B in CR are almost all secondary, being produced in spallations of heavier nuclei on interstellar gas Galaxy-wide. Their abundances and isotopic composition, therefore, might help to distinguish between the propagation models. In this study we calculate abundances and isotopic composition of H, He, Li, Be, B in two models, a conventional reacceleration model [9], and a model with a local component [10].
2. The Model
In our calculations we use the propagation model GALPROP (2D option) as described elsewhere [9,14]. The nucleon injection spectrum of the Galactic CR is taken as a modified power law in rigidity [6], for the injected particle density. The LB spectrum is taken as a power law in rigidity with exponential cut off. The Galactic halo size is fixed at 4 kpc. To reduce possible errors due to the cross sections we use our own fits to the data on reactions and that produce most of these elements [8]. The heliospheric modulation is treated using the force-field approximation; here we use MV for all plots.
In the case of a conventional reacceleration model (model ) we use our standard methodologies: the propagation parameters were derived from the fit to the B/C ratio, while source abundances were tuned to ACE data [15] and HEAO-3 data [4] at high energies (HE). No special tuning was done for antiprotons.
In the case of the model with a local component (model ) we use the following procedure. The HE part of the B/C ratio plus antiproton flux measurements are used to restrict the value of the diffusion coefficient and its energy dependence, while the LE part of the B/C ratio is used to fix the reacceleration level and define the parameters of the LB component. In this way the model provides the best fit to all data at the cost of extra free parameters.
Model parameters are given in Table 1; model is similar to models DR/DRB as defined in [9], and model is similar to model DR II as defined in [10]. To better match the He spectrum (Fig. 1), a major contributor to H2 and He3 production, in both models we introduced a break (at 14 GV in , and at 10 GV in ) in He4 (only) power-law injection spectrum.
| Injection | Diffusion coeff. at 3GV | Alfvén speed | Source | ||
|---|---|---|---|---|---|
| Model | index, | , cm2 s-1 | Index, | , km s-1 | abundances |
| 1.94/2.42 | 0.33 | 36 | LE=HE | ||
| 1.69/2.28 | 0.47 | 23 | LBGalactic CR | ||
3. Results
Fig. 2 shows the H2/He4 ratio. The measured ratio [2] is a factor of 1.8 larger than expected. While there are important hints that this may be caused by systematic effects, the analysis is still in progress (D. Vasilas private comm.).
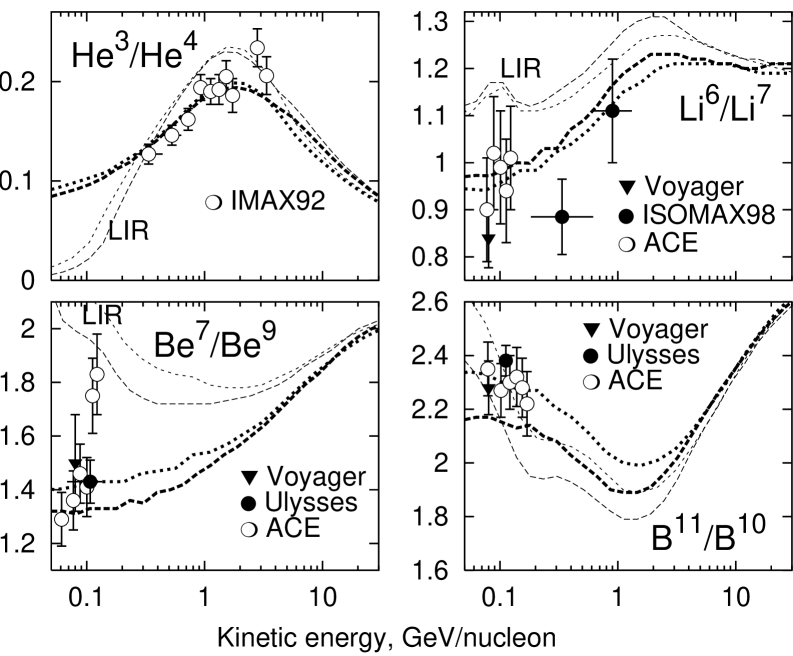
Fig. 3 shows other ratios. Both models are consistent with data on isotopic ratios of Li, Be, and B given the large error bars. He3/He4 ratio is more sensitive. Both models agree well with the data, however to match the He3/He4 ratio and He spectrum, model requires a factor of 2 larger LB abundance of He4. The HE CR source abundance in both models He/Si , while the LB abundance in model is 220 (cf. solar system value 2400). Taking into account that He and Si are abundant elements a factor of 2 difference is significant. Contributions of C12 and O16 to He3 and He4 production appear to be non-negligible.
The smaller proportion of He compared to heavier elements in Galactic CR sources supports the idea that HE CR are accelerated in shocks from fresh SN ejecta. The higher proportion of He compared to heavier elements in model at LE implies that the material was diluted before acceleration. This is in line with the view described in [10] that the LB component may be accelerated by an ensemble of weak shock waves out of the interstellar medium. If the model is correct it may indicate that the LE part of the He and proton Galactic spectra is flatter than thought with corresponding consequences for the diffuse Galactic -ray emission and Galactic chemical evolution.
![[Uncaptioned image]](/html/astro-ph/0306349/assets/x1.png)
This work was supported in part by a NASA Astrophysics Theory Program grant and by the US Department of Energy.
4. References
1. Connell J.J. 1998, ApJ 501, L59
2. de Nolfo G.A. et al. 2000, in Proc. ACE-2000 Symp., ed. Mewaldt R.A. et al. (AIP: NY), AIP 528, 425
3. de Nolfo G.A. et al. 2001, in Proc. 27th ICRC (Hamburg), 1667
4. Engelmann J.J. et al. 1990, A&A 233, 96
5. Göbel H. et al. 2001, in Proc. 27th ICRC (Hamburg), 1663
6. Jones F.C., Lukasiak A., Ptuskin V., Webber W. 2001, ApJ 546, 264
7. Lukasiak A., McDonald F.B., Webber W.R. 1999, in Proc. 26th ICRC (Salt Lake City), 3, 41
8. Moskalenko I.V., Mashnik S.G. 2003, these Proc.
9. Moskalenko I.V., Strong A.W., Ormes J.F., Potgieter M.S. 2002, ApJ 565, 280
10. Moskalenko I.V., Strong A.W., Mashnik S.G., Ormes J.F. 2003, ApJ 586, 1050
11. Moskalenko I.V., Strong A.W., Mashnik S.G., Ormes J.F. 2003, these Proc.
12. Orito S. et al. 2000, Phys. Rev. Lett. 84, 1078
13. Reimer O. et al. 1998, ApJ 496, 490
14. Strong A.W., Moskalenko I.V. 1998, ApJ 509, 212
15. Wiedenbeck M.E. et al. 2001, Spa. Sci. Rev. 99, 15