Abstract
In this review, we take the reader on a journey. We start by looking at the properties of galaxies in the cores of rich clusters. We have focused on the overall picture: star formation in clusters is strongly suppressed relative to field galaxies at the same redshift. We will argue that the increasing activity and blue populations of clusters with redshift results from a greater level of activity in field galaxies rather than a change in the transformation imposed by the cluster environment. With this in mind, we travel out from the cluster, focusing first on the properties of galaxies in the outskirts of clusters and then on galaxies in isolated groups. At low redshift, we are able to efficiently probe these environments using the Sloan Digital Sky Survey and 2dF redshift surveys. These allow an accurate comparison of galaxy star formation rates in different regions. The current results show a strong suppression of star formation above a critical threshold in local density. The threshold seems similar regardless of the overall mass of the system. At low redshift at least, only galaxies in close, isolated pairs have their star formation rate boosted above the global average. At higher redshift, work on constructing homogeneous catalogs of galaxies in groups and in the infall regions of clusters is still at an early stage. In the final section, we draw these strands together, summarizing what we can deduce about the mechanisms that transform star-forming field galaxies into their quiescent cluster counterparts. We discuss what we can learn about the impact of environment on the global star formation history of the Universe.
Chapter 0 The Difference Between Clusters and
Groups: A Journey from Cluster
Cores to Their Outskirts and Beyond
1 Introduction
Let us start with an outline of this review. We will begin by looking at galaxies in the cores of clusters. We have been observing clusters for many years. Some milestones are the papers on the morphological differences between cluster galaxies and the general field (Hubble & Humason 1931), the discovery of a global morphology-density relation (Oemler 1974; Dressler 1980), and the realization of the importance of the color-magnitude relation (Sandage & Visvanathan 1978). We will attempt to summarize what we have learned from looking at clusters since this time. In particular, recent observations now span a wide range of redshift, allowing us to look directly at how the galaxy populations evolve.
In the second section, we will investigate how galaxy star formation rates vary with radius and local density. In particular, we will focus on the recent results from the 2dF galaxy redshift survey. The aim here is to understand how galaxy properties are influenced by their environment. As we will discuss, it seems that the group environment is critical to the evolution of galaxies, creating a distinctive threshold.
In the third section, we will review some of the ideas about how this can all be put together, and how we can hope to use the environmental studies that many groups are undertaking to build a better understanding of the evolution of the Universe.
Throughout, this paper will focus on galaxy star formation rates as the measure of galaxy properties, and will leave aside the whole issue of galaxy morphology for other reviewers to deal with. Clearly, the two issues are related since galaxy morphology partly reflects the strength of H ii regions in the galaxy disk (Sandage 1961), but the two factors are not uniquely linked. Morphology and star formation may be influenced differently by different environments (Dressler et al. 1997; Poggianti et al. 1999; McIntosh, Rix, & Caldwell 2003). We will also skirt around the important issue of E+A galaxies (Couch & Sharples 1987; Dressler & Gunn 1992; Barger et al. 1996; Balogh et al. 1999; Poggianti et al. 1999) and star formation that is obscured from view in the optical (Poggianti & Wu 1999; Smail et al. 1999; Duc et al. 2002; Miller & Owen 2002). These are discussed in detail in Poggianti (2003). Wherever possible we will use H as the star formation indicator (Kennicutt 1992), but as we probe to higher redshift, we are forced to use [O ii] 3727 unless we shift our strategy to infrared spectrographs.
We will also stick to talking about bright galaxies, by which we mean galaxies brighter than 1 mag fainter than . It would need another complete review if we were to compare the properties of dwarf galaxies over the same range of environments. A good place to start would be Drinkwater et al. (2001), or the many presentations on cluster dwarfs at this Symposium. By the same token, we will avoid discussion of the evolution of the galaxy luminosity function (Barger et al. 1998; De Propris et al. 1999); this is summarized in Rudnick et al. (2003).
To avoid confusion, it is worth laying out exactly what we mean by the terms “cluster” and “group.” We will use the term cluster to mean a virialized halo with mass greater than and the term group to mean a halo more massive than about (but less than ). If an isolated galaxy has a halo mass of order (Evans & Wilkinson 2000; Guzik & Seljak 2002; Sakamoto, Chiba, & Beers 2003), then our definition of a group contains more than five galaxies at the present day. At higher redshift, the conversion between mass and galaxy numbers is more complicated since it depends on whether evolves or not. If we stick to a definition in terms of mass, then at least everything is clear from a theoretical perspective, and we can make quite definite predictions about the numbers of such halos, their clustering as a function of redshift (Press & Schechter 1974; Jenkins et al. 2001; Sheth, Mo, & Tormen 2001), and how mass accumulates from smaller halos into large clusters (Bond et al. 1991; Bower 1991; Lacey & Cole 1993; Mo & White 2002).
2 Clusters of Galaxies
At the outset, its worth reminding ourselves of why we study galaxy evolution in clusters. One popular reason is that the cluster is a good laboratory in which to study galaxy evolution. Another is that it is “easy” — when we observe the galaxy spectra, we know that most objects will be in this dense environment and that our observations will be highly efficient. The same reason allows us to recognize clusters out to very high redshifts and thus to extend our studies to a very long baseline. But we should remember that clusters do have a significant drawback: they are rare objects. For the standard CDM cosmology (, , , ), the space density of halos is . Even though such clusters contain galaxies, less than 10% of the cosmic galaxy population is found in such objects.
There is an emerging consensus that suggests that the stellar populations of galaxies in cluster cores are generally old, with most of the stars formed at . Most of these galaxies also have early-type morphology. It is possible to derive remarkably tight constraints from looking at colors (Bower, Lucey, & Ellis 1992; Bower, Kodama, & Terlevich 1998; Gladders et al. 1998; van Dokkum et al. 1998), at the Mg- relation (Gúzman et al. 1992), or at the scatter in the fundamental plane (Jørgensen et al. 1999; Fritz et al. 2003). These results rely on the argument that recent star formation would lead to excessive scatter in these tight relations, unless it was in some way coordinated, or the color variations due to age were cancelled out by variations in metal abundance (Faber et al. 1999; Ferreras, Charlot, & Silk 1999). Line-index measurements generally suggest very old populations (Jørgensen 1999; Poggianti et al. 2001), but these relations tend to show somewhat more scatter. This has been interpreted as evidence for the cancellation effects in broad-band colors.
To improve the evidence, one can compare clusters at high redshift. For example, if we concentrate on the color-magnitude relation, we would expect the narrow relation seen in local clusters to break down as we approach the epoch when star formation was prevalent. In fact, we have discovered that the color-magnitude relation is well established in high-redshift clusters (Ellis et al. 1997; van Dokkum et al. 1998), and that the line-index correlations, fundamental plane (Kelson et al. 2001), and Tully-Fisher relation measurements (e.g., Metavier 2003; Ziegler et al. 2003; but see Milvang-Jensen et al. 2003) also show little increase in scatter compared to local clusters. So far, tight relations have been identified in clusters out to (van Dokkum et al. 2000; Barrientos et al. 2003; van Dokkum & Stanford 2003). The tight relation does eventually seem to break down, and we are not aware of any strong color-magnitude relation that has been identified in “proto-clusters” at .
There is a bias here, however, that should be clearly recognized . Although we are discovering that clusters at high redshifts seem also to contain old galaxies, this does not mean that all galaxies in local clusters must have these old populations. A large fraction of galaxies that are bound into local clusters would have been isolated “field” galaxies at . An even stronger bias of this type has been termed “progenitor bias” by van Dokkum & Franx (2001). They point out that if only a subset of the cluster populations is studied (for example only the galaxies with early-type morphology), then it is quite easy to arrive at a biased view. To get the full picture, one needs to study the galaxy population of the cluster as a whole.
An interesting strategy is therefore to simply measure the star formation rate in clusters at different epochs. The general consensus seems to be that there is little star formation (relative to field galaxies at the same redshift) in virialized cluster cores below . For example, Couch et al.’s (2001) survey of the AC114 cluster found that star formation was suppressed by an order of magnitude compared to the field. Similar levels of suppression are seen in poor clusters (Balogh et al. 2002). While these studies find some exciting objects (see Finn & Zaritsky 2003 for further examples), the general trend is for the star formation rate to be strongly suppressed relative to the field at the same redshift. infrared measurements (Duc et al. 2002) and radio measurements (Miller 2003; Morrison & Owen 2003) have generally come to similar conclusions. The E+A galaxies (Dressler & Gunn 1992) or post-starburst galaxies (Couch & Sharples 1987) are a puzzling exception. The large numbers found by the MORPHs group (Dressler et al. 1997) suggest that there was strong star formation activity in the recent past in many galaxies (but see Balogh et al. 1999). A possible explanation is that these galaxies have only recently arrived in the cluster from much lower-density environments. Indeed, field studies at low redshift have shown this type of object to be more common in low-density regions than in clusters (Zabludoff et al. 1996; Goto et al. 2003; Quintero et al. 2003). Therefore, the greater numbers of E+A galaxies found in high-redshift clusters may result from the greater star formation activity of galaxies outside clusters — this idea gains strong support from Tran et al.’s (2003) observations presented at the Symposium.
The next step is to compare the star formation rates in clusters cores at different redshifts. Work is only just starting on this using emission-line strengths (e.g., Ellingson et al. 2001), since it is essential to control systematic uncertainties, such as the aperture through which the star formation rate is measured. However, extensive comparisons have been made on the basis of colors, starting with Butcher & Oemler (1978, 1984) and Couch & Newell (1984). These papers showed a startling increase in the numbers of blue galaxies in galaxy clusters compared to the present day. These results have been confirmed by more recent studies (e.g., Rakos & Schombert 1995; Margoniner et al. 2001), although the effect of the magnitude limit and cluster selection play at least as important a role as the redshift (Fairley et al. 2002).
There are two issues that complicate the comparison of the galaxies in cluster cores, however. Firstly, we must be careful how we select galaxies that are to be compared. Most of the blue galaxies lie close to the photometric completeness limit. These galaxies will fade by up to 1 mag if star formation is turned off, and thus they are not directly comparable to the red-galaxy population selected at the same magnitude limit (Smail et al. 1998; Kodama & Bower 2001). Secondly, we are observing galaxy clusters in projection. There is little doubt that the field galaxy population at intermediate redshift is much bluer than in the local Universe (Lilly et al. 1995; Madau, Pozzetti, & Dickinson 1998); thus, although a small level of contamination by field galaxies has little influence on the overall color distribution, the same contamination will have a much bigger impact on the distribution at intermediate redshift. This problem is only partially eliminated if a complete sample of galaxy redshifts is available since the velocity dispersion of the cluster makes it impossible to distinguish cluster members from “near-field” galaxies that are close enough to the cluster to be indistinguishable in redshift space (Allington-Smith et al. 1993; Balogh et al. 1999; Ellingson et al. 2001). This idea is reinforced by experiments with numerical simulations. Galaxies can be associated with dark matter particles, and then “observed” to measure the extent to which radial information is lost. Diaferio et al. (2001) found that a contamination of 10% can easily occur; furthermore, since most of the contaminating galaxies are blue (and in these models most genuine cluster galaxies are red), the fraction of blue galaxies can then be boosted by 50%. Despite this, Ellingson et al. (2001) conclude that the rate at which clusters are being built up must also be higher in the past in order for this explanation to work. Kauffmann (1995) shows that there is good theoretical justification for this.
It will be interesting to see if the evolution in the colors of the cluster population are consistent with the evolution in the emission-line strengths. We might expect to see a difference because of the different time scales probed by colors and by emission lines. For example, if galaxies that fall into the cluster have their star formation quickly suppressed, they will remain blue (in the Butcher-Oemler sense) for a significant period after the line emission subsides (Ellingson et al. 2001). Combining these factors, it seems quite possible to accommodate both weak evolution in emission-line strength and more rapid evolution in the colors of cluster galaxies.
3 The Other Axis: Density
1 The Cluster Outskirts
So far we have been discussing the properties of galaxies within the cores of clusters, but the dependence on density (or, nearly equivalently, cluster-centric radius) provides another axis over which to study galaxy properties. We have seen that star formation is strongly suppressed in the cores of rich clusters — but at what radius do the galaxies become more like the field? We should also realize that it might be better to compare galaxy properties with their local densities (Dressler 1980; Kodama et al. 2001), as the large-scale structure surrounding clusters may have the dominant impact on galaxy evolution.


One of the first steps at studying galaxies in the transition zone around clusters were made with the CNOC2 survey (Balogh et al. 1999). They showed that there was a strong radial dependence in the star formation rate, but that the star formation rate had not yet reached the field value even at . The Sloan Digital Sky Survey (SDSS) and 2dF galaxy redshift survey surveys have allowed us to make a huge leap forward in this respect. In the local Universe, we are able to map galaxy star formation rates, using the complete redshift information to eliminate contamination by interlopers. In this section we will concentrate on what we have learned from the 2dF survey (Lewis et al. 2002), but the results from the SDSS give very consistent answers (Gómez et al. 2003). Figure 1 shows the median star formation rate as a function of local density. What is remarkable in this plot is that there is quite a sharp transition between galaxies with field-like star formation rates at and galaxies with low star formation rates comparable to cluster cores (). The switch is complete over a range of less than 7 in density.
The density at which the transition occurs corresponds to the density at the virial radius. If star formation is plotted against radius, the transition is considerably smeared out, but does occur at around the cluster virial radius — well outside the core region on which a lot of previous work has been focused. The 2dF galaxy redshift survey sample is sufficiently large that we can remove the cluster completely from this diagram. By only plotting galaxies more than 2 virial radii from the cluster centers, we concentrate on the filaments of infalling material. The correlation with local density is shown in Figure 1. Amazingly, the relation hardly changes compared to the complete cluster diagram.
This is a great success: we have identified the region where galaxy transformation occurs! It is in the infalling filaments (consisting of chains of groups) where galaxies seem to change from star-forming, field-like galaxies to passive, cluster-like objects. Of course, it is tempting to associate the transformation in star formation rate with a transformation from late- to early-type morphology. Unfortunately, this test cannot be undertaken with the available 2dF data, but we can expect clearer results from SDSS.
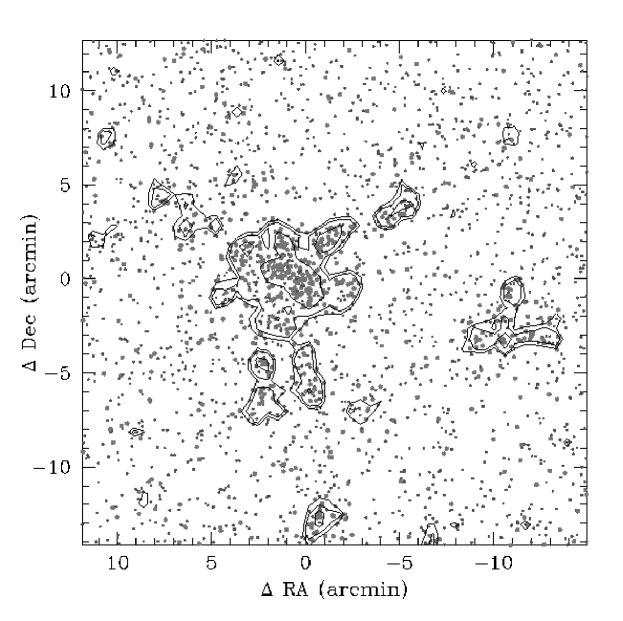
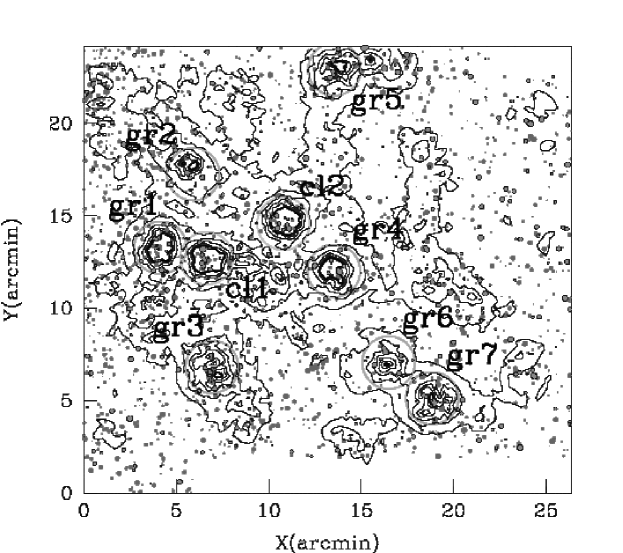
What happens at higher redshift? In fact, the first claim of a sharp transition in galaxy properties was made by Kodama et al. (2001) for the distant cluster A851 at (top panel in Fig. 2). Kodama et al. (2001) used photometric redshifts to eliminate foreground objects, and thus to reduce contamination of the cluster members to a level that allowed the color distribution to be studied in the outer parts of the cluster. Their results show an amazing transition in color. Direct comparison with the local clusters is difficult, however, as the magnitude limits are very different (Kodama et al.’s photometric data reach much fainter than the local spectroscopic samples), but Gómez et al. (2003) concluded that the threshold seen by Kodama et al. (2001) was at a significantly higher local density. Perhaps dwarf galaxies are more robust to this environmental transformation; we are not going to attempt to cover this issue.
A number of researchers are now engaged in spectroscopic programs to study the transformation threshold in higher-redshift systems. The results of Treu et al. (2003) are perhaps the most advanced. They also have the advantage of panoramic WFPC2 imaging that will allow them to compare the transformation of galaxy morphology (see Treu 2003).
The highest redshifts that can be studied require a combination of photometric preselection of objects for spectroscopy. Nakata et al. (2003) have used the photometric technique to map the large-scale structure around the Lynx cluster at (lower panel in Fig. 2), and similar techniques are described by Demarco et al. (2003). These groups identify several candidate filaments; spectroscopy of these regions is now underway.
2 Galaxy Groups
Returning to the local Universe, it is interesting to see if we can probe the properties of galaxies in groups directly. A lot of work has been carried out looking at small samples of groups selected from the CfA redshift survey (Geller & Huchra 1983; Moore, Frenk, & White 1993), from the Hickson compact group catalog (Hickson, Kindl, & Auman 1989), and also from X-ray surveys (Henry et al. 1995; Mulchaey et al. 2003).
In the era of the 2dF and SDSS redshift surveys, we can construct robust catalogs containing thousands of groups (Eke et al. 2003). It is interesting to compare the star formation rate in the groups as a function of local density, with the relation found in clusters. The relation
for the 2dF survey is shown in Figure 3 (Balogh et al. 2003). The panels show the effect of selecting systems on the basis of their velocity dispersion. There is actually very little difference between the trends. The galaxies in dense regions suffer the same suppression of their star formation rate, regardless of the system’s total mass. It is also possible to show that the groups in the infall regions of clusters show the same pattern as isolated groups. We have to conclude that the suppression of star formation is very much a local process. This is an important clue to distinguish between the different transformation mechanisms.


Interestingly, in the local Universe, there is little evidence for the environment producing a rise in the star formation rate above the field value. The only exception to this appears to be the close, low-velocity encounters of isolated galaxies (Barton, Geller, & Kenyon 2000; Lambas et al. 2003). Figure 4 shows the star formation rate as a function of separation for systems of different total velocity dispersion. A spike in the median star formation rate appears only in the smallest bin of the first panel. It will be interesting to study this trend within groups and clusters (Balogh et al. 2003).

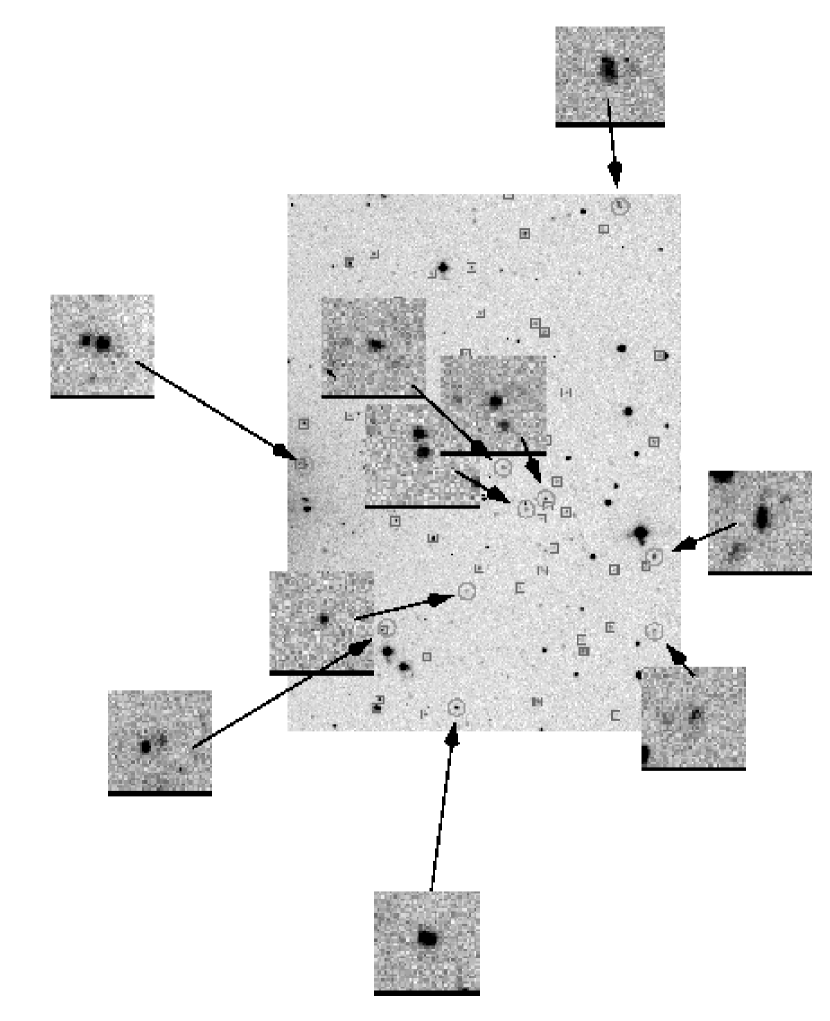
One of the next goals is to extend studies of groups to higher redshifts. The first steps in this direction were made by Allington-Smith et al. (1993). They used radio galaxies to pick out galaxy groups at redshifts up to 0.5. By stacking photometric catalogs, they showed that the galaxy populations of rich groups ()111Group richness defined as the number of galaxies with mag within a 0.5 Mpc radius of the radio galaxy ( = 50 km s-1 Mpc-1 and = 0 assumed). became increasingly blue with redshift, while poorer groups contained similar populations of blue galaxies at all redshifts. A survey of redshift-space selected groups at intermediate redshift became possible with the CNOC2 redshift survey. Carlberg et al. (2001) report a statistical sample of 160 groups out to redshift 0.4. On the Magellan telescopes, we have been following up the systems at in order to determine the complete membership and measure total star formation rates. Figure 5 shows the membership of a sample group. The initial results are exciting — star formation in many galaxies are more comparable to the surrounding field values. If these results are confirmed as we derive more redshifts and improve the group completeness, it represents a very interesting change from the properties seen in the 2dF groups. At higher redshifts, a tantalizing glimpse of the properties of a few groups can be obtained from the Caltech redshift survey (Cohen et al. 2000).
4 What Does It All Mean?
1 The Mechanisms Driving Galaxy Evolution
The mechanisms that have been proposed to drive galaxy evolution in dense environments can be broadly separated into three categories.
-
•
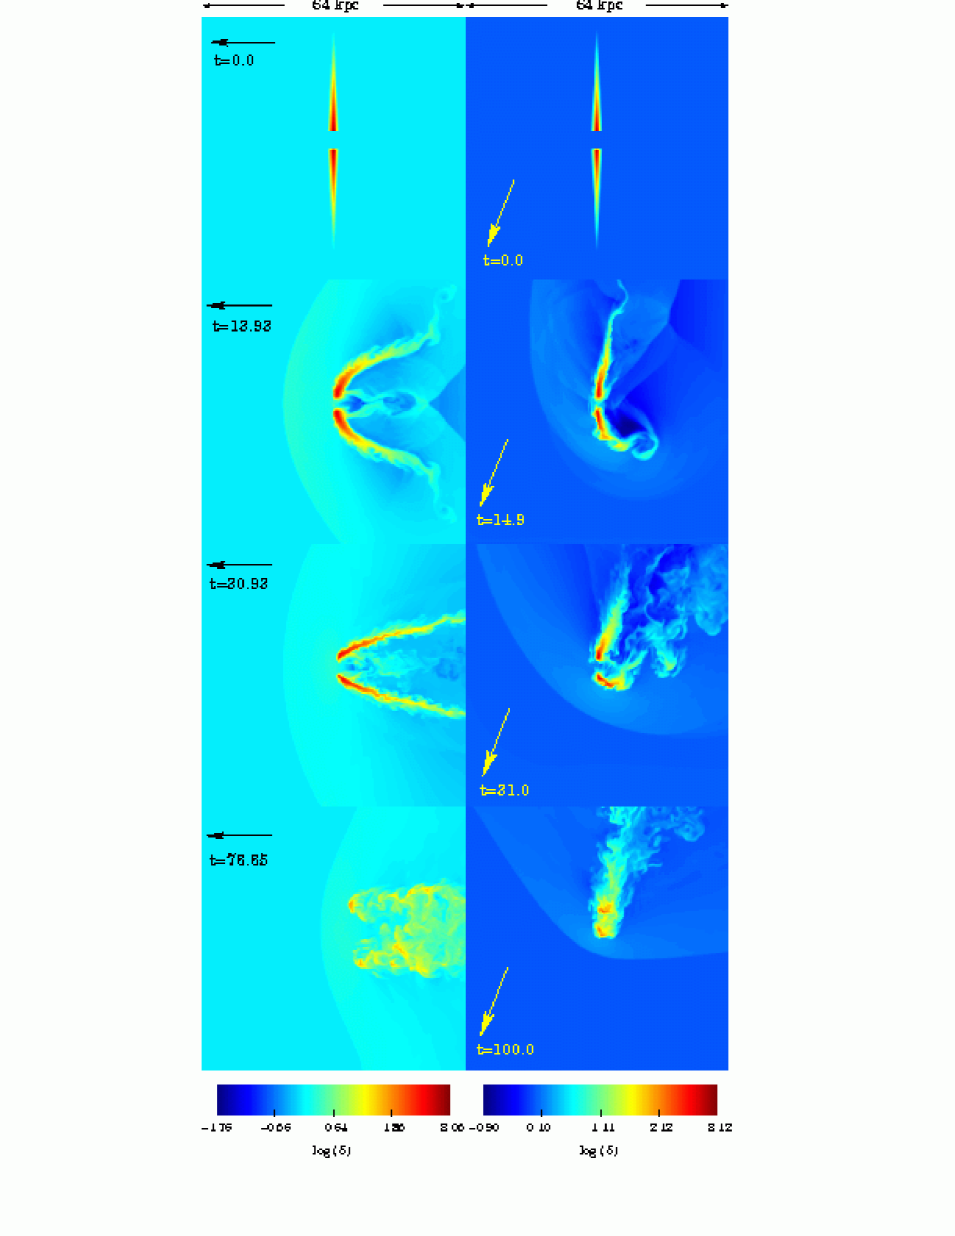
Ram pressure stripping. Galaxies traveling through a dense intracluster medium suffer a strong ram pressure effect that sweeps cold gas out of the stellar disk (Gunn & Gott 1972; Abadi, Moore, & Bower 1999; Quilis, Moore, & Bower 2000). The issue with this mechanism is whether it can be effective outside dense, rich cluster cores where the galaxy velocities are very high and the intracluster medium is very dense. Quilis et al. (2000) found that incorporating holes in the galaxy H i distribution made galaxies easier to strip (Fig. 6), but it still required clusters more massive than the Virgo cluster to have a great effect.
-
•
Collisions and harassment. Collisions or close encounters between galaxies can have a strong effect on their star formation rates. The tidal forces generated tend to funnel gas toward the galaxy center (Barnes & Hernquist 1991; Barnes 2002; Mihos 2003). It is likely that this will fuel a starburst, ejecting a large fraction of the material (Martin 1999). Gas in the outer parts of the disk, on the other hand, will be drawn out of the galaxy by the encounter. Although individual collisions are expected to be most effective in groups because the velocity of the encounter is similar to the orbital time scale within the galaxy, Moore et al. (1996) showed that the cumulative effect of many weak encounters can also be important in clusters of galaxies.
-
•
Strangulation. Current theories of galaxy formation suggest that isolated galaxies continuously draw a supply of fresh gas from a hot, diffuse reservoir in their halo (Larson, Tinsley, & Caldwell 1980; Cole et al. 2000). Although the reservoir is too cool and diffuse to be easily detected (Benson et al. 2000; Fang, Sembach, & Canizares 2003), this idea is supported by the observation that 90% of the baryonic content of clusters is in the from of a hot, diffuse intracluster medium. The baryon reservoir in galaxy halos is entirely analogous. When an isolated galaxy becomes part of a group, it may loose its preferential location at the center of the halo and thus be unable to draw further on the baryon reservoir. Without a mechanism for resupplying the material that is consumed in star formation and feedback, the galaxies’ star formation rate will decline. The exact rate depends on the star formation law that is used (Schmidt 1959; Kennicutt 1989) and on whether feedback is strong enough to drive an outflow from the disk.
Semi-analytic models (e.g., Cole et al. 2000) generally incorporate only the third of these mechanisms. The observational data strongly suggest that the ram pressure stripping scenario cannot be important for the majority of galaxies. As we have seen, the suppression of star formation seems to occur well outside of the clusters and is equally effective in low-velocity groups, which do not possess a sufficiently dense intracluster medium. Distinguishing between the remaining two scenarios is rather harder, since they have similar dependence on environment. Indeed, they may both play a role. The key difference is the time scale on which they operate: collisions are expected to produce changes in galaxy properties on short time scales (), while the changes due to strangulation are much more gradual (). The time scale for harassment is less well defined; while the individual encounters may induce short-lived bursts of star formation, the overall effect may accumulate over several Gyr. The radial gradients that we observe appear to prefer long time scales and, hence, a mechanism like strangulation or harassment (Balogh, Navarro, & Morris 2000). To make further progress in this area, we need to compile detailed observations of galaxies that are caught in the transition phase. In particular, morphological measurements will provide another important distinction (e.g., McIntosh et al. 2003).


2 The Star Formation History of the Universe
In addition to its own intrinsic interest, one reason for studying the impact of the environment on galaxy evolution is to understand the down-turn in the cosmic star formation rate. Studies of the global star formation rate show a decline of a factor 3–10 since the peak of star formation at –2 (Lilly et al. 1995; Madau et al. 1998; Glazebrook et al. 1999; Wilson et al. 2002). We can simplify the possible explanations into two alternative hypotheses: (1) the down-turn is caused by galaxies running out of a supply of material for star formation, or (2) it is driven by the growth of the mass structure of the Universe. In the first scenario, the down-turn is intrinsic to the galaxy population; in the second, it is caused by the changing environments of galaxies. Of course, the truth probably lies somewhere in between. In popular “semi-analytic” models (for example, Kauffmann et al. 1999; Somerville & Primack 1999; Cole et al. 2000), the decline occurs because galaxies that are not at the centers of their halo potential cannot accrete fresh gas, because this supply is being switched off by the growth of the halo mass.
It is useful to consider a toy model to investigate whether the growth of structure in scenario (2) is sufficiently rapid to be viable. Defining groups and clusters by their mass (as discussed in the Introduction), we can plot the fraction of the mass in “groups” and “clusters” as a function of redshift. Figure 7 shows that this fraction is always small, but that the fraction of mass in groups changes by a factor of 3–5 since the peak of cosmic star formation history. Of course, this model is highly simplified, so one should only treat it as an illustration of the idea.
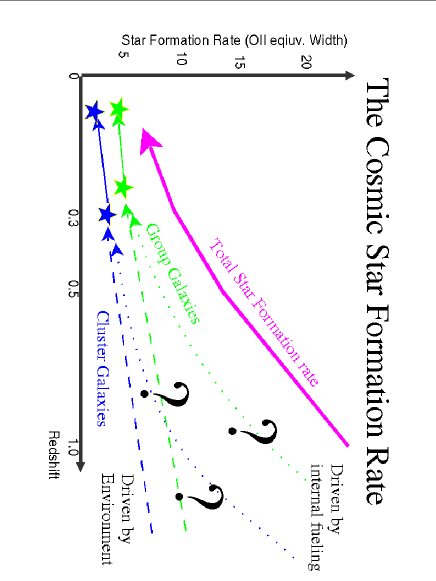
By observing groups and clusters of galaxies at different redshifts, we can hope to combine the data from different environments to make an “environmental Madau plot” where we break the contribution to the star formation rate down into its contributions from different environments. This is a task that is becoming more easily within our grasp. Some suggestions for how the plot might look are shown in Figure 8. An extension to the concept is to treat galaxy formation as an inverse problem. We have good models for how the dark matter halos of galaxies evolve and combine, so we can connect together galaxies in groups at with galaxies in clusters at . By combining our observations of galaxies in different environments at different redshifts with these numerical models, we can solve for the star formation histories of galaxies along this trajectory.
3 A Closing Thought
Throughout this review we have taken it for granted that the reason why galaxies in clusters end up looking different from galaxies in the field is causally related to their present environment — that there is a definite moment of transformation when field galaxies are transformed into passive cluster/group-like objects. But it is worth pausing to consider whether this is necessarily true. We wonder if it is still possible to believe that the cluster galaxies initially form differently (e.g., in a much more rapid collapse) and then just happen to end up in clusters (i.e., the “nature” scenario). In this case there is no causal connection. For example, if we ask the question “where are the Lyman-break galaxies now?”, numerical simulations have shown that these galaxies are now preferentially located in cluster cores (Governato et al. 1998). This would seem to support the “nature” conjecture. However, we do not believe that the converse is necessarily true. For example, if one selects all the galaxies in a present-day cluster and ask in what environment (halo mass) they were located at , one will find that there is a huge spread in the distribution of environments, and that it is not straightforward to distinguish this histogram from the corresponding histogram for galaxies identified in the present-day field. Given that the correspondence between the present-day environment and its environment at is relatively weak, we find it difficult to see how galaxies can “predict” their present-day environment at the time they are being formed. Clearly, this argument needs to be placed on a stronger footing by combining simulations and semi-analytic techniques to accurately define the environment of galaxies at each epoch (Diaferio et al. 2001; Springel et al. 2001; Helly et al. 2003).
Acknowledgments. RGB thanks the Leverhulme Foundation for its support, and MLB thanks PPARC for its support. This work made extensive use of the NASA’s Astrophysics Data System online bibliographic database, and the ArXiv/Astro-ph electronic preprint server.
References
- [1] Abadi, M. G., Moore, B., & Bower, R. G. 1999, MNRAS, 308, 947
- [2] Allington-Smith, J. A., Ellis, R. S., Zirbel, E. L., & Oemler, A. 1993, ApJ, 404, 52
- [3] Balogh, M. L., et al. 2003, in preparation
- [4] Balogh, M. L., Bower, R. G., Smail, I., Ziegler, B. L., Davies, R. L., Gaztelu, A., & Fritz, A. 2002, MNRAS, 337, 256
- [5] Balogh, M. L., Morris, S. L., Yee, H. K. C., Carlberg, R. G., & Ellingson, E. 1999, ApJ, 527, 54
- [6] Balogh, M. L., Navarro, J. F., & Morris, S. L. 2000, ApJ, 540, 113
- [7] Barger, A. J., et al. 1998, ApJ, 501, 522
- [8] Barger, A. J., Aragón-Salamanca, A., Ellis, R. S., Couch, W. J., Smail, I., & Sharples, R. M. 1996, MNRAS, 279, 1
- [9] Barnes, J. E. 2002, MNRAS, 333, 481
- [10] Barnes, J. E., & Hernquist, L. E. 1991, ApJ, 370, L65
- [11] Barrientos, L., Manterola, M. C., Gladders, M. D., Yee, H. K. C., Infante, L., Hall, P., & Ellingson, E. 2003, in Carnegie Observatories Astrophysics Series, Vol. 3: Clusters of Galaxies: Probes of Cosmological Structure and Galaxy Evolution, ed. J. S. Mulchaey, A. Dressler, & A. Oemler (Pasadena: Carnegie Observatories, http://www.ociw.edu/ociw/symposia/series/symposium3/proceedings.html)
- [12] Barton, E. J., Geller, M. J., & Kenyon, S. J., 2000, ApJ, 530, 660
- [13] Benson, A. J., Bower, R. G., Frenk, C. S., & White, S. D. M. 2000, MNRAS, 314, 557
- [14] Bond, J. R., Kaiser, N., Efstathiou, G., & Cole, S. 1991, ApJ, 379, 440
- [15] Bower, R. G. 1991, MNRAS, 248, 332
- [16] Bower, R. G., Kodama, T., & Terlevich, A. 1998, MNRAS, 299, 1193
- [17] Bower, R. G., Lucey, J. R., & Ellis, R. S. 1992, MNRAS, 254, 601
- [18] Butcher, H., & Oemler, A., Jr. 1978, ApJ, 219, 18
- [19] ——. 1984, ApJ, 285, 426
- [20] Carlberg, R. G., Yee, H. K. C., Morris, S. L., Lin, H., Hall, P. B., Patton, D. R., Sawicki, M., & Shepherd, C. W. 2001, ApJ, 563, 736
- [21] Cohen, J. G., Hogg, D. W., Blandford, R. D., Cowie, L. L., Hu, E., Songalia, A., Shopbell, P., & Richberg, K. 2000, ApJ, 538, 29
- [22] Cole, S., Lacey, C. G., Baugh, C. M., & Frenk, C. S. 2000, MNRAS, 319, 168
- [23] Couch, W. J., Balogh, M. L., Bower, R. G., Smail, I., Glazebrook, K., & Taylor, M. 2001, ApJ, 549, 820
- [24] Couch, W. J., & Newell, E. B. 1984, ApJS, 56, 143
- [25] Couch, W. J., & Sharples, R. M. 1987, MNRAS, 229, 423
- [26] Demarco, R., Rosati, P., Lidman, C., Nonino, M., Mainieri, V., Stanford, A., Holden, B., & Eisenhardt, P. 2003, in Carnegie Observatories Astrophysics Series, Vol. 3: Clusters of Galaxies: Probes of Cosmological Structure and Galaxy Evolution, ed. J. S. Mulchaey, A. Dressler, & A. Oemler (Pasadena: Carnegie Observatories, http://www.ociw.edu/ociw/symposia/series/symposium3/proceedings.html)
- [27] De Propris, R., Stanford, S. A., Eisenhardt, P. R., Dickinson, M., & Elston, R. 1999, ApJ, 118, 719
- [28] Diaferio, A., Kauffmann, G., Balogh, M. L., White, S. D. M., Schade, D., & Ellingson, E. 2001, MNRAS, 323, 999
- [29] Dressler, A. 1980, ApJS, 42, 565
- [30] Dressler, A., et al. 1997, ApJ, 490, 577
- [31] Dressler, A., & Gunn, J. E. 1992, ApJS, 78, 1
- [32] Drinkwater, M. J., Gregg, M. D., Holman, B. A., & Brown, M. J. I. 2001, MNRAS, 326, 1076
- [33] Duc, P.-A., et al. 2002, å, 382, 60
- [34] Eke, V., et al. 2003, in preparation
- [35] Ellingson, E., Lin, H., Yee, H. K. C., & Carlberg, R. G., 2001, ApJ, 547, 609
- [36] Ellis, R. S., Smail, I., Dressler, A., Couch, W. J., Oemler, A., Jr., Butcher, H., & Sharples, R. M. 1997, ApJ, 483, 582
- [37] Fairley, B. W., Jones, L. R., Wake, D. A., Collins, C. A., Burke, D. J., Nichol, R. C., & Romer, A. K. 2002, MNRAS, 330, 755
- [38] Fang, T., Sembach, K. R., & Canizares, C. R. 2003, ApJ, 586, L49
- [39] Faber, S. M., Trager, S. C., González, J. J., & Worthey, G. 1999, Ap&SS, 267, 273
- [40] Ferreras, I., Charlot, S. & Silk, J. 1999, ApJ, 521, 81
- [41] Finn, R. A., & Zaritsky, D. 2003, in Carnegie Observatories Astrophysics Series, Vol. 3: Clusters of Galaxies: Probes of Cosmological Structure and Galaxy Evolution, ed. J. S. Mulchaey, A. Dressler, & A. Oemler (Pasadena: Carnegie Observatories, http://www.ociw.edu/ociw/symposia/series/symposium3/proceedings.html)
- [42] Fritz, A., Ziegler, B. L., Bower, R. G., Smail, I., & Davies, R. L. 2003, in Carnegie Observatories Astrophysics Series, Vol. 3: Clusters of Galaxies: Probes of Cosmological Structure and Galaxy Evolution, ed. J. S. Mulchaey, A. Dressler, & A. Oemler (Pasadena: Carnegie Observatories, http://www.ociw.edu/ociw/symposia/series/symposium3/proceedings.html)
- [43] Geller, M. J., & Huchra, J. P. 1983, ApJS, 52, 61
- [44] Gladders, M. D., Lopez-Cruz, O., Yee, H. K. C., & Kodama, T. 1998, ApJ, 501, 571
- [45] Glazebrook, K., Blake, C., Economou, F., Lilly, S., & Colless, M. 1999, MNRAS, 306, 843
- [46] Gómez, P. L., et al. 2003, ApJ, 584, 210
- [47] Goto, T., et al. 2003, PASJ, 55, 771
- [48] Governato, F., Baugh, C. M., Frenk, C. S., Cole, S., Lacey, C. G., Quinn, T., & Stadel, J. 1998, Nature, 392, 359
- [49] Gunn, J. E., & Gott, J. R. 1972, ApJ, 176, 1
- [50] Guzik, J., & Seljak, U. 2002, MNRAS, 335, 311
- [51] Gúzman, R., Lucey, J. R., Carter, D., & Terlevich, R. J. 1992, MNRAS, 257, 187
- [52] Helly, J. C., Cole, S., Frenk, C. S., Baugh, C. M., Benson, A., & Lacey, C. 2003, MNRAS, 338, 903
- [53] Henry, J. P., et al. 1995, ApJ, 449, 422
- [54] Hickson, P., Kindl, E., & Auman, J. R. 1989, ApJS, 70, 687
- [55] Hubble E., & Humason, M. L. 1931, ApJ, 74, 43
- [56] Jenkins, A., Frenk, C. S., White, S. D. M., Colberg, J. M., Cole, S., Evrard, A. E., Couchman, H. M. P., & Yoshida, N. 2001, MNRAS, 321, 372
- [57] Jørgensen, I. 1999, MNRAS, 306, 607
- [58] Jørgensen, I., Franx, M., Hjorth, J., & van Dokkum, P. G. 1999, MNRAS, 308, 833
- [59] Kauffmann, G. 1995, MNRAS, 274, 153
- [60] Kauffmann, G., Colberg, J. M., Diaferio, A., & White, S. D. M. 1999, MNRAS, 303, 188
- [61] Kelson, D. D., Illingworth, G. D., Franx, M., & van Dokkum, P. G. 2001, ApJ, 552, L17
- [62] Kennicutt, R. C. 1989, ApJ, 344, 685
- [63] ——. 1992, ApJ, 388, 310
- [64] Kodama, T., & Bower, R. G. 2001, MNRAS, 321, 18
- [65] Kodama, T., Smail, I., Nakata, F., Okamura, S., & Bower, R. G. 2001, ApJ, 562, 9
- [66] Lacey, C., & Cole, S. 1993, MNRAS, 262, 627
- [67] Lambas, D. G., Tissera, P. B., Sol Alonso, M., & Coldwell, G. 2003, MNRAS, submitted (astro-ph/0212222)
- [68] Larson, R. B., Tinsley, B. M., & Caldwell, C. N. 1980, ApJ, 237, 692
- [69] Lewis, I. J., et al. 2002, MNRAS, 334, 673
- [70] Lilly, S. J., Tresse, L., Hammer, F., Crampton, D., & Le Févre, O. 1995, ApJ, 455, 108
- [71] Madau, P., Pozzetti, L., & Dickinson, M. 1998, ApJ, 498, 106
- [72] Margoniner, V. E., de Carvalho, R. R., Gal, R. R., & Djorgovski, S. G. 2001, ApJ, 548, L143
- [73] Martin, C. L. 1999, ApJ, 513, 156
- [74] McIntosh, D. H., Rix, H.-W., & Caldwell, N. 2003, ApJ, submitted (astro-ph/0212427)
- [75] Metavier, A. J. 2003, in Carnegie Observatories Astrophysics Series, Vol. 3: Clusters of Galaxies: Probes of Cosmological Structure and Galaxy Evolution, ed. J. S. Mulchaey, A. Dressler, & A. Oemler (Pasadena: Carnegie Observatories, http://www.ociw.edu/ociw/symposia/series/symposium3/proceedings.html)
- [76] Mihos, J. C. 2003, in Carnegie Observatories Astrophysics Series, Vol. 3: Clusters of Galaxies: Probes of Cosmological Structure and Galaxy Evolution, ed. J. S. Mulchaey, A. Dressler, & A. Oemler (Cambridge: Cambridge Univ. Press), in press
- [77] Miller, N. A. 2003, in Carnegie Observatories Astrophysics Series, Vol. 3: Clusters of Galaxies: Probes of Cosmological Structure and Galaxy Evolution, ed. J. S. Mulchaey, A. Dressler, & A. Oemler (Pasadena: Carnegie Observatories, http://www.ociw.edu/ociw/symposia/series/symposium3/proceedings.html)
- [78] Miller, N. A., & Owen, F. N. 2002, AJ, 124, 2453
- [79] Milvang-Jensen, B., Aragón-Salamanca, A., Hau, G., Jørgensen, I., & Hjorth, J. 2003, MNRAS, 339, 1
- [80] Mo, H. J., & White, S. D. M. 2002, MNRAS, 336, 112
- [81] Moore, B., Frenk, C. S., & White, S. D. M. 1993, MNRAS, 261, 827
- [82] Moore, B., Katz, N., Lake, G., Dressler, A., & Oemler, A. 1996, Nature, 379, 613
- [83] Morrison, G. E., & Owen, F. N. 2003, AJ, 125, 506
- [84] Mulchaey, J. S., Davis, D. S., Mushotzky, R. F., & Burstein, D. 2003, ApJS, 145, 39
- [85] Nakata, F., et al. 2003, in preparation
- [86] Oemler, A., Jr. 1974, ApJ, 194, 10
- [87] Poggianti, B. M. 2003, in Carnegie Observatories Astrophysics Series, Vol. 3: Clusters of Galaxies: Probes of Cosmological Structure and Galaxy Evolution, ed. J. S. Mulchaey, A. Dressler, & A. Oemler (Cambridge: Cambridge Univ. Press), in press
- [88] Poggianti, B. M., et al. 2001, ApJ, 563, 118
- [89] Poggianti, B. M., Smail, I., Dressler, A., Couch, W. J., Barger, A. J., Butcher, H., Ellis, R. S., & Oemler, A., Jr. 1999, ApJ, 518, 576
- [90] Poggianti, B. M., & Wu, H. 2000, ApJ, 529, 157
- [91] Press, W. H., & Schechter, P. 1974, ApJ, 187, 425
- [92] Quilis, V., Moore, B., & Bower, R. G. 2000, Science, 288, 1617
- [93] Quintero, A. D., et al. 2003, ApJ, submitted (astro-ph/0307074)
- [94] Rakos, K. D., & Schombert, J. M. 1995, ApJ, 439, 47
- [95] Rudnick, G. H., De Lucia, G., White, S. D. M., & Pelló, R. 2003, in Carnegie Observatories Astrophysics Series, Vol. 3: Clusters of Galaxies: Probes of Cosmological Structure and Galaxy Evolution, ed. J. S. Mulchaey, A. Dressler, & A. Oemler (Pasadena: Carnegie Observatories, http://www.ociw.edu/ociw/symposia/series/symposium3/proceedings.html)
- [96] Sakamoto, T., Chiba, M., & Beers, T. C. 2003, å, 397, 899
- [97] Sandage A., 1961, in The Hubble Atlas of Galaxies (Washington, DC: Carnegie Int. of Washington)
- [98] Sandage A., & Visvanathan, N. 1978, ApJ, 223, 707
- [99] Schmidt, M. 1959, ApJ, 129, 243
- [100] Sheth, R. K., Mo, H. J., & Tormen, G. 2001, MNRAS, 323, 1
- [101] Smail, I., Edge, A. C., Ellis, R. S., & Blandford, R. D. 1998, MNRAS, 293, 124
- [102] Smail, I., Morrison, G., Gray, M. E., Owen, F. N., Ivison, R. J., Kneib, J. P., & Ellis, R. S. 1999, ApJ, 525, 609
- [103] Somerville, R. S., & Primack, J. R. 1999, MNRAS, 310, 1087
- [104] Springel, V., White, S. D. M., Tormen, G., & Kauffmann, G. 2001, MNRAS, 328, 726
- [105] Tran, K., Franx, M., Illingworth, G., & van Dokkum, P. 2003, in Carnegie Observatories Astrophysics Series, Vol. 3: Clusters of Galaxies: Probes of Cosmological Structure and Galaxy Evolution, ed. J. S. Mulchaey, A. Dressler, & A. Oemler (Pasadena: Carnegie Observatories, http://www.ociw.edu/ociw/symposia/series/symposium3/proceedings.html)
- [106] Treu, T. 2003, in Carnegie Observatories Astrophysics Series, Vol. 3: Clusters of Galaxies: Probes of Cosmological Structure and Galaxy Evolution, ed. J. S. Mulchaey, A. Dressler, & A. Oemler (Cambridge: Cambridge Univ. Press), in press
- [107] Treu, T., Ellis, R. S., Kneib, J.-P., Dressler, A., Smail, I., Czoske, O., Oemler, A., & Natarajan P. 2003, ApJ, 591, 53
- [108] van Dokkum, P. G., & Franx, M. 2001, ApJ, 553, 90
- [109] van Dokkum, P. G., Franx, M., Fabricant, D., Illingworth, G. D., & Kelson, D. D. 2000, ApJ, 541, 95
- [110] van Dokkum, P. G., Franx, M., Kelson, D. D., Illingworth, G. D., Fischer, D., & Fabricant, D. 1998, ApJ, 500, 714
- [111] van Dokkum, P. G., & Stanford, S. A. 2003, ApJ, 585, 78
- [112] Wilson, G., Cowie, L. L., Barger, A. J., & Burke, D. J. 2002, AJ, 124, 1258
- [113] Zabludoff, A. I., Zaritsky, D., Lin, H., Tucker, D., Hashimoto, Y., Shectman, S. A., Oemler, A., & Kirshner, R. P. 1996, ApJ, 466, 104
- [114] Ziegler, B., Böhm, A., Jager, K., Fritz, A., & Heidt J. 2003, in Carnegie Observatories Astrophysics Series, Vol. 3: Clusters of Galaxies: Probes of Cosmological Structure and Galaxy Evolution, ed. J. S. Mulchaey, A. Dressler, & A. Oemler (Pasadena: Carnegie Observatories, http://www.ociw.edu/ociw/symposia/series/symposium3/proceedings.html)