VLT surface photometry and isophotal analysis of early-type dwarf galaxies in the Virgo cluster ††thanks: Based on observations collected at the European Southern Observatory (ESO 63.O-0055 and 65.N-0062)
We have carried out surface photometry and an isophotal analysis for a sample of 25 early-type dwarf (dE and dS0) galaxies in the Virgo cluster based on CCD images taken at the VLT with FORS1 and FORS2. For each galaxy we present and -band surface brightness profiles, as well as the radial colour () profile. We give total apparent magnitudes, effective radii, effective surface brightnesses and total colour indices. The light profiles have been fitted with Sérsic models and the corresponding parameters are compared to the ones for other classes of objects. In general, dEs and dS0s bridge the gap in parameter space between the giant ellipticals and the low-luminosity dwarf spheroidals in the Local Group, in accordance with previous findings. However, the observed profiles of the brightest cluster dwarfs show significant deviations from a simple Sérsic model, indicating that there is more inner structure than just a nucleus. This picture is reinforced by our isophotal analysis where complex radial dependencies of ellipticity, position angle, and isophotal shape parameter are exhibited not only by objects like IC3328, for which the presence of a disk component has been confirmed, but by many apparently normal dEs as well. In addition, we find a relation between the effective surface brightness, at a given luminosity, and the strength of the offset of the galaxy’s nucleus with respect to the center of the isophotes. Dwarfs with large nuclear offsets also tend to have stronger isophotal twists. However, such twists are preferentially found in apparently round () galaxies and are always accompanied by significant radial changes of the ellipticity, which clearly points to a projection effect. In sum, our findings suggest the presence of substructure in most, and preferentially in the less compact, bright early-type dwarfs. The physical (dynamical) meaning of this has yet to be explored.
Key Words.:
galaxies: fundamental parameters – galaxies: photometry – galaxies: structure galaxies: clusters: individual: Virgo – galaxies: dwarf – galaxies: elliptical and lenticular –1 Introduction
Dwarf elliptical galaxies (hereafter dEs, subsuming “dwarf spheroidals” and dwarf S0s) are by far the most numerous type of galaxy in the local universe (see Ferguson & Binggeli (1994) for a review). As they prefer the high density environment of galaxy clusters, the most suitable places for their study are the two nearest clusters in Virgo and Fornax, where catalogues of dEs have been established as part of extensive surveys (Binggeli et al. 1985, hereafter VCC; Ferguson 1989). The numerical dominance of dEs in these two galaxy aggregates is evident in the studies of the corresponding galaxy luminosity functions (Sandage et al. 1985, Ferguson & Sandage 1988). A host of photographic and CCD studies of Virgo and Fornax dwarfs in the eighties and early nineties led to our knowledge of the basic photometric properties of dwarf ellipticals (Caldwell 1983, Binggeli et al. 1984, Bothun et al. 1986, Caldwell & Bothun 1987, Binggeli & Cameron 1991, 1993). Little dE photometry has been added to this until recently. Ryden et al. (1999), still working with low-resolution CCD images, went a step further by analyzing the isophotal shapes of a large sample of dEs, finding many dwarfs to be “disky” and ”boxy” just as the giants. Miller et al. (1998) observed 24 Virgo dwarfs with the HST to derive the specific Globular Cluster Frequency () for dEs. Based on the same high-resolution HST images, Stiavelli et al. (2001) analyzed the innermost regions (cusp slopes) of these galaxies. However, it proved difficult to connect the central properties with the global dwarf structures; the drawback of HST here is clearly the small field of view.
On the other hand, enormous progress has recently been made at the kinematic “frontline”. After almost a decade of stagnation of kinematic measurements (see Ferguson & Binggeli 1994), several groups are now reporting their (partially conflicting) results on the (non-) rotational properties of early-type dwarfs. For instance, Geha et al. (2001) used Keck II to measure rotation profiles for six Virgo dwarfs. No evidence of significant rotation was found among the target objects. A similar programme is being run at the VLT (de Rijcke et al. 2002). The earlier conjecture that dwarf ellipticals in general are not rotation-supported is definitively confirmed by these studies (also Thomas et al. 2003). However, it has also become clear that among the brightest cluster early-type dwarfs, in particular the dS0s, there are many rotation-supported systems (Simien & Prugniel 2002).
There are also photometric hints about the existence of disk galaxies among the bright cluster early-type dwarfs. Jerjen, Kalnajs & Binggeli (2000, 2001) discovered weak spiral structures and a bar in two Virgo dEs and subsequently Barazza et al. (2002) found spiral and bar features in three additional objects. These findings are in fact based on the same VLT images for which surface photometry is presented in the present paper. Deep, high-resolution VLT imaging, providing a sufficiently large field of view, is certainly ideally suited for the study of the photometric properties of Virgo and Fornax dEs. With the present surface photometry and isophotal analysis of 25 early-type Virgo dwarfs based on high-quality and VLT images we aim at a more systematic exploration of the structural complexity of dwarf ellipticals. We especially address the question whether a Sérsic model is an appropriate representation of the empirical surface brightness profiles of dEs. The isophotal analysis is used to derive ellipticity, position angle and isophotal shape profiles. In addition, we map nuclear offsets and isophotal twists of the sample dEs. Overall, our findings show that these seemingly dull stellar systems are quite complex in structure. Dwarf elliptical galaxies are neither the scaled down version of giant ellipticals nor simply the final state of a star forming dwarf irregular galaxy that has converted all its gas into stars.
The plan of this paper is as follows. In Sect. 2 we introduce the dwarf galaxy sample and provide some global photometric parameters. The data reduction and photometric calibration are described in Sect. 3. Sect. 4 and 5 are dedicated to the surface photometry and the isophotal analysis. The discussion and summary is given in Sect. 6.
2 Sample and observations
The dE galaxies studied here were originally chosen from the Virgo Cluster Catalog (VCC; Binggeli et al. 1985) for the purpose of measuring their distances by means of the Surface Brightness Fluctuation method to explore the 3-dimensional structure of the Virgo cluster (Jerjen et al. 2003). As it is a main requirement for the successful application of this method, galaxies were primarily selected on their morphological appearance, i.e. type “dE” or “dS0”, and on their apparent size, i.e. an isophotal radius . Dwarf S0s are a frequent morphological variation of the dE class among bright dwarfs, being characterized by the presence of an S0-like two-component structure, of some bar-like feature, strongly twisting isophotes, or simply by high flattening. In their mean surface brightness profile, dS0s are indistinguishable from dEs (Sandage & Binggeli 1984, Binggeli & Cameron 1991).
Within these constraints, the sample was selected so as to get a good coverage in velocity space ( km s-1 1850 km s-1 ) and in the celestial distribution (; ). The core sample contained 16 bright early-type dwarfs which, however, could be increased by 9 more dwarfs, as these happened to lie in the field of view of the CCD. Among these are five rather faint dwarfs (VCC0850, VCC0962, VCC0998, VCC1093, VCC1129). The total sample considered here is comprised therefore of 25 objects, 22 of which were imaged in and filters (or , which is the corresponding filter used on FORS2; in the following we only use ) and three (IC3303, IC3518, UGC7854) in only.
| VCC | Name | Type | Notes | |||||||||
|---|---|---|---|---|---|---|---|---|---|---|---|---|
| (1) | (2) | (3) | (4) | (5) | (6) | (7) | (8) | (9) | (10) | (11) | (12) | |
| 0009 | IC3019 | dE1,N | 17.11 | 1804 | 14.04 | 30.81 | 23.48 | 12.66 | 34.48 | 22.35 | 1.38 | a |
| 0490 | IC0783 | dS0(3),N | 17.18 | 1293 | 13.97 | 27.31 | 23.15 | 12.63 | 28.35 | 21.89 | 1.34 | b |
| 0781 | IC3303 | dS0(5),N: | 254 | 13.56 | 10.30 | 20.62 | ||||||
| 0810 | dE0,N | 14.47 | 340 | 16.68 | 9.92 | 23.66 | 15.45 | 9.94 | 22.44 | 1.23 | ||
| 0815 | dE2, N | 15.20: | 700 | 15.95: | 13.54: | 23.61: | 14.90: | 12.93: | 22.46: | 1.05: | ||
| 0846 | dE1,N: | 14.96 | 730 | 16.19 | 12.35 | 23.65 | 14.73 | 15.35 | 22.66 | 1.46 | ||
| 0850 | dE,N | 12.63: | 18.52: | 8.81: | 25.24: | 17.46: | 8.27: | 24.05: | 1.06: | c | ||
| 0856 | IC3328 | dE1,N | 16.96 | 972 | 14.19 | 20.66 | 22.76 | 12.98 | 18.07 | 21.26 | 1.21 | d |
| 0928 | dE6,N | 15.02 | 254 | 16.13 | 9.11 | 22.93 | 14.98 | 8.60 | 21.65 | 1.15 | ||
| 0929 | NGC4415 | d:E1,N | 17.46 | 910 | 13.69 | 19.26 | 22.11 | 12.18 | 20.72 | 20.76 | 1.51 | |
| 0940 | IC3349 | dE1,N | 16.34 | 1563 | 14.81 | 19.42 | 23.25 | 13.56 | 18.35 | 21.88 | 1.25 | b |
| 0962 | dE3 | 14.18: | 16.97: | 22.00: | 25.68: | 15.93: | 17.90: | 24.19: | 1.04: | |||
| 0998 | dE4,N: | 13.21 | 17.94 | 11.37 | 25.22 | 16.75 | 11.11 | 23.98 | 1.19 | |||
| 1010 | NGC4431 | dS0(5),N | 17.29 | 913 | 13.86 | 17.23 | 22.04 | 12.47 | 17.05 | 20.63 | 1.39 | b |
| 1036 | NGC4436 | dE6/dS0(6),N | 17.26 | 1163 | 13.89 | 16.37 | 21.96 | 12.65 | 14.90 | 20.51 | 1.24 | |
| 1087 | IC3381 | dE3,N | 17.00 | 645 | 14.15 | 19.35 | 22.58 | 12.87 | 18.06 | 21.15 | 1.28 | |
| 1093 | dE0,N | 14.22 | 16.93 | 12.23 | 24.37 | 15.45 | 14.34 | 23.23 | 1.48 | |||
| 1104 | IC3388 | dE5,N | 15.66 | 1704 | 15.49 | 11.76 | 22.84 | 14.29 | 11.30 | 21.56 | 1.20 | e |
| 1129 | dE3 | 13.26 | 17.89 | 7.56 | 24.28 | 16.70 | 7.43 | 23.05 | 1.19 | |||
| 1254 | dE0,N | 15.76 | 1350 | 15.39 | 15.11 | 23.29 | 13.96 | 14.74 | 21.80 | 1.43 | f | |
| 1261 | NGC4482 | d:E5,N | 17.56 | 1850 | 13.59 | 19.18 | 22.00 | 12.38 | 18.91 | 20.76 | 1.21 | |
| 1355 | IC3442 | dE2,N | 16.63 | 1332 | 14.52 | 30.80 | 23.96 | 13.05 | 36.83 | 22.88 | 1.47 | |
| 1422 | IC3468 | E1,N: | 17.35 | 1372 | 13.80 | 20.34 | 22.34 | 12.64 | 18.95 | 21.03 | 1.16 | b |
| 1567 | IC3518 | dE5/dS0(5),N | 1440 | 13.25 | 26.12 | 22.33 | g | |||||
| 1895 | UGC7854 | d:E6 | 1032 | 13.80 | 11.51 | 21.11 |
Values followed by a colon have to be considered as uncertain due to disturbing
background or foreground objects.
a Whether this galaxy is really nucleated is not clear. The object
considered as nucleus is very faint and largely off-centered. It could
therefore also
be a bright globular cluster which in projection happens to lie close to the
center.
In the VCC the galaxy is classified as dE,N, whereas Miller et al. (1998) regard
it
as non-nucleated. Stiavelli et al. (2001) present a HST observation of this
galaxy and
provide the results of different profile fits as well as the determination of
the
nuclear cusp slope.
b disk features discovered (Jerjen et al. 2001, Barazza et al. 2002)
c The VCC type of this galaxy, which heavily overlaps with VCC0846, is ImIV?
We suggest a reclassification as dE,N. In support of this, the galaxy
has not been detected in the HI survey of Hoffman et al. (1989).
d spiral structure discovered (Jerjen et al. 2000)
e As part of the Hubble Space Telescope (HST) key project the luminosity of
the tip of the red-giant branch (TRGB) for this galaxy has been determined
(Harris et
al. 1998): . The corresponding distance is Mpc (using ).
f A velocity profile has recently been derived by Geha et al. (2001),
showing that this galaxy is not rotating.
g This galaxy could not be fully integrated, since its shape is strongly
non-elliptical. The values given are estimates, using from Binggeli
& Cameron (1993) and our .
The images were obtained using the first two units of the Very Large Telescope (VLT) at ESO Paranal Observatory in service mode over a period of two semesters: at UT1+FORS1 (Antu) during an observing run on July 10-14, 1999 and at UT2+FORS2 (Kueyen) during dark time periods in March-May 2000. The detectors of the FORS (FOcal Reducer/Low dispersion Spectrograph) instruments are thinned and anti-reflection-coated Tektronix (FORS1) and SiTE (FORS2) CCDs with pixels. By default, service observations were taken in standard resolution mode, with a high gain and a pixel scale of pixel-1 that yields a field of view of . The CCDs were read out in the four-port mode, i.e. four amplifiers read out one quarter of the CCD each. Three exposures of sec durations with slightly different pointings were secured in each filter for each galaxy. More details of the observations are to be reported elsewhere (Jerjen et al., in preparation). The basic properties of the sample galaxies are listed in Table 1. The columns are as follows:
columns (1) and (2): identifications of the galaxies; for the coordinates see VCC.
column (3): morphological type in the classification system of Sandage & Binggeli (1984), taken from the VCC;
column (4): absolute -band magnitude, based on the apparent magnitude given in column 6 and a mean Virgo cluster distance of 17 Mpc;
column (5): heliocentric radial velocity in km s-1 (from the VCC and Binggeli et al. 1993, except for VCC0928, where the value of Conselice et al. 2001 is given).
The following entries are from the photometry presented below (Sect. 4). We give their meaning here as well. It should be noted that all values in magnitudes are corrected for galactic extinction using the maps of Schlegel et al. (1998). Values with a colon are uncertain.
columns (6) and (9): total apparent magnitude in and , respectively;
columns (7) and (10): effective radius in arcsec in and , respectively;
columns (8) and (11): effective surface brightnesses in and , respectively;
columns (12): total (mean) colour index.
The mean absolute magnitude in for all dwarfs is . Taking only the 16 dwarfs originally selected into account (without the five faint objects mentioned above) we get , which is indeed rather bright for dwarf galaxies. The mean colour of the sample is . This is quite blue for early-type dwarfs, but there are three very blue outliers whose colour might be affected by other objects: parts of VCC0962 () are hidden by a bright foreground star, VCC0815 () probably has a bright background object near its nucleus, and VCC0850 () is partially overlapping with VCC0846. Excluding these three dwarfs we get .
3 Photometric procedures
The image reduction and data analysis were performed with ESO’s MIDAS package. Three exposures were available for each science field. Before combining them, the three frames were bias-subtracted and flat-fielded. Cosmic rays were removed by taking the median of the three pre-reduced exposures. As the twilight flats provided did not lead to satisfactory results, we were forced to improve the flatness for some of the frames. The problem became obvious when we tried to do the usual way of sky subtraction by fitting a tilted plane to sky regions on the frame outside the domain of the galaxies, and as unaffected as possible by foreground stars: strong intensity gradients remained in the background of many images, above all in the (or ) frames, obviously being due to improper flat-fielding in (or ). We believe the problem was caused by an undetected source of scattered light. Reliable dark sky (super) flats, which might have worked better, were unfortunately impossible to construct from the science frames. To find a solution to the problem nonetheless, i.e. to get rid of the strongest gradients, we decided to fit third-order polynomials to the backgrounds and then to subtract the residuals, as is appropriate in the case of scattered light. High-order polynomial fitting can of course be quite dangerous in cases where the galaxy covers a substantial part of the frame, leaving only little background for the fitting procedure. We therefore checked all polynomial fits for a possible contamination by the galaxy (correlation with the galaxy position) and reduced the sky regions used where necessary. Any remaining gradient in the background of a galaxy frame was then finally removed by fitting, and subtracting, a second sky model, this time a tilted plane (first-order polynomial) in all cases. The residual intensity of this second sky fit, averaged over the whole frame, can be taken as a rough measure of the systematic uncertainty in surface brightness due to this sky flattening problem. The corresponding value [] for the sample galaxies is given in Table 2, and band values in columns 3 and 4, respectively. This means that at the radius where the or surface brightness profile of a galaxy reaches the value listed, the uncertainty in surface brightness (not counting the usually much smaller random errors shown in Fig. 1) becomes 100%, or 0.75 mag.
Next the frames were cleaned of disturbing foreground stars or background galaxies. The regions around the galaxies were automatically cleaned with an algorithm designed for this purpose, whereas objects on the galaxy itself were erased by hand.
For the photometric zero-pointing we used standard stars from Landolt (1992). The fields with the standard stars had been imaged several times during the observing nights. We could therefore determine the zero point and extinction parameters for each night separately.
| VCC | Name | ||||
|---|---|---|---|---|---|
| (1) | (2) | (3) | (4) | (5) | (6) |
| 0009 | IC3019 | 28.09 | 27.65 | 120 | |
| 0490 | IC0783 | 28.52 | 26.66 | 100 | 100 |
| 0781 | IC3303 | 27.18 | |||
| 0810 | 30.12 | 26.58 | |||
| 0815 | 30.12 | 26.58 | 32 | 32 | |
| 0846 | 30.12 | 26.58 | |||
| 0850 | 30.12 | 26.58 | |||
| 0856 | IC3328 | 28.47 | 27.45 | 120 | 120 |
| 0928 | 27.77 | 26.62 | 24 | 24 | |
| 0929 | NGC4415 | 27.99 | 27.65 | 120 | |
| 0940 | IC3349 | 27.77 | 26.62 | 80 | 80 |
| 0962 | 27.77 | 26.62 | 64 | ||
| 0998 | 27.77 | 27.20 | |||
| 1010 | NGC4431 | 27.77 | 27.20 | 88 | 100 |
| 1036 | NGC4436 | 27.77 | 27.20 | 40 | 40 |
| 1087 | IC3381 | 28.14 | 27.93 | 60 | 60 |
| 1093 | 27.14 | 27.93 | 16 | 16 | |
| 1104 | IC3388 | 29.97 | 27.76 | ||
| 1129 | 29.97 | 27.76 | |||
| 1254 | 26.51 | 25.70 | 0 | 0 | |
| 1261 | NGC4482 | 28.89 | 27.45 | 120 | 120 |
| 1355 | IC3442 | 30.73 | 28.70 | 120 | 120 |
| 1422 | IC3468 | 28.85 | 27.86 | 100 | 100 |
| 1567 | IC3518 | 27.70 | 76 | ||
| 1895 | UGC7854 | 26.10 |
The center, as well as the ellipticity and position angle of the major axis for each galaxy were determined at the isophotal level of by means of the ellipse fitting routine FIT/ELL3. These parameters were then used to obtain a growth curve (integrated light profile) by integrating the galaxy light in elliptical apertures of fixed center, ellipticity and position angle of the major axis. Some bright galaxies in our sample could not be integrated completely in this way because they had not been placed at the center of the frame, but slightly off in order to have enough regions for the background fitting. In these cases we integrated the outer parts of the galaxy only in one quadrant (obviously the one opposite to the quadrant containing the center) and extrapolated the results to the whole galaxy. In Table 2, columns 5 and 6 we give the equivalent (maximum) radii for the and frames, respectively, up to which a full integration was possible. A -sign indicates that the whole galaxy is on the frame. In the case of VCC1254 only one quadrant was used for the whole galaxy, as it is located very close to the giant M49.
4 Surface photometry
4.1 Model-free photometric parameters and radial profiles
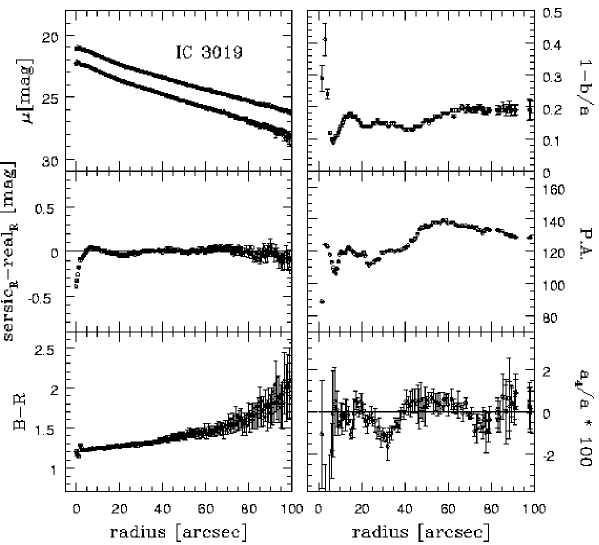
upper left: surface brightness profiles in (lower curve, where available) and (upper curve). Error bars are only shown for the profile in (or in , if is not available). A tick mark indicates the confidence limit of our photometry in (Table 2, column 3), if not present, it roughly corresponds to the right margin of the plot;
middle left: model profile (from a Sérsic fit) minus profile observed in ;
lower left: colour-profile;
upper right: ellipticity profile in ;
middle right: profile of the position angle of the major-axis in , from top counterclockwise;
lower right: the profile of the isophotal shape parameter in expressed as , where is the length of the major-axis of the corresponding isophote.
![[Uncaptioned image]](/html/astro-ph/0306339/assets/x2.png)
Fig. 1. continued
![[Uncaptioned image]](/html/astro-ph/0306339/assets/x3.png)
Fig. 1. continued
![[Uncaptioned image]](/html/astro-ph/0306339/assets/x4.png)
Fig. 1. continued
![[Uncaptioned image]](/html/astro-ph/0306339/assets/x5.png)
Fig. 1. continued
![[Uncaptioned image]](/html/astro-ph/0306339/assets/x6.png)
Fig. 1. continued
![[Uncaptioned image]](/html/astro-ph/0306339/assets/x7.png)
Fig. 1. continued
![[Uncaptioned image]](/html/astro-ph/0306339/assets/x8.png)
Fig. 1. continued
![[Uncaptioned image]](/html/astro-ph/0306339/assets/x9.png)
Fig. 1. continued
![[Uncaptioned image]](/html/astro-ph/0306339/assets/x10.png)
Fig. 1. continued
![[Uncaptioned image]](/html/astro-ph/0306339/assets/x11.png)
Fig. 1. continued
![[Uncaptioned image]](/html/astro-ph/0306339/assets/x12.png)
Fig. 1. continued
![[Uncaptioned image]](/html/astro-ph/0306339/assets/x13.png)
Fig. 1. continued
As described above, we determined the growth curve for each galaxy by integrating the galaxy light in elliptical apertures. The intensity at which this curve becomes asymptotically flat yields the total apparent magnitude. In a few cases, however, the first integration promptly led to a reasonably flat growth curve. Usually the outer shape of the growth curve shows a continuous increase or a maximum followed by a continuous decrease, indicating a slight, erroneous excess or deficiency in the sky level. The shape of the curve can therefore be used to do a fine-tuning of the sky level by simply adding or subtracting a constant to the whole frame. Once the growth curve is corrected to be asymptotically flat, the effective radius can then be read off where the growth curve reaches half of its asymptotic value. Using the equation
| (1) |
where is the total apparent magnitude and is the effective radius, we get the effective surface brightness, . These model-free parameters are listed in Table 1. The meaning of the columns has already been given there (recall that all values are extinction-corrected).
Surface brightness profiles can be obtained by differentiating the growth curve with respect to equivalent radius , where and are the major- and minor-axis, respectively. We used a resolution of , which corresponds to two pixel lengths. The extinction-corrected profiles are shown in Fig. 1 (left column on top). The upper curve is the profile and the lower curve the profile. Error bars are only shown for the profile. They can be considered as upper limits for the profile in . Only in the outer parts the error bars are larger than the plot symbols. The errors have been estimated using the remaining gradients on the frame after flat fielding and the intensity of the subtracted background. They therefore indicate the accuracy of the profile at the corresponding surface brightness level and do not take into account the fact that in some cases only one quarter of the galaxy light has been integrated.
In the bottom left panel of Fig. 1 we plot the colour profile. For dwarf galaxies in general one would expect rather flat profiles, i.e. no strong colour gradients. In the case of dwarf ellipticals a positive gradient, i.e. a reddening towards the outer parts, could be explained by the presence of a younger population of stars in the center, where the last star formation event took place (Vader et al. 1988). Surprisingly, almost half of the galaxies in our sample (10) exhibit a negative colour gradient, getting bluer towards the outer parts. This could mean that there is a metallicity gradient in these galaxies. Indeed, for five of these objects either a disk component has been discovered or at least indications of the presence of a disk have been found (Jerjen, Kalnajs & Binggeli 2000; Barazza et al. 2002). A separate, more elaborate investigation of the colour properties of dwarf ellipticals is in preparation (Barazza et al. 2003).
4.2 The Sérsic law: fits and parameters

The surface brightness profiles of dwarf galaxies, including dEs, can usually be fitted quite well by an exponential model (De Vaucouleurs 1959; Binggeli & Cameron 1991). However, the profiles of bright early-type dwarfs are known to deviate considerably from an exponential law (Caldwell & Bothun 1987; Binggeli & Cameron 1993). This deviation depends systematically on the luminosity of the dwarfs. Bright objects show a shallow luminosity excess in the inner parts, which cannot be caused by the presence of a nucleus. A better representation of the profiles of early-type dwarfs is provided by a Sérsic model (Sérsic 1968). This model, which is a simple generalization of De Vaucouleurs’ and exponential laws, can be written as
| (2) |
where is the surface brightness (intensity per area) at the equivalent radius . There are three free parameters, which are determined by a fitting procedure: the central surface brightness , the scale length , and the shape parameter . It is this latter parameter that takes care of the systematic, inner deviations from an exponential described above. The Sérsic model has turned out to be very appropriate for dwarf ellipticals (e.g. Young & Currie 1994: Binggeli & Jerjen 1998; Ryden et al. 1999). We fitted our surface brightness profiles with this model in the magnitude representation, which is
| (3) |
with A fit to the profiles has been performed outside of and above the level of in and in . This range has been chosen in order to exclude the nuclei and to avoid the outer parts of the galaxies which might be affected by flat-field uncertainties. The best-fitting parameters (again extinction-corrected) are given in Table 3:
column (1) and (2): identifications of the galaxies;
columns (3) and (5): central surface brightness in and , respectively;
columns (4) and (7): scale length (in arcsec ) in and , respectively;
columns (5) and (8): shape parameter in and , respectively.
In Fig. 2 we plot these parameters versus absolute magnitude in . For comparison we have added a sample of giant ellipticals and S0s from Caon et al. (1993), the data for the dEs and dSphs of the Local Group from Jerjen, Binggeli & Freeman (2000), and the large photographic sample of early-type dwarfs in Virgo (partly coinciding with ours) from Binggeli & Jerjen (1998). The diagram (top panel) shows a rather tight relation comprising all different types of spheroidal objects. As already found and commented upon by Jerjen & Binggeli (1997) and Jerjen, Binggeli & Freeman (2000), the early-type dwarfs perfectly bridge the gap between the faint dSphs of the local group and the giant ellipticals. The known dichotomy between Es and dEs in a luminosity-central surface brightness plot (e.g. Binggeli & Cameron 1991) vanishes in the Sérsic representation. Note that the dichotomy between core and power-law systems among normal Es (e.g. Faber et al. 1997) also disappears here: the Sérsic values are not actual but extrapolated central surface brightnesses from fitting the profiles outside the central few 100 parsecs; the dichotomies mentioned are restricted to those inner regions.
The relations in the remaining two plots are not as striking, although in both diagrams a certain continuity between the different galaxy classes is evident, above all among the ellipticals. In contrast, the faint local group dSphs stand slightly apart.
4.3 Accuracy of the fit

The best-fitting Sérsic model profiles are plotted as solid lines through the data points in Fig. 1 (upper left panel). The general trend of the observed profiles is matched quite well by the models. However, in some cases the decrease of the observed profile is not as smooth as the model in the inner parts. This is shown in the second plot of the first column in Fig. 1, where the difference between the observed profiles and the models is plotted. Error bars are shown for every other data point (mostly smaller than the plot symbols). The large residuals caused by the nuclei are not very surprising, as the very central parts ( 4”) have been excluded for the fit, but a few of the bright objects show considerable deviations from the model in the regions just outside of the nucleus as well. A rather strong scatter is shown by the dwarfs where a spiral structure has been discovered (IC0783, IC3328). Hence, in these cases a bad fit might be expected. But also “normal” dEs, like VCC0928 or NGC4415, show a remarkable deviation.
In order to quantify the deviations and to find out whether they are related to other properties of the galaxies, we determined the mean, absolute residual between the observed profile and the fit (only for the -band data):
| (4) |
with , the number of isophote data points between and in (the range used for the fit), , the surface brightness measured for the isophote, , the corresponding surface brightness of the model profile. This is of course simply the standard deviation ( scatter) of the points around the model fit. In Fig. 3 we plot versus effective surface brightness, . The error bars represent the mean error of the profile in the fitting range. Obviously, the more compact (or brighter) objects tend to have larger residuals. Most of the faint objects ( mag) have residuals within the errors, i.e. their profiles are well represented by a Sérsic model. This is not the case for the brighter galaxies. It is important to note that the mean error bars shown here are much larger than the actual errors in the central parts where the largest deviations from the model occur, i.e. the deviations shown in Fig. 3 are clearly significant. For dS0s the rather large residuals might be explained by the fact that many of these galaxies are believed to have a two-component structure, showing a high surface brightness, lens-like feature within a more extended low surface brightness part. Hence, a two-component model suitable for disk systems might be more appropriate for these objects. However, the result remains that not a single bright early-type dwarf in our sample is well represented by the Sérsic model. Whether a second component might be present in many “pure” dEs as well cannot be answered with these data. As the deviations mainly occur in the central parts of the profiles, a Nuker law (Lauer et al. 1995, Byun et al. 1996) or even a King model (King 1966) which are commonly used to fit the central features of early-type galaxies might be more suitable. However, this would increase the number of fit-parameters and make the comparison with other objects more difficult. Therefore, the Sérsic model is still a useful fitting law for a general analysis of the photometric properties of different object classes.

| VCC | Name | |||||||||||
|---|---|---|---|---|---|---|---|---|---|---|---|---|
| (1) | (2) | (3) | (4) | (5) | (6) | (7) | (8) | (9) | (10) | (11) | (12) | (13) |
| 0009 | IC3019 | 21.98 | 12.25 | 0.80 | 20.71 | 11.92 | 0.76 | 0.16 | 123.7 | 33.0 | 0.29 | 2.45 |
| 0490 | IC0783 | 20.25 | 1.80 | 0.47 | 19.17 | 2.49 | 0.51 | 0.18 | 106.8 | 50.2 | 0.20 | 0.78 |
| 0781 | IC3303 | 18.52 | 2.02 | 0.63 | 0.42 | 69.4 | 15.6 | 0.43 | 0.34 | |||
| 0810 | 22.48 | 5.38 | 0.95 | 21.33 | 5.80 | 0.99 | 0.05 | 139.0 | 4.9 | 0.08 | 0.42 | |
| 0815 | 21.74 | 3.50 | 0.67 | 20.96 | 5.18 | 0.80 | 0.21 | 131.7 | 60.5 | 1.08 | 0.79 | |
| 0846 | 21.39 | 2.07 | 0.60 | 19.14 | 0.55 | 0.43 | 0.17 | 103.7 | 43.2 | 0.05 | 0.63 | |
| 0850 | 24.47 | 6.69 | 1.27 | 22.92 | 4.70 | 0.93 | 0.51 | 54.2 | 12.3 | 1.66 | 0.45 | |
| 0856 | IC3328 | 17.58 | 0.08 | 0.32 | 17.59 | 0.54 | 0.42 | 0.09 | 80.7 | 29.0 | 0.05 | 0.20 |
| 0928 | 19.28 | 0.37 | 0.45 | 18.83 | 0.92 | 0.55 | 0.42 | 42.5 | 4.5 | 0.99 | 0.19 | |
| 0929 | NGC4415 | 17.35 | 0.12 | 0.33 | 15.59 | 0.07 | 0.31 | 0.13 | 60.2 | 8.1 | 0.01 | 0.26 |
| 0940 | IC3349 | 21.53 | 5.95 | 0.74 | 20.25 | 6.30 | 0.77 | 0.16 | 20.2 | 22.3 | 0.79 | 0.37 |
| 0962 | 24.21 | 9.03 | 0.82 | 23.05 | 10.27 | 0.98 | 0.31 | 59.1 | 12.8 | 1.10 | 0.78 | |
| 0998 | 23.98 | 5.99 | 1.01 | 22.56 | 4.95 | 0.89 | 0.36 | 174.0 | 4.9 | 0.31 | 0.56 | |
| 1010 | NGC4431 | 20.34 | 5.17 | 0.72 | 18.94 | 5.15 | 0.72 | 0.43 | 140.5 | 16.1 | 0.20 | 0.46 |
| 1036 | NGC4436 | 17.80 | 0.24 | 0.38 | 17.76 | 1.29 | 0.51 | 0.55 | 112.5 | 7.3 | 0.52 | 0.91 |
| 1087 | IC3381 | 20.32 | 3.15 | 0.59 | 19.25 | 4.31 | 0.66 | 0.30 | 101.4 | 10.7 | 0.31 | 0.21 |
| 1093 | 23.74 | 10.40 | 1.23 | 22.33 | 9.61 | 1.09 | 0.08 | 117.1 | 67.7 | 0.36 | 0.52 | |
| 1104 | IC3388 | 20.68 | 2.30 | 0.63 | 19.71 | 3.13 | 0.71 | 0.30 | 74.9 | 5.3 | 0.83 | 0.27 |
| 1129 | 23.32 | 5.11 | 1.10 | 21.76 | 3.76 | 0.93 | 0.18 | 90.1 | 20.4 | 0.59 | 0.21 | |
| 1254 | 21.70 | 4.99 | 0.77 | 20.60 | 7.21 | 0.91 | ||||||
| 1261 | NGC4482 | 19.31 | 1.82 | 0.52 | 18.14 | 2.00 | 0.54 | 0.40 | 134.5 | 4.6 | 0.27 | 0.40 |
| 1355 | IC3442 | 21.03 | 2.14 | 0.48 | 18.87 | 0.58 | 0.37 | 0.16 | 56.7 | 44.5 | 0.10 | 1.93 |
| 1422 | IC3468 | 19.86 | 2.49 | 0.55 | 18.81 | 3.12 | 0.60 | 0.18 | 157.1 | 29.3 | 0.41 | 0.33 |
| 1567 | IC3518 | 20.43 | 7.52 | 0.81 | 0.56 | 34.2 | 8.6 | 3.16 | 1.37 | |||
| 1895 | UGC7854 | 18.50 | 1.29 | 0.55 | 0.54 | 38.5 | 2.0 | 0.25 | 0.37 |
4.4 Comparison with data from the literature
In the upper panel of Fig. 4 we compare our total magnitudes with available data from the literature. Binggeli and Cameron (1993) give total apparent magnitudes in for a large sample of Virgo dEs. The 14 objects in common with our sample are shown as filled circles. In general, the data agree quite well. However, there are significant differences for some galaxies, which amount to mag or more in four cases. Only two objects can be compared with the data from Durrell (1997) in the -band (open circles). It is evident from Fig. 4 (upper panel) that our magnitudes tend to be slightly fainter than the ones from the literature. This could indicate that we have overestimated the background in some frames, due to the presence of several galaxies on the frame, leaving only a small region of the sky. Overall, we estimate the errors of the total apparent magnitudes to be mag in both filters.
In the lower panel of Figure 4 we compare our central surface brightnesses in and , derived by a Sérsic fit, to the data of Binggeli and Jerjen (1998) and Durrell (1997), respectively. Obviously, the two brightest objects strongly disagree. The fact that Binggeli and Jerjen used growth-curves for the fitting procedure cannot account for these differences (see their discussion of this point), nor could a difference in the seeing play a role here, as the Sérsic law fitting is done outside the central 3 or 4. However, since brighter objects usually have a steeper rise of the profile in the central parts, only slightly different Sérsic fits can have large deviations of the central surface brightness. Also, the brightest objects show generally the strongest deviations from the Sérsic law (see 4.3 above).
5 Isophotal analysis
Thanks to the high resolution of our observations we were able to perform an accurate analysis of the isophotal properties of the sample galaxies. To determine the corresponding parameters, we fitted ellipses to the isophotes, using a method described by Bender & Möllenhoff (1987), which is implemented in MIDAS as FIT/ELL3. In addition, we derived the deviations of the isophotes from pure ellipses and expanded them in a Fourier series. The fourth cosine parameter, , indicates the shape of the corresponding isophote: an isophote with a negative is called “boxy”, otherwise it is called “disky” (see Bender & Möllenhoff (1987) for details). In this way, we determined the ellipticities, the position angles of the major-axis and the shape parameters for all isophotes between and mag in with an interval of mag for each galaxy. In Fig. 1, right column, we plot these three parameters versus equivalent radius. The error bars have been determined using the prescription of Bender & Möllenhoff (1987). The ellipticity is defined as where and are the major- and minor-axis respectively, and is given as .
![[Uncaptioned image]](/html/astro-ph/0306339/assets/x18.png)
Fig. 5. continued
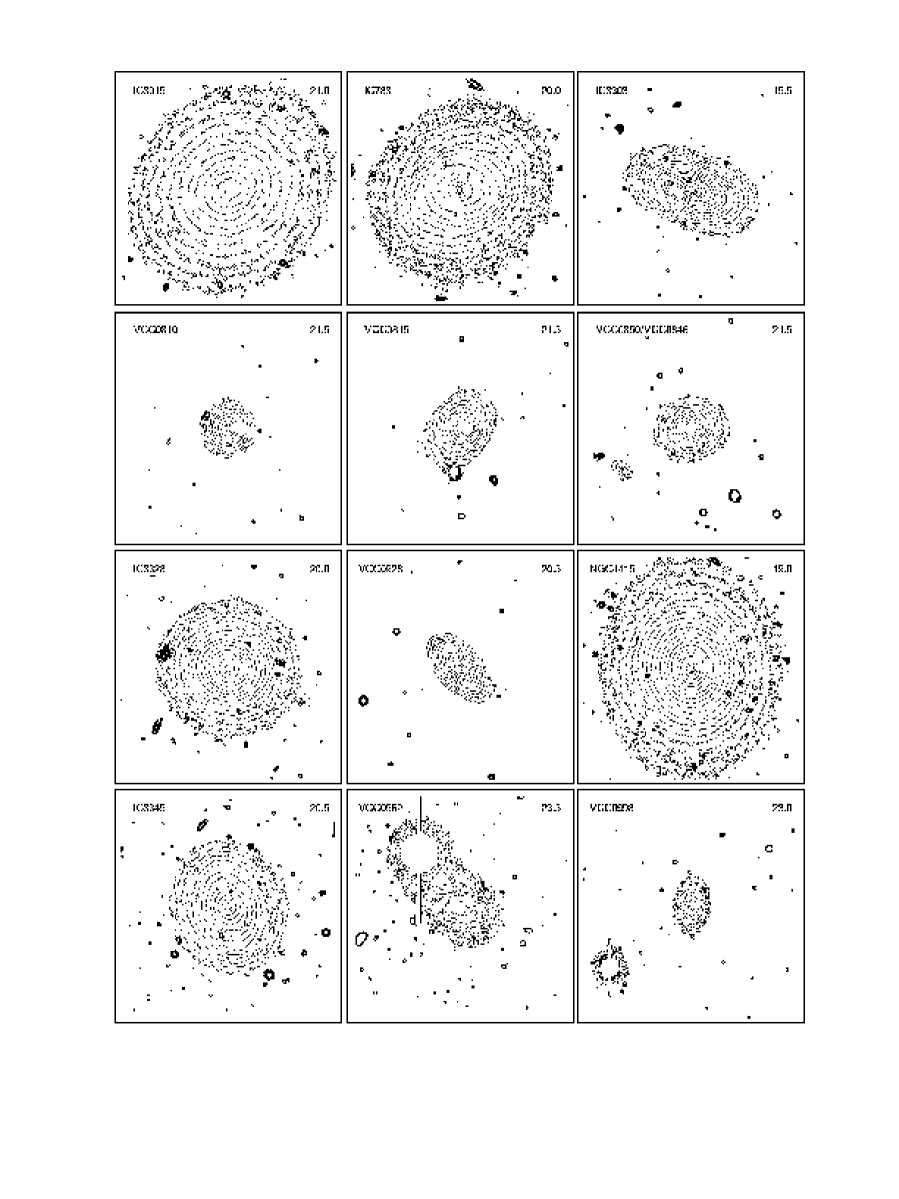
Since the center of the ellipse searched for is a free parameter in the fitting procedure, we could simultaneously measure the distance, , between the nucleus (or the center of the innermost isophote for not-nucleated dwarfs) and the center of the overall brightness distribution. This allows to determine a possible off-center position of the nucleus or the concentricity of the successive isophotes. The isophotal contours of the sample galaxies are shown in Fig. 5.
In order to investigate whether there are correlations between the isophotal parameters and other properties of the galaxies, we determined their mean, global values. The range within which the averaging was performed was again the same as for the profile fitting: outside the central and above an isophotal level of . Following the procedures of Ryden et al. (1999), the parameters of the isophotes contributing to the mean have been weighted by the fraction of intensity corresponding to that isophote. In this way the faint outer regions, where the errors are large, are automatically given less weight. Hence, the intensity - or luminosity - weighted mean is:
| (5) |
where represents , , or , and is the contribution of intensity of the isophote. In addition to these mean values, we determined the maximal isophotal twist of the galaxies within the considered radial range. The parameters are listed in Table 3, where the columns are:
column (9): ellipticity defined as ;
column (10): position angle of the major-axis, measured from top counterclockwise;
column (11): maximal isophotal twist;
column (12): isophotal shape parameter given as ;
column (13): nuclear off-set in arcsec, if no nucleus is present, the innermost isophote is taken as reference.
We omit VCC1254 in this analysis, since its isophotal parameters can not be determined with the required accuracy, due to its proximity to M49.
5.1 The isophotal shape parameter
Giant ellipticals as well as dwarf ellipticals owe their name to the fact that the shape of their isophotes is nearly elliptical. The shape parameter has been developed in order to quantify the deviations of the isophotes from an elliptical shape and to find correlations between these deviations and other properties of the galaxies. Isophotes whose is negative are called boxy, since their shape resembles a rectangle, and those with a positive are called disky, because they are more pointed, lemon-like, than the corresponding ellipse. It is generally believed that a galaxy with disky isophotes has a disk component; however, only disks seen nearly edge-on can be identified by (Carter 1987, Rix & White 1990). Moreover, there is a relation between and the radio and X-ray emission (at least for giant ellipticals), in the sense that boxy ellipticals tend to be the stronger sources. These correlations are shown in the study of Bender et al. (1989), who also find that apparently more flattened galaxies are either disky or boxy, whereas rounder objects tend to have (see their Fig. 1). A similar trend for dwarf ellipticals as well is shown by Ryden et al. (1999). Interestingly, however, these authors find about a dozen rather flattened galaxies which do not have boxy or disky isophotes, i.e. strongly flattened dwarfs do not show a gap in the distribution of between boxy and disky. We find the

same behavior in our sample. In Fig. 6 we plot ellipticity versus . The lines are the same as in Bender et al. (1989) and bracket the distribution of giant ellipticals. The general trend that rounder galaxies have seems to be valid for giants as well as for dwarfs. On the other hand, we find flattened dwarfs () with – in contrast to the findings for giants and in agreement with Ryden et al. (1999).
However, in view of the profiles for shown in Fig. 1, the significance of its weighted average is not so evident. Most of the profiles show large scattering and frequently change between the boxy and disky regime. Others have a boxy inner part and a disky outer part (or vice versa), rendering it difficult to asses a unique interpretation to the whole galaxy. For instance, VCC1093 is strongly disky in the central parts, but has nevertheless a negative global . O. Lehmann (diploma thesis, Basel 2002, unpublished) has tried to reproduce the profiles of a number of individual cases with multi-component models. By evaluating a best set of component parameters a satisfactory solution could indeed be found for most dwarfs. However, these models are probably not unique, nor do they seem to be physically very meaningful, as Stiavelli et al. (1991) have shown that the isophotal shape of being either boxy or disky might depend on the viewing angle. A more promising approach would involve 3D models along the lines of Ryden (1992).
Nevertheless, for some individual cases the (projected) shape parameter is quite straightforward to interpret. Consider for example the -profile of IC3388 (Fig. 1): all isophotes in the radius range used are disky, hence, it is justified to classify the galaxy as a whole as disky, suggesting that it hosts a disk component. Or NGC4431, where a hidden bar has been discovered (Barazza et al. 2002): the boxyness of the -profile in the central parts clearly reflects the bar and the radius, where the isophotes become disky indicates the extend of the bar.
5.2 Off-center nuclei
Even though the position of a nucleus with respect to the overall light distribution might not be considered as part of an isophotal analysis, we discuss this phenomenon in this context, since the measurement of the nuclear offset goes together with the determination of the isophotal parameters (see above). Moreover, offsets found not only represent off-centered nuclei but might also indicate that consecutive isophotes are not concentric.
In general, the nature of dE nuclei is still unknown; mostly they are regarded as massive compact star clusters which form separate dynamical entities, without being totally decoupled from the rest of the galaxy. They might have formed in the last burst of star formation in the evolutionary transition from dwarf irregulars to dEs (Davies & Phillipps 1988). Simulations suggest that such nuclei oscillate about the center of the galaxy (Miller & Smith 1992, Taga & Iye 1998). However, in these simulations the rotation of the main body is a crucial condition, which would not be complied by most of the dwarf ellipticals. On the other hand, Sweatman (1993) showed in his models that oscillations of central objects can also be explained by inherent motions due to statistical fluctuations, without going back to rotation.
More recently it was suggested that the nuclei could be the result of the merging of several globular clusters which sunk to the center of the galaxy through dynamical friction (Lotz et al. 2001). In the same study it was also shown that brighter nuclei tend to be in brighter host galaxies. However, a lower globular cluster specific frequency () suggested for dE,Ns cannot be found; on the contrary, dE,N have a higher than dEs (Miller et al. 1998). Oh & Lin (2000) studied a similar scenario including extra galactic tidal perturbations accounting for the fact that nucleated dEs are more concentrated to the center of the cluster than non-nucleated dEs. In addition, they found that the nuclei may be slightly off-center within Gyr after each globular cluster merger event. Indeed, in their study of 78 nucleated dwarf ellipticals and dwarf S0s, Binggeli et al. 2000 (hereafter BBJ) found that of the objects have off-centered nuclei. They also found a weak correlation between the strength of the offset and the effective surface brightness: fainter objects tend to have larger offsets. However, since the resolution of their data was rather low, the significance of this effect is not clear.

We therefore did the same analysis with our data, i.e. for each galaxy we determined the distances between the centers of the isophotes and the position of the nucleus. In case of an object without nucleus, i.e. for a dE, the innermost isophote was taken as reference. Due to the photon noise a small offset is always measured, even in the case of an exactly centered nucleus. To assess the resulting systematic and random errors we followed BBJ and performed Monte Carlo simulations for the method described, using model galaxies with nuclei placed at the center or slighly offset. It turned out that the noise causes a minimum offset of , i.e. one pixel length, and that a real offset is always underestimated, i.e. offsets measured larger than are real and are at the same time lower limits of the real displacements. (For details of the measurement and of the error estimation see BBJ). In Fig. 7 we plot the logarithm of the nuclear offsets obtained versus effective surface brightness in . Here we distinguish between dEs and dE,N. The dashed line indicates our lower detection limit of . The relation for the dE,Ns is evident: objects with lower effective surface brightnesses tend to have larger nuclear offsets, confirming the results of BBJ. With a correlation coefficient of 0.498 for the 16 dE,Ns, the relation is significant just at the 95% level. This cannot be due to larger errors in determining the position of a nucleus of a fainter object, as these uncertainties always lead to an underestimation of the offsets (see above). We would therefore rather assume that, for example, the three dE,Ns with have larger offsets than the ones measured.

We also plot, in Fig. 8, the nuclear offset versus the deviation of the observed from the mean expected for the observed luminosity. The underlying mean relation between absolute magnitude and effective surface brightness for the 16 dE,N galaxies, to which the residual values refer, is given by the equation = 0.545 + 31.39. The relation between the nuclear offset and the residual surface brightness (Fig. 8) is indeed stronger than the direct relation (Fig. 7). In particular, the two dE,Ns with the highest nuclear offsets are not the ones of lowest surface brightness (see Fig. 7), but they clearly have unusually low surface brightness for their luminosity (Fig. 8). The correlation coefficient for the relation shown in Fig. 8 is 0.879, which corresponds to a significance level above 99.9%.
In the context of the scenarios mentioned above, the relations found in Figs. 7 and 8 might be interpreted as follows: assuming that a central star cluster would oscillate around the center of the galaxy, we would expect that the oscillations are the stronger the shallower the potential well, i.e. the fainter the effective surface brightness is – either in an absolute sense (Fig. 7), or more likely in a relative sense with respect to the mean value expected for the luminosity (Fig. 8). On the other hand, if the nucleus is the result of the merging of several globular clusters, a correlation between offset and or is not a natural outcome, e.g. Oh & Lin (2000) do not find a magnification of the effective radius after a merger event in their models. The case of simple oscillations is therefore more likely.
5.3 Isophotal twists
In giant elliptical galaxies isophotal twists are a quite common phenomenon (Jedrzejewski 1987, Kormendy & Djorgovski 1989), usually divided into outer and inner twists. The latter are believed to be mainly caused by tidal effects (Kormendy 1982) or even by errors in the flat-fielding and background subtraction process (Fasano & Bonoli 1990), while inner twists are attributed to the two-component nature of many ellipticals (Nieto et al. 1992). Indeed, there are similar features in the profiles of isophotal parameters of Es and SB0s galaxies. Moreover, there is a correlation between isophotal twists and flattening in ellipticals (Galletta 1980). Finally, Ryden et al. (1999) determined isophotal twists in their sample of dwarf ellipticals, finding however only a weak relation with luminosity: brighter galaxies tend to have smaller values of isophotal twists.
Using the usual range () we determined the largest isophotal twist, , of the galaxies in our sample (column 10 of Table 3). In Fig. 9 we plot the twists derived versus ellipticity.

It is striking that strong isophotal twists are only exhibited by galaxies with ; more flattened objects show only weak twists. The relation found is very similar to the one presented by Galletta (1980) for giant ellipticals (see his Fig. 1). However, it could be argued that ellipticities and, above all, position angles of round galaxies have in general larger errors. Since for a round isophote already a small change of its shape, probably caused by noise, can lead to a large change of the position angle, we might expect a strong scatter in the radial profile of the galaxy and thus a larger twist. Nevertheless, we believe that the relation found is real for the following reasons: (1) We measure inner twists, as the typical position where the twists occur is at effective radii (average for galaxies with ). Measurement errors in these bright regions of the galaxies are negligible. Moreover, the outer limit considered is at a surface brightness level of mag, which is well within the confidence level (see Table 2). The errors of position angle measurements in this range are indeed very small (see error bars of the profiles in Fig. 1), hence large scatter caused by noise are very unlikely. (2) The border line between galaxies with and without strong twists occurs at an ellipticity of , which is still fairly round, i.e. there is no reason why there should not also be strongly twisted dwarfs with slightly larger than . (3) Even if we would assume that the determination of twists for round galaxies is due to photometric inaccuracy, the spread of values exhibited by these objects must be real, as it does not depend on luminosity (no correlation was found between twist and total magnitude). (4) Considering the profiles in Fig. 1, it is evident that the variations of the position angles are systematic and not irregular, as would be expected, if they were caused by measurement errors. Strong oscillations are only found in galaxies for which the presence of a spiral structure has been shown (IC0783, IC3328) and, hence, the strong scatter is explicable.

In order to asses the meaning of the twists observed it is important to consider the fact that we can only measure apparent ellipticities. As the distribution of intrinsic ellipticities for dwarf ellipticals has a maximum at with a sharp decline for rounder shapes (Binggeli & Popescu 1995), most of the objects with in our sample might suffer from projection effects, i.e. they appear rounder than they really are. On the other hand, assuming that these objects are triaxial ellipsoids, we would expect to observe an apparent isophotal twist, if the intrinsic axial ratios would change with radius (Binney 1978). Indeed, large twists are only exhibited by galaxies with and might therefore be due to projection and not to intrinsic changes of the position angles. In Figure 10 the isophotal twists are plotted versus the change of ellipticity, measured in the same radial range in which the twist is observed. Only galaxies with are shown. A rather striking correlation is in fact evident: strong twists seem to occur only when a considerable change of the ellipticity takes place as well (the correlation coefficient for the 12 galaxies plotted in Fig. 10 is 0.600, corresponding to a level of significance slightly above 95%). This strongly supports the conjecture that the twist effect (Fig. 9) is due to the projection of intrinsically triaxial ellipsoids.
Besides the twist-ellipticity relation, we also found a weaker correlation between twist and effective surface brightness. Thus, a connection between isophotal twist and nuclear offset might be expected and is indeed present, at least for the dE,Ns. Fig. 11 shows that galaxies with stronger twists have larger nuclear offsets (correlation coefficient for the 16 dE,Ns = 0.506, giving a statistical significance better than 95%). As the measurement of the offsets should not be affected by projection effects, the origin of the relation in Figure 11 is difficult to understand. However, assuming that the isophotal twists are real, the connections between effective surface brightness/radius, offset, and twist might indicate that less compact objects also tend to have stronger anomalies in their isophotal properties.

5.4 Ellipticity profiles
Most of the galaxies show a rather steep central rise in the ellipticity profile, particularly obvious in the brightest nucleated objects (see Fig. 1). This is not the nucleus itself, which is much smaller in size, but it might be due to the gravitational influence of the nucleus on the orbits of the nearby stars. Indeed, simulations indicate that already a rather low massive object in the center can scatter stars off the central density cusp and therefore disrupt box orbits and forcing the stars on circular paths (Gerhard & Binney 1985). If the nucleus is more massive, probably hosting a black hole, it can even shape the whole galaxy, leading to a rounder object. This was in fact predicted by Norman (1986) and confirmed through observations by BBJ (see their Appendix).
6 Summary and Conclusions
6.1 Surface photometry
We have carried out surface photometry (in and ) and a detailed isophotal analysis (in ) for 25 early-type dwarf galaxies in the Virgo cluster. The sample considered mainly consists of nucleated dwarf ellipticals and has a mean absolute magnitude in of and a mean colour of .
We provide surface brightness profiles in both filters and radial colour gradients. All profiles have been fitted by a Sérsic model and the corresponding parameters have been derived. Plotting these best fitting parameters together with the ones for giant ellipticals and local group dwarfs versus absolute magnitude (Fig. 2), we confirm the finding of Jerjen & Binggeli (1997) and Jerjen, Binggeli & Freeman (2000) that the cluster dwarfs perfectly bridge the gap between giant ellipticals and dwarf spheroidals, indicating that there is one, continuous family of spheroidal stellar systems, provided the central few 100 pc of these galaxies is not considered. However, considering in detail the fits obtained, we find several profiles with rather large deviations from the models, in particular in the more central parts. By defining a mean, absolute residual, , taking into account also the errors of the profiles, we find that bright galaxies, having mag, show the strongest deviations from the Sérsic form. We suggest that in addition to the objects with disk structure (spiral or bar) signatures (Jerjen, Kalnajs & Binggeli 2000, Barazza et al. 2002) where strong residuals might be expected, some of the bright dwarfs may be quite complex in structure, possibly being two-component systems as well.
6.2 Isophotal analysis
By fitting ellipses to the isophotes, we have derived radial profiles for the ellipticity, position angle, major axis, and shape parameter (Fig. 1). For these parameters, as well as for the offsets of the nuclei we have determined mean (global), luminosity-weighted values (Table 3). Plotting ellipticity versus we find a similar distribution as Bender et al. (1989) for giant ellipticals. However, as in the dE sample of Ryden et al. (1999) and in contrast to giant Es, there is no gap in the distribution between disky and boxy for highly flattened galaxies, i.e. there are highly flattened dEs that are perfectly elliptical. The meaning of a mean -value is not so clear, however, as most of the galaxies have a -profile that changes sign (from boxy to disky, or vice versa) along the galactocentric radius. Almost any behaviour of the profile can easily be reproduced with multi-component (many parameter) models, but in lack of any knowledge about the inclination(s), i.e. the intrinsic shapes of the components, it seems impossible to construct unique models for the isophotal structure of these galaxies.
As most of the sample galaxies are nucleated, we have also searched for the presence of off-center nuclei. Most nuclei are indeed slightly off center. Defining as the offset of the nucleus from the center of the overall light distribution, we have looked for systematic relations between nuclear offsets and other galaxy properties. We confirm the existence of a relation between and the effective surface brightness, which was first suggested by Binggeli et al. (2000): galaxies with fainter effective surface brightnesses tend to have larger nuclear offsets. An even stronger relation is found to hold between and the residual effective radius, determined with respect to the mean relation between effective surface brightness and absolute magnitude, i.e. dwarfs with lower than average surface brightness at a given magnitude have larger nuclear offsets. The most plausible explanation of the phenomenon is that the nuclei are simply oscillating about the centers in the shallow potential wells of these galaxies, as suggested by numerical simulations (Miller & Smith 1992, Taga & Iye 1998). The shallower the potential well (the lower the surface brightness), the higher the expected amplitude of the oscillations.
In addition, we determined isophotal twists, i.e. the largest changes of the position angles of the major axes within the range used for the isophotal analysis. We find a clear dependence of the twists measured on ellipticity in that large twists occur only in galaxies with . On the other hand, most of these galaxies are likely intrinsically more flattened, as the distribution of intrinsic ellipticities has a maximum at . Assuming that the objects are intrinsically triaxial ellipsoids, we suggest that the twists observed, always being accompanied by changing axis ratios, are caused by projection effects.
In view of the results of the isophotal analysis we conclude that less compact dwarf galaxies generally tend to have stronger irregularities like off-centered nuclei or twisted isophotes, than more compact systems. However, with the available data we cannot decide whether these properties are caused by external perturbations or are due to the presence of substructures in these objects. Moreover, projection effects may play a crucial role in producing certain isophotal properties. Assuming that dwarf elliptical galaxies are intrinsically triaxial systems, the twists observed could be explained in terms of projection effects caused by changing axial ratios in apparently round galaxies that are intrinsically more flattened.
Acknowledgements.
We thank the referee, Dr. N. Caldwell, for his constructive comments. F.D.B and B.B. are grateful to the Swiss National Science Foundation for financial support.References
- (1) Barazza, F.D., Binggeli, B., Jerjen, H. 2002, A&A, 391, 823
- (2) Bender, R., Möllenhoff, C. 1987, A&A, 177, 71
- (3) Bender, R., Surma, P., Döbereiner, S., Möllenhoff, C., Medejsky, R. 1989, A&A, 217, 35
- (4) Binggeli, B., Cameron, L.M. 1991, A&A, 252, 27
- (5) Binggeli, B., Cameron, L.M. 1993, A&AS, 98, 297
- (6) Binggeli, B., Jerjen, H. 1998, A&A, 333, 17
- (7) Binggeli, B., Popescu, C.C. 1995, A&A, 298, 63
- (8) Binggeli, B., Popescu, C.C., Tammann, G.A. 1993, A&AS, 98, 275
- (9) Binggeli, B., Sandage, A., Tarenghi, M. 1984, AJ, 89, 64
- (10) Binggeli, B., Sandage, A., Tammann, G.A. 1985, AJ, 90, 1681 (VCC)
- (11) Binggeli, B., Popescu, C.C., Tammann, G.A. 1993, A&AS, 98, 275
- (12) Binggeli, B., Barazza, F.D., Jerjen, H. 2000, A&A, 359, 447 (BBJ)
- (13) Binney, J. 1978, MNRAS, 183, 779
- (14) Bothun, G.D., Mould, J.R., Caldwell, N., Mac Gillivray, H.T. 1986, AJ, 92, 1007
- (15) Byun, Y.-I., Grillmair, C.J., Faber, S.M., Ajhar, E.A., Dressler, A., Kormendy, J., Lauer, T.R., Richstone, D., Tremaine, S. 1996, AJ, 111, 1889
- (16) Caldwell, N. 1983, AJ, 88, 804
- (17) Caldwell, N., Bothun, G.D. 1987, AJ, 94, 1116
- (18) Caon, N., Capaccioli, M., D’Onofrio, M. 1993, MNRAS, 265, 1013
- (19) Carter, D. 1987, ApJ, 312, 514
- (20) Conselice, C.J., Gallagher III, J.S., Wyse, R.F.G. 2001, ApJ, 559, 791
- (21) De Rijcke, S., Dejonghe, H., Zeilinger, W.W., Hau, G.K.T. 2001, ApJ, 559, 21
- (22) De Vaucouleurs, G. 1959, Handbuch der Physik 53, ed. S. Flügge (Springer, Berlin), 275
- (23) Davies, J.I., Phillipps, S. 1988, MNRAS, 233, 553
- (24) Durrell, P.R. 1997, AJ, 113, 531
- (25) Faber, S.M., Tremaine, S., Ajhar, E.A., Byun, Y.-I., Dressler, A., Gebhardt, K., Grillmair, C., Kormendy, J., Lauer, T.R., Richstone, D. 1997, AJ, 114, 1771
- (26) Fasano, G., Bonoli, C. 1990, A&A, 234, 89
- (27) Ferguson, H.C. 1989, AJ, 98, 367
- (28) Ferguson, H.C., Binggeli, B. 1994, A&AR, 6, 67
- (29) Ferguson, H.C., Sandage, A. 1988, AJ, 96, 1520
- (30) Galletta, G. 1980, A&A, 81, 179
- (31) Geha,M., Guhathakurta, P., van der Marel, R. 2002, AJ, 124, 3073
- (32) Gerhard, O.E., Binney, J. 1985, MNRAS, 216, 467
- (33) Harris, W.E., Durrell, P.R., Pierce, M.J., Secker, J. 1998, Nature, 395, 45
- (34) Hoffman, G.L., Williams, H.L., Salpeter, E.E., Sandage, A., Binggeli, B. 1989, ApJS, 71, 701
- (35) Jedrzejewski, R.I. 1987, MNRAS, 226, 747
- (36) Jerjen, H., Binggeli, B. 1997, in The Nature of Elliptical Galaxies, 2nd Stromlo Symposium, ed. M. Arnaboldi et al., ASP Conf. Ser. Vol. 116, p. 239
- (37) Jerjen, H., Binggeli, B., Freeman, K.C. 2000, AJ, 119, 593
- (38) Jerjen, H., Kalnajs, A., Binggeli, B. 2000, A&A, 358, 845
- (39) Jerjen, H., Binggeli, B., Barazza, F.D. 2003, in preperation
- (40) Jerjen, H., Kalnajs, A., Binggeli, B. 2001, in Galaxy Disks and Disk Galaxies, ASP Conf. Ser., Vol. 230, eds. J.G. Funes S.J. & E.M. Corsini, Astronomical Society of the Pacific, p.239
- (41) King, I.R. 1966, AJ, 71, 64
- (42) Kormendy, J. 1982, in Morphology and Dynamics of Galaxies, Martinet, L., Mayor, M. (eds.), 12th Advanced Course of the Swiss Society of Astronomy and Astrophysics. Sauverny, Geneva Observatory
- (43) Kormendy, J., Djorgovski, S. 1989, ARA&A, 27, 235
- (44) Landolt, A.U. 1992, AJ, 104, 340
- (45) Lauer, T.R., Ajhar, E.A., Byun, Y.-I., Dressler, A., Faber, S.M., Grillmair, C., Kormendy, J., Richstone, D., Tremaine, S. 1995, AJ, 110, 2622
- (46) Lotz, J.M., Telford, R., Ferguson, H.C., Miller, B.W., Stiavelli, M., Mack, J. 2001 ApJ, 552, 572
- (47) Miller, B.W., Lotz, J.M., Ferguson, H.C., Stiavelli, M., Whitmore, B.C. 1998, ApJ, 508, L133
- (48) Miller, R.H., Smith, B.F. 1992, ApJ, 393, 508
- (49) Nieto, J.-L., Bender, R., Poulain, P., Surma, P. 1992, A&A, 257, 97
- (50) Norman, C. 1986, in Star-Forming Dwarf Galaxies and related objects, Kunth, D., Thuan, T.X., Van, J.T.T (eds.), Gif sur Yvette: Edition Frontieres p. 477
- (51) Oh, K.S., Lin, D.N.C. 2000, ApJ, 543, 620
- (52) Rix, H.-W., White, S.D.M. 1990, ApJ, 362, 52
- (53) Ryden, B.S. 1992, ApJ, 386, 42
- (54) Ryden, B.S., Terndrup, D.M., Pogge, R.W., Lauer, T.R. 1999, ApJ, 517, 650
- (55) Sandage, A., Binggeli, B. 1984, AJ, 89, 919
- (56) Sandage, A., Binggeli, B., Tammann, G.A. 1985, AJ, 90, 1759
- (57) Schlegel, D.J., Finkbeiner, D.P., Davis, M. 1998, ApJ, 500, 525
- (58) Sérsic, J.-L. 1968, Atlas de galaxias australes, Observatorio Astronomico, Cordoba
- (59) Simien, F., Prugniel, Ph. 2002, A&A, 384, 371
- (60) Stiavelli, M., Londrillo, P., Messina, A. 1991, MNRAS, 251, 57
- (61) Stiavelli, M., Miller, B.W., Ferguson, H.C., Mack, J., Whitmore, B.C., Lotz, J.M. 2001, AJ, 121, 1385
- (62) Taga, M., Iye, M. 1998, MNRAS, 299, 111
- (63) Thomas, D., Bender, R., Hopp, U., Maraston, C., Greggio, L. 2003, in The Evolution of Galaxies. III. Kiel Euroconference, G. Hensler et al. (eds.), Kluwer
- (64) Vader, J.P., Vigroux, L., Lachièze-Rey, M., Souviron, J. 1988, A&A, 203, 217
- (65) Young, C.K., Currie, M.J. 1994, MNRAS, 268, L11