First Look XMM-Newton EPIC Observations of the Prototypical Starburst Galaxy M82
Abstract
We present initial XMM-Newton EPIC observations of the prototypical starburst galaxy M82. The superwind is seen to extend continuously from the starburst region to the X-ray emission associated with the H ‘cap’. We also find evidence for a ridge feature, probably associated with the superwind interacting with an HI streamer. Narrow band images, centred on individual X-ray lines, show differences in morphology, with higher energy lines being less spatially extended, and a systematic shift with energy in the region of peak emission. Spectral fits with two thermal and one power-law component provide a good fit to the spectra of the nuclear and inner wind regions, indicating a multiphase superwind. We discuss the implications of these observations on our understanding of superwinds.
keywords:
ISM: jets and outflow – galaxies: individual: M82 – galaxies: starburst, galaxies: ISM-galaxies – X-rays: galaxies1 Introduction
Starburst events in galaxies represent an important phase in the evolution of galaxies and ultimately in the generation of cosmic structure (Heckman 2002). Starbursts affect galactic structure and evolution by heating and metal-enriching the ISM via material outflowing from the starburst, and if the event is strong enough, removing some of the ISM via a galactic superwind. Indeed, if the starburst event is strong enough (or the galaxy small enough) a starburst can remove the majority of the ISM, with major implications for future star-formation (Mac Low & Ferrara 1999). Superwinds can have a major impact on their environments, enriching the IGM, suppressing galaxy formation and so on. The impact of these events may have been particularly important at high redshift (Mori, Ferrara & Madau 2002).
In order to study in detail the impact of superwinds on galactic evolution and the IGM it is necessary to look at nearby objects, where we have better spatial resolution and photon statistics. Nearby superwind galaxies, such as NGC 253, NGC 1569 and M82, are key objects and because superwinds are driven by hot shocked gas, originating from supernovae or fast stellar winds, then X-rays are probably the most important waveband to study superwinds. While Chandra is a superb instrument for disentangling point sources in galaxies, the large collecting area of XMM-Newton makes it better for studying extended low surface brightness features. Some important Chandra and XMM-Newton results on starbursts and superwinds have already been presented (eg Pietsch et al. 2001; Strickland et al. 2000; Martin, Kobulnicky & Heckman 2002). In this paper we present the first XMM-Newton European Photon Imaging Camera (EPIC) results for M82. The first M82 results from the XMM-Newton Reflection Grating Spectrograph (RGS) have been presented in Read & Stevens (2002).
M82 is a much studied, nearby starburst and superwind galaxy ( Mpc, Freedman et al. 1994, so that kpc). M82 is very IR luminous (Rieke et al. 1980), contains a substantial population of young supernova remnants and luminous HII regions (Pedlar et al. 1999), and many luminous super star clusters (de Grijs, O’Connell & Gallagher 2001), all indicating a strong and ongoing starburst, probably triggered by a close encounter with M81.
As regards the M82 superwind, extended, extraplanar emission is seen at several wavelengths. H observations show a filamentary structure consistent with a roughly conical bipolar outflow (Shopbell & Bland-Hawthorn 1998), with implied gas velocities along the cone surface of . The implied H morphology is roughly cylindrical for a height above the disk of pc, flaring out at larger with an opening angle of (McKeith et al. 1995). An additional structure, termed the H ‘cap’ lies at a distance of kpc to the NW of M82 and is probably associated with the superwind (Devine & Bally 1999).
M82 has been observed by virtually all X-ray satellites and only a selective overview is given here. EINSTEIN first detected extended X-ray emission associated with M82, extending for several kpc above the plane and being well correlated with the optical filamentary structure (Watson, Stanger & Griffiths 1984; Fabbiano 1988). Strickland, Ponman & Stevens (1997), using ROSAT, also studied the extraplanar emission, extending to kpc, with asymmetric morphology and brightness. Fitting spectra to subregions in the wind, they found that the fitted temperature of superwind emission drops from near the nucleus to in the outer wind. Strickland et al. (1997) concluded that the superwind X-ray emission was most likely coming from shocked clouds within the superwind rather than the superwind itself. Lehnert, Heckman & Weaver (1999) discussed an X-ray feature seen by ROSAT lying about N of M82, coincident with the H ‘cap’ emission, and concluded that this emission was likely produced by shock heating, as the superwind encounters a cloud in the halo of M82. This highlights a major unresolved issue – the origin of the X-ray emission from the superwind – is it due to the wind itself or shocked dense clumps within the wind, and how much of the superwind material is from the starburst and how much is entrained by the outflow? As highlighted by Strickland & Stevens (2000) understanding the origin of the X-ray emission is important to understanding the mass and energy contained in the wind, which in turn is crucial to understanding the impact of superwinds on their host galaxies and environments. High resolution Chandra observations of M82 have provided insight into the behaviour of point sources in the central region. The brightest source is located away from the galaxy centre and may be an intermediate mass black-hole or a beamed X-ray binary (Kaaret et al. 2001).
Here we focus on an initial look at the morphology and spectra of the superwind. A more detailed analysis will be presented in a later paper.
2 The XMM-Newton Observations of M82
M82 was observed with XMM-Newton on 2001 May 6 (revolution 258) for 30.9ksec, with the EPIC MOS and PN cameras in full frame mode with the medium filter. The following are preliminary results from the EPIC MOS1, MOS2 and PN data. Details of XMM-Newton and the EPIC MOS and PN instruments can be found in Jansen et al. (2001), Turner et al. (2001) and Strüder et al. (2001) respectively.
The data from the 3 EPIC instruments have been processed with standard procedures in the XMM-Newton SAS (Science Analysis System V5.2). Periods of high background were filtered out (leaving 30.0ksec of usable data). Only events with a pattern number and flag selection for good events were retained, and photons with an energy in the range . For the PN detector, ‘out-of-time’ events were screened out. The pipeline processing has identified over 330 point sources within the EPIC field, though many are spurious and associated with the “out of time” events. We defer a detailed study of the M82 point source population and the associated field to a later paper.
3 Results: Imaging the Superwind
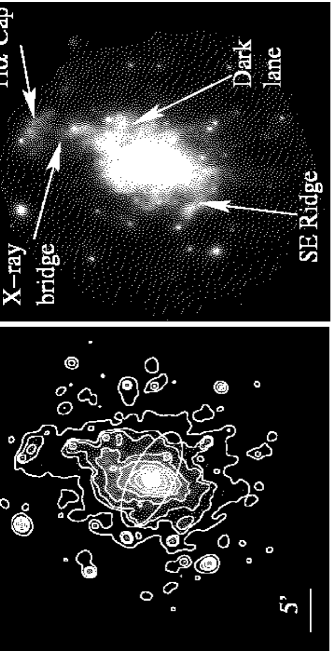
In Fig. 1 (left panel) we show a combined MOS1, MOS2 and PN image of M82. The data for each instrument has been corrected for periods of high background and out-of-time events, mosaiced together and adaptively smoothed. In addition to the large number of point sources in the field, the main features to note are the bright nuclear region and the extended extraplanar emission, predominantly bipolar in nature. The superwind emission is asymmetric, extending to a greater distance in the N () than the S (). For the northern wind the emission extends nearly to the edge of the field of view. The emission is also clearly highly structured.
There are a few more additional features to note; the enhanced emission in the N, coincident with the H ‘cap’, and a clear X-ray bridge connecting this emission to the main superwind emission. The X-ray emission associated with the H ‘cap’ also seems to be structured and contains a point source (which could well be a background object). As had been suspected, this X-ray emission is now clearly seen to be part of the superwind.
In Fig. 1 (right) we show a three colour image of the emission from M82. The 3 colour bands (red: , green: , blue: ) have been chosen to highlight the softer superwind emission. In addition to some harder point sources in the field, much of the superwind emission is of a fairly consistent colour, implying little temperature change outside the inner region. There does appear to be a softening towards the edge of the superwind. As can be seen from the spectral fits discussed later we see a reduction in both the fitted temperatures and in the level of absorption suffered. Both these effects are responsible for the softening of the wind emission.
The X-ray emission associated with the H ‘cap’ is concentrated in the (green) waveband. Another interesting morphological feature is a ridge of emission in the SE portion of the wind (and which is indicated in Fig. 1). Similar ridge like features in the X-ray emission from superwinds have been seen in NGC 253 for example (Strickland et al. 2000). In the N wind there is a region with a deficit of emission, which we term the ‘dark lane’, which is well correlated with HI emission (see later).
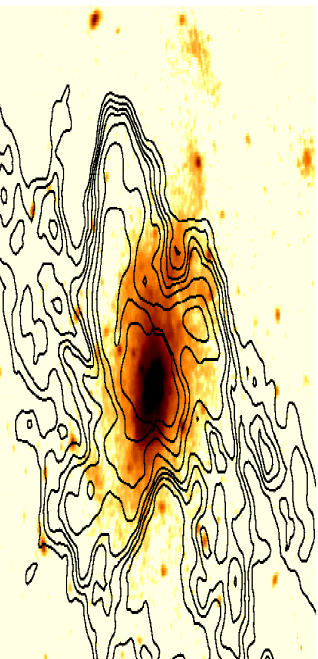
In Fig. 2 we show X-ray contours from the combined EPIC MOS1, MOS2 and PN image, superimposed on a H image of M82. Note that this H image does not extend out to the H ‘cap’. There is a good general tie-up in the superwind, between the filamentary H and the X-ray emission. In the northern wind there are indications of the X-ray emission more closely following the filamentary structure, with H emission associated with the tongue of X-ray material connecting to the H ‘cap’ emission.
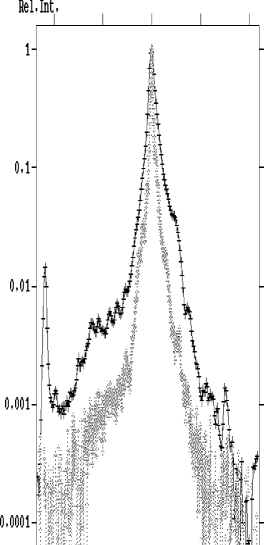
Fig. 2 also shows how the relative intensities of the X-ray and the H emission vary with distance, in a NW-to-SE slice (at a position angle of 25∘) through the nucleus of the galaxy. Both profiles have been background-subtracted. Though the H emission appears more centrally concentrated than the X-ray, several similarities in the profiles are evident. Both profiles show, that within the inner wind (up to ) the southern side is brighter. This is likely due to the fact that, due to the orientation of the system, we are able to see the southern side of the inner wind far more clearly than the obscured northern side. Beyond this however, the situation reverses; both the X-ray and the H profiles show a flattening of the intensity distribution to the N, whereas to the S, both profiles fall more rapidly, and disappear into the background. The northern wind is larger and extends further than the southern wind.
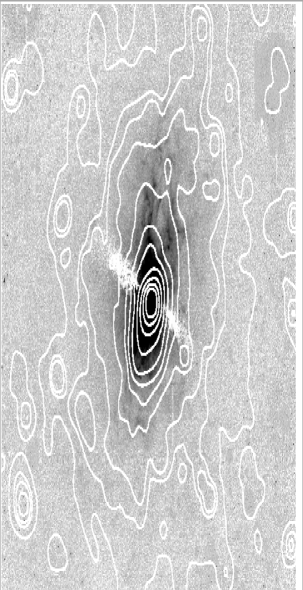
There are some striking correlations (and anti-correlations) between the X-ray emission and HI features. Contours of HI emission, constructed using the HI data of Yun, Ho & Lo (1994), are shown superimposed on the XMM-Newton image of M82 in Fig. 3. An apparent ‘hole’ in the HI emission is visible to the NW, coincident with the northern X-ray wind. It is likely that the hot X-ray wind, in travelling out into the IGM, has blown this hole in the intervening cold neutral material. Note though, that the HI features have masses comparable to those implied for the superwind, and so could provide a substantial obstacle for the outflow (Yun et al. 1993). The large HI feature to the east of the northern wind appears to be sharply bordered by X-ray emission from the superwind, and may be collimating the flow. The ’dark lane’ in the X-ray emission in the N wind seems also to be associated with enhanced HI emission. The ‘dark lane’ structure seen in the X-ray image could be due to either absorption by foreground HI emission or due to an interaction is not clear. The fact that we do not see a hardening of the spectra in this region in the 3 colour diagram (Fig. 1) suggests that it is not simply foreground absorption.
The southern wind does not show such an obvious HI ‘hole’ as the northern wind, but the X-ray ridge is interesting, lying at the southern edge of the large HI streamer extending to the east. The HI streamers to the southwest (in the direction of M81) do not show any significantly enhanced X-ray emission. Also, the H ‘cap’ does not show any associated HI emission, and hence has been assumed to be due to an ionized cloud.
| Region | Model | Normalisation | Fraction | |||||
| Component | (1022 cm-2) | ( ) | () | ( ) | (%) | (d.o.f) | ||
| Nuclear | mekal | 7 | 1.41 | |||||
| Region | mekal | 22 | (2136) | |||||
| Power-law | – | 71 | ||||||
| Inner Wind | mekal | 27 | 2.15 | |||||
| Region | mekal | 36 | (1069) | |||||
| Power-law | – | 37 | ||||||
| H ‘Cap’ | mekal | (fixed) | – | 1.32 (162) |
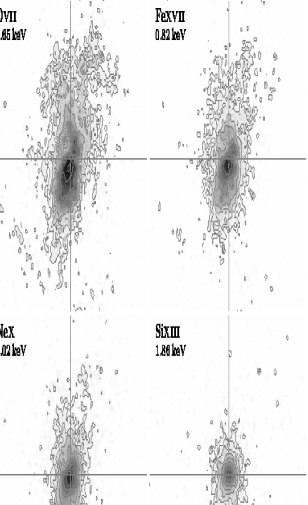
The large effective area of the EPIC instruments on XMM-Newton allows the generation of narrow band images, centred on particular lines, which gives further information on the thermal and (potentially) the abundance structure of superwinds. In Fig. 4 we show 4 such images, with each image centred in energy space on 4 lines, from low energy lines (OVIII, 0.65 ) up to higher energy lines (SiXIII, 1.85 ). The differences in morphology are marked, with the spatial extent of the higher energy lines being much smaller than the lower energy lines. There is also a systematic shift in the peak of the emission, with the emission peak of the lower energy lines being shifted to the S and SE by up to . The orientation of the M82 disk is such that the NW edge of the disk lies nearest to us (McKeith et al. 1995). As such, we are able to see the central regions of the X-ray outflow much more easily in the S than in the N. The energy shift in peak emission is very likely due to a combination of two effects the central plume of the very inner starburst wind (visible only in the south) above (i.e. to the SE of) the nucleus is visible in the lower energy band images, whereas the actual starburst nucleus is completely absorbed by the intervening disk of M82. As we move towards higher energies, the contribution of the central plume of the very inner wind emission decreases, whilst the starburst nucleus becomes progressively less absorbed, and more visible. An almost identical situation is seen in the other famous nearby starburst galaxy NGC 253 (Pietsch et al. 2001). Note also, that the X-ray spatial structure in the central regions of M82 has also been studied by analysing the dispersion and cross-dispersion profiles of the X-ray spectral lines observed with the RGS (Read & Stevens 2002). These results agree very well with the results presented here.
4 Results: X-ray Spectra
Previous X-ray spectral analyses of M82 have shown that multiple spectral components are needed (for instance, Moran & Lehnert 1997; Ptak et al. 1997), indicating the presence of multi-phase X-ray emitting material. In the light of these results we adopt a spectral model with two thermal and one power-law components (though we do note the ambiguities in results and physical interpretation that can result from such models - see for example, Dahlem et al. 2000). In addition, we find that one and two component models give substantially inferior fits.
In this first EPIC paper we present a limited number of results for a few regions of M82 and its superwind. More comprehensive results, dealing with the spectral variations in the superwind are deferred to a later paper. We have extracted spectra from all instruments, defining two concentric source regions, a nuclear region of radius and an annular inner wind region around the nuclear region, extending from an inner radius of to an outer radius of . The background has been taken from a circular region reasonably close to these regions but away from the diffuse emission. We have used a three component model to fit the PN and MOS1 and MOS2 spectra simultaneously, two thermal (mekal) components with the abundance parameter tied together and one power-law component, with each of the 3 components having an independent column. The physical justification for this model is that in the nuclear region, in addition to hot multi-phase superwind gas, we expect harder emission from the point source population and also possibly inverse Compton emission (Moran & Lehnert 1997). In the inner wind region, again in addition to the hot gas, we expect to detect emission from unresolved point sources (background AGN as well as sources associated with M82). The best-fit model results, absorbed luminosities etc of each component are given in Table 1 and shown in Fig. 5. The approximate number of counts in each of the spectra are: nuclear region – PN: 99000, each MOS: 47000; inner wind region – PN: 65000, each MOS: 28000 and H cap region – PN:4650, each MOS:1800. The power-law component in both regions is highly absorbed (though the values are not inconsistent with the HI values for absorption in front of SNRs in M82 quoted by Wills, Pedlar & Muxlow 1998) and has a slope broadly comparable to that of X-ray binaries and AGN. Both thermal components are relatively soft, with values broadly comparable to those seen with previous instruments. The single metallicity value is (apparently) reasonably well constrained at , though the reliability of this must be questioned (see below). The X-ray emission spectrum of the H ‘cap’ region is also shown in Fig. 5. On account of the relatively low count statistics the spectra are fitted with a single temperature mekal model (see Table 1), with . No firm constraints can be placed on the metallicity of this region.
From these fits we can estimate masses of the X-ray emitting gas in these regions (assuming spherical symmetry). Summing the masses in the two thermal components, we find wind masses of for the nuclear region and for the inner wind region, where is the volume filling factor of the X-ray emitting material (see Strickland & Stevens 2000 for a discussion of ). These values are broadly comparable with those of Strickland et al. (1997), given the different assumed geometries.
We expect the thermal emission from the superwind to come from both nuclear processed material expelled from the starburst and material entrained into the superwind from the galactic halo. The measured wind abundances can then, in principle, be an important constraint on superwind ejection processes, and be used to estimate the level of heavy element pollution of the IGM by the starburst. We can investigate the abundances of the nuclear and inner wind region by grouping elements into 3 groups: (1) He, C, and N (abundance set to solar), (2) Fe group – Fe and Ni (associated with SNe I), and (3) elements – O, Ne, Mg, Si, S, Ar and Ca (associated with SNeII). Fitting again with a two temperature plus power-law model, we find that (with the abundances tied between the two models) that the Fe group abundance is fitted to be and for the group , implying a slightly subsolar /Fe ratio. For the inner wind region the corresponding values are and , implying a supersolar ratio (cf. Martin et al. 2002 results for NGC 1569).
The presence of an Fe line at in the M82 spectrum has been suggested by BeppoSAX observations (Cappi et al. 1999). To verify this we have fitted a power-law+Gaussian model to the spectra of the nuclear and inner wind regions. For the nuclear region, we find a line at , width and a line flux of ph cm-2 s-1. For the inner wind region, we find a line at and a line flux of ph cm-2 s-1, with poorly constrained. These values are broadly consistent with Cappi et al. (1999).
5 Summary and Conclusions
In this paper we have presented initial results from XMM-Newton EPIC observations of M82, which show the extraplanar X-ray emission associated with the superwind of M82 in greater clarity than has been seen before. The main features are that the superwind emission extends out to a height of at least 14 kpc in the N and 7.5 kpc in the S and is highly structured. The superwind is continuous out to the X-ray emission associated with the H ‘cap’. The X-ray and H profiles are similar, with the S wind brighter but overall less extended. The are several interesting X-ray/HI correlations. In the N wind the superwind appears to have blown a hole in the HI gas, as revealed by a depression in the HI emission coincident with a region of X-ray emission. This penetration may explain why the N wind is more extended. The is also some evidence of the superwind being collimated by HI gas. An X-ray ridge-like feature towards the SE edge of the wind may be due to an interaction with an HI streamer.
The X-ray spectra from the central regions of M82 can be fitted with a three component model (2 thermal+power-law) with thermal components with and (nuclear region), and and (inner wind region). The emission is consistent with a model with multiphase thermal emission from the superwind, along with power-low emission from compact sources either in the galaxy or background AGN.
In summary, we have presented only a short overview of the XMM-Newton EPIC data on M82. More thorough work, which would include dealing with the point source contamination of the superwind, is needed for a detailed analysis of the superwind. The X-ray emission from the superwind is extremely complex and these observations have revealed new evidence of interactions of the superwind with circumgalactic material. Future work will concentrate on different aspects, such as the bright central point sources, the spatial and thermal structure of the superwind and the relationship to the observed H emission and the overall energetics of the starburst and the superwind.
Acknowledgements
The HI data used to produce Fig. 3 was kindly supplied to us by M.S. Yun.
References
- [1] Cappi M., et al., 1999, A&A, 350, 777
- [2] Dahlem M., Parmar A., Oosterbroek T., Orr A., Weaver K.A., Heckman T.M., 2000, ApJ, 538, 555
- [3] de Grijs R., O’Connell R.W., Gallagher J.S., 2001, AJ, 121 , 768
- [4] Devine D., Bally J., 1999, ApJ, 510, 197
- [5] Fabbiano G., 1988, ApJ, 330, 672
- [6] Freedman W.L., et al., 1994, ApJ, 427, 628
- [7] Heckman T.M., 2002, ASP Conf. Ser. 254: Extragalactic Gas at Low Redshift, p.292
- [8] Jansen F., et al., 2001, A&A, 365, L1
- [9] Kaaret P., Prestwich A., Zezas A., Murray S., Kim D., Kilgard R., Schlegel E., Ward M., 2001, MNRAS, 321, L29
- [10] Lehnert M.D., Heckman T.M., Weaver K.A., 1999, ApJ, 523, 575
- [11] Mac Low M-M., Ferrara A., 1999, ApJ, 513, 142
- [12] McKeith C.D, Greve A., Downes D., Prada F., 1995, A&A, 293, 703
- [13] Martin C.L., Kobulnicky H., Heckman T., 2002, ApJ, 574, 663
- [14] Moran E.C., Lehnert M.D., 1997, ApJ, 478, 172
- [15] Mori M., Ferrara A., Madau P., 2002, ApJ, 571., 40
- [16] Pedlar A., Muxlow T.W.B., Garrett M.A., Diamond P., Wills K.A., Wilkinson P.N., Alef W., 1999, MNRAS, 307, 761
- [17] Pietsch W., et al., 2001, A&A, 365, L174
- [18] Ptak A., Serlemitsos P., Yaqoob T., Mushotzky R., Tsuru T., 1997, AJ, 113, 1286
- [19] Read A.M., Stevens I.R., 2002, MNRAS, 335, L36
- [20] Rieke G.H., Lebofsky M.J., Thompson R.I., Low F.J., Tokunaga A.T., 1980, ApJ, 238, 24
- [21] Shopbell P.L., Bland-Hawthorn J., 1998, ApJ, 493, 129
- [22] Strickland D.K., Ponman T.J., Stevens, I.R. 1997, A&A, 320, 378
- [23] Strickland D.K., Heckman T.M., Weaver K.A., Dahlem M., 2000, AJ, 120, 2965
- [24] Strickland D.K., Stevens, I.R. 2000, MNRAS, 314, 511
- [25] Strüder L., et al., 2001, A&A, 365, L18
- [26] Turner M.J.T., et al., 2001, A&A, 365, L27
- [27] Watson M.G., Stanger V., Griffiths R.E., 1984, ApJ, 286, 144
- [28] Wills K.A., Pedlar A., Muxlow T.W.B., 1998, MNRAS, 298, 347
- [29] Yun M.S., Ho P.T.P., Lo K.Y., 1993, ApJ, 411, L17
- [30] Yun M.S., Ho P.T.P., Lo K.Y., 1994, Nature 372, 530