Chandra observation of the core of the galaxy cluster AWM 7
Abstract
We present results from a Chandra observation of the core region of the nearby X-ray bright galaxy cluster AWM 7. There are blob-like substructures, which are seen in the energy band 2–10 keV, within 10 kpc () of the cD galaxy NGC 1129, and the brightest sub-peak has a spatial extent more than 4 kpc. We also notice that the central soft X-ray peak is slightly offset from the optical center by 1 kpc. These structures have no correlated features in optical, infrared, or radio band. Energy spectrum of the hard sub-peak indicates a temperature higher than 3 keV with a metallicity less than 0.3 solar, or a power-law spectrum with photon index . A hardness ratio map and a narrow Fe-K band image jointly indicate two Fe-rich blobs symmetrically located around the cD galaxy, with the direction perpendicular to the sub-peak direction. In larger scales ( kpc), the temperature gradually drops from 4 keV to 2 keV toward the cluster center and the metal abundance rises steeply to a peak of 1.5 solar at kpc. These results indicate that a dynamical process is going on in the central region of AWM 7, which probably creates heated gas blobs and drives metal injection.
1 INTRODUCTION
Recent Chandra and XMM-Newton data have shown with their advanced imaging and spectroscopic capabilities rather complex features in the cores of rich clusters, including the brightest objects such as M87, Centaurus, and Perseus clusters. The newly emerging properties of the cluster core are roughly summarized into three aspects: the complex brightness structure often correlated with radio lobes, the lack of cool gas with temperatures below 1–2 keV, and the interesting metallicity profiles sometimes characterized by high-metallicity rings. The Chandra images show both filamentary structures and holes that coincide with radio lobes in some clusters. Clear examples are the Perseus cluster (Fabian et al., 2000; Schmidt, Fabian, & Sanders, 2002), and Hydra A (McNamara et al., 2000; David et al., 2001). The lack of the cool gas which was expected from radiative cooling raises a problem of heat source and heating mechanism (e.g. Fabian et al., 2001; Böhringer et al., 2002), which are still an unsolved question. Various possible heat sources have been proposed, but none of the existing models seems to explain the observed thermal structure of the cluster gas in a plausible way. The metal-abundance profile increases simply toward the center in M 87 (Matsushita et al., 2002), while the metallicity profiles in Perseus, Centaurus (Sanders and Fabian, 2002) and Abell 2199 (Johnstone et al., 2002) clusters show a peak at a certain radius from the cluster center. The precise origin of these “high-metallicity rings” is not understood yet.
AWM 7 is a nearby, X-ray bright cluster at a redshift of (Koranyi & Geller, 2000). The ROSAT data show a moderate cooling flow of 60 M⊙ yr-1, and a temperature drop at the center associated with the central cD galaxy, NGC1129 (Neumann and Böhringer, 1995). The ASCA mapping observation revealed an isothermal intracluster medium (ICM) with a temperature of 4 keV (Furusho et al., 2001), and a Mpc-scale abundance gradient from the central 0.5 solar to about 0.2 solar in the outer region (Ezawa et al., 1997). These results suggest that this cluster as a whole has been in a dynamically relaxed state. The ICM distribution, however, is not circularly symmetric but elliptically elongated in the east-west direction. The X-ray peak of the cD galaxy in the PSPC image is shifted from the center of the whole cluster by 30 kpc, and from the optical center of the cD galaxy by 3 kpc (Neumann and Böhringer, 1995; Koranyi & Geller, 2000). AWM 7 therefore is thought to be still in an early stage in the cD cluster evolution. No detection of CO emission from the cD galaxy was reported with an upper limit for the mass of molecular gas to be (Fujita et al., 2000). The NRAO image at 1.4 GHz does not show any significant radio emission from the cD galaxy (Burns et al., 1980).
In this paper, we report on the high spatial resolution X-ray image of AWM 7, along with the temperature and abundance profiles. This relatively young cD cluster is the best target to look into the processes taking place during the evolution of cD clusters and to make comparison with other systems.
We use km s-1 Mpc-1 and , indicating 29 kpc for and 0.49 kpc for at AWM 7. The solar number abundance of Fe relative to H is taken as (Anders & Grevesse, 1989).
2 OBSERVATION AND DATA REDUCTION
The core of AWM 7 was observed with Chandra on 2000 August 19 for 47,850 s using the ACIS-I detector. The center of the cluster was focused on the center of ACIS-I3 with an offset of and arcmin from the on-axis position, and we limit here our analysis to the I3 chip only. The data were taken with the Faint mode, and the CCD temperature was C. In order to check if significant flares may affect the data, we produced a light curve for the ACIS chips I0–2 which observed the sky region with relatively higher background contribution than the I3 chip using events in the 0.3–10 keV energy band. We found there was no flare-like time variation. We applied the data screening to keep the count rates within of the average of 4.7 count s-1, and it resulted in a slight reduction in the usable exposure time to 47,731 s.
3 THE CD GALAXY REGION
3.1 X-ray Image
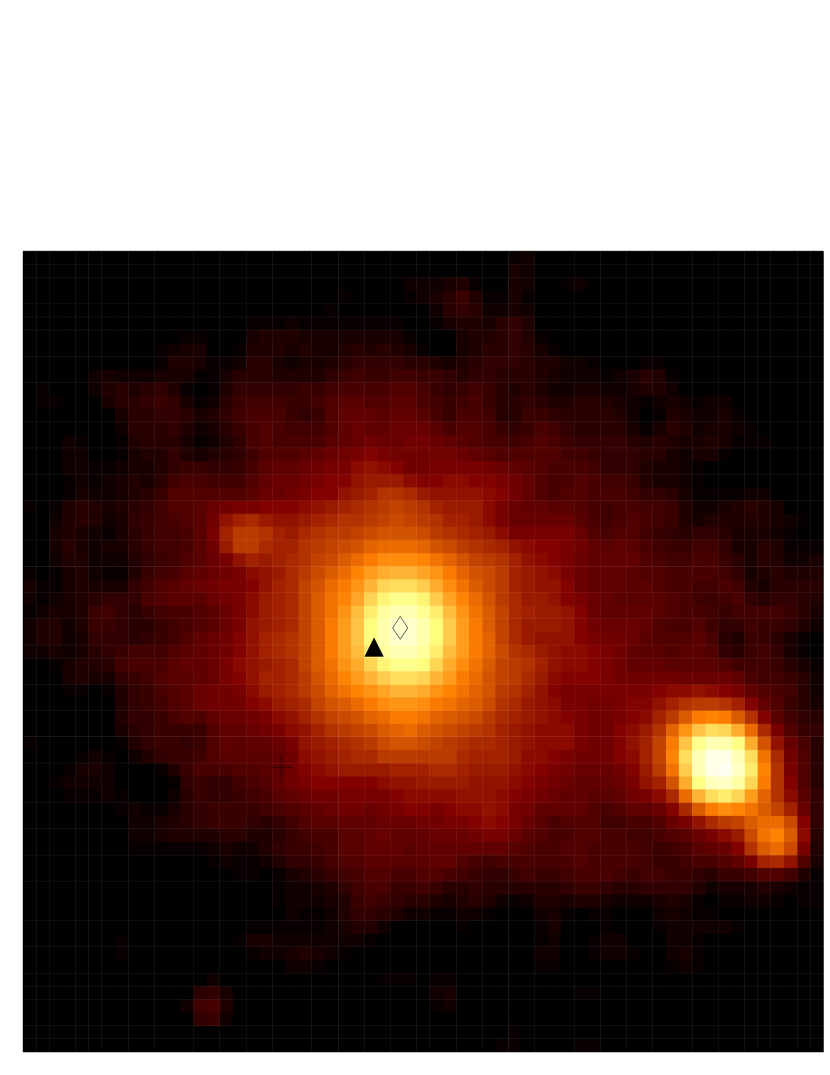
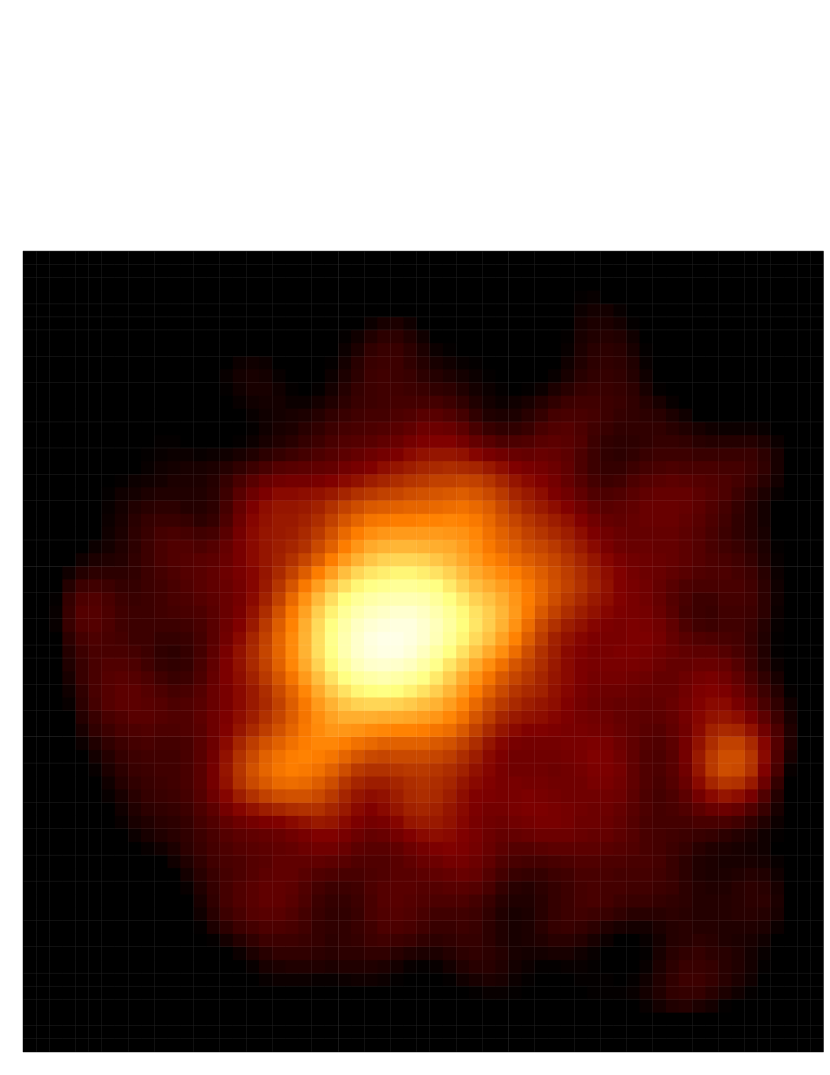
A smoothed image of the central region of AWM 7 in the 0.5–7 keV band is shown in Figure 1a. The image is smoothed by a Gaussian function with , and corrected for exposure. The X-ray image appears to mainly consist of the diffuse ICM and three emission components. The bright central emission corresponds to the cD galaxy, NGC 1129. The point-like weak emission at (13 kpc) southwest of the center is identified as a small galaxy, VV085b, which is more clearly seen in the 2MASS (The Two Micron All Sky Survey) infrared image in Figure 2c. The third component is a very faint extended feature near the cD galaxy with a separation (6 kpc) in the southeast of the cD. This component has no cataloged counterpart either in NED or SIMBAD. The image also shows signs of blobs or filamentary structures around the cD galaxy, and possible small X-ray holes at east and west of the center, such as those seen in other major cD clusters more distinctly.
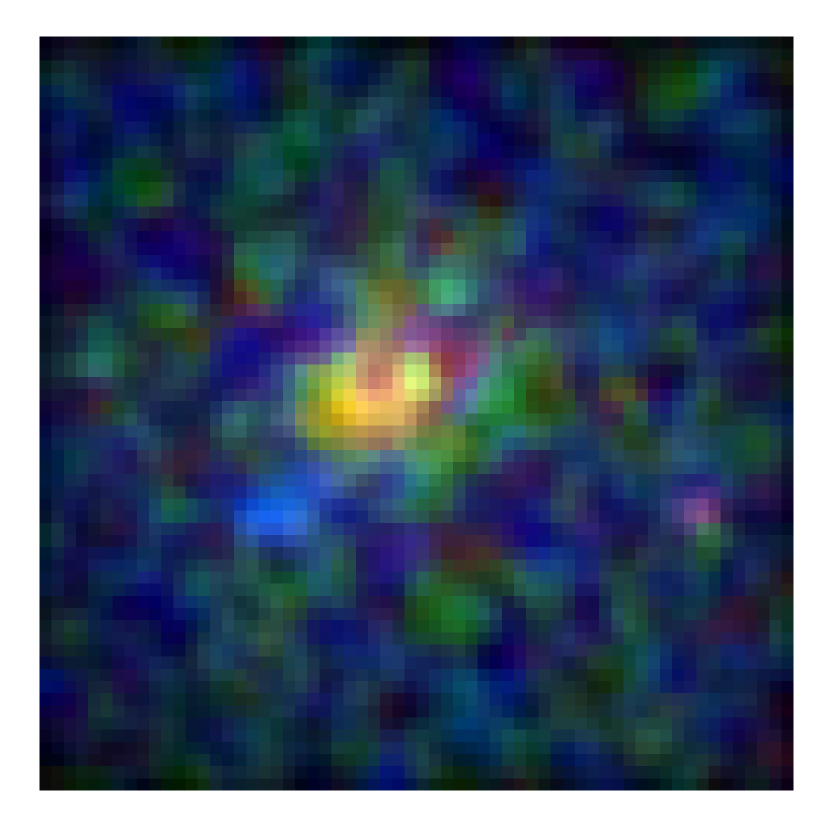
Figure 1b shows a color-coded X-ray image of the same region, in which X-ray photon energy is shown in three colors. The energy assignments for the 3 colors are 0.5–1.5 keV for red, 1.5–2.5 keV for green, and 2.5–8 keV for blue, respectively. There is an extended yellow region seen near the center, and the shape may be an unresolved small filament like the one seen in the Centaurus cluster (Sanders and Fabian, 2002). The southeast faint structure (hereafter hard sub-peak) in the cD galaxy is obviously bluer compared with the central region of the cD galaxy. X-ray color of the galaxy VV085b is red. The temperature of this galaxy is lower than the level of NGC 1129, however this source is too faint for a quantitative temperature determination with spectral fits.
In order to look into energy dependent structures, we create the soft (0.5–2.0 keV) and hard (2.0–10.0 keV) band images separately as shown in Figures 2a and 2b. The images are adaptively smoothed ith a minimum significance of . In these figures, the dotted lines indicate the cutout region whose intensity profiles are plotted in Figure 2d. The images are again for the central square region. The hard sub-peak in the southeast region marked by a cross appears very clearly in the hard band image, while it is hardly seen in the soft band. The X-ray flux of this hard sub-peak is very close to the peak at the cD galaxy, as seen in the 2–10 keV band profile (filled circles) in Figure 2d. Since the cluster center was focused on the I3 chip center with an offset of from the optical axis, the PSF at the hard sub-peak is wider than the on-axis PSF. The spatial extent of the sub-peak, more than , however, is wider than the PSF width at the sub-peak position as shown by the dashed curve in Figure 2d. Therefore, this sub-peak emission is unlikely to be from a single point source. The distance between the sub-peak and the cD galaxy center ( or 6 kpc) is much smaller than the isophotal radius of NGC 1129: (23 kpc) (Bacon et al., 1985). This sub-peak is thought to be an internal structure of the cD galaxy, if it is not either a foreground or a background source. It is remarkable that the 2MASS image of the cD galaxy shows no sign of a structure in the same position (Figure 2c).
We also notice that, in the hard-band image shown in Figure 2b, there are fainter blob-like features seen just in the northwest and possibly a hole or filament in the west of the cD galaxy. The 1-dimensional profile in Figure 2d in fact shows a peak at in the opposite side of the hard sub-peak. Furthermore, this hard band image shows a marked deviation from the spherical symmetry. The brightness shows a fairly sharp cutoff in the north to east direction of the cD, while it is more diffusively extended in the west to south direction. This morphology suggests that the hotter gas component in the central region may be moving to the northeast direction, creating a rather sharp edge in the front and a tailing feature behind. This rather complex nature of the central hot gas, which is only seen in the hard energy band ( keV) is an entirely new finding in the present analysis. Note that the boxes in Figure 2b show regions where spectra were extracted as described in §3.3.
We find another small structure in the very center of the cD galaxy. The X-ray peak in the 0.5–2 keV band is shown by a filled triangle in Figure 2a-c. We derived the peak position from the true data. The soft peak position, (R.A., decl.)J2000 = (, ), is slightly shifted to southeast from the 2MASS image center of NGC 1129, (R.A., decl.)J2000 = (, ), by (1 kpc) with a statistical error of as shown in Figure 2c. This feature has been noted by Koranyi & Geller (2000) who reported that the peak of the PSPC image was offset from the nominal position of NGC 1129. In the 2–10 keV band, coordinate of the X-ray peak at the cD galaxy is (R.A., decl.)J2000 = (, ), which is (0.5 kpc) away from the 2MASS image center. However, the statistical error in this band is so the uncertaintly range covers both the 2MASS and the soft peaks. Figure 2d shows one-dimensional profiles from southeast to northwest running through the hard sub-peak, and the center of the cD galaxy. The peak of the soft-band profile (open circles) is offset by a few arcsec, but the hard band one (filled circles) takes the maximum almost at the cD center.
3.2 Fe Blobs
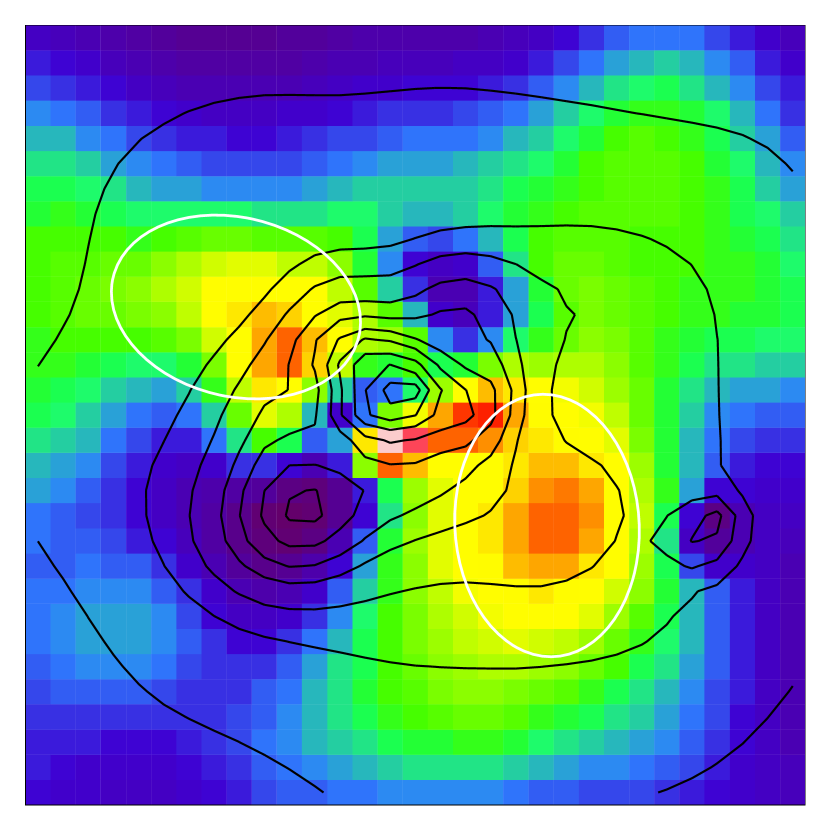
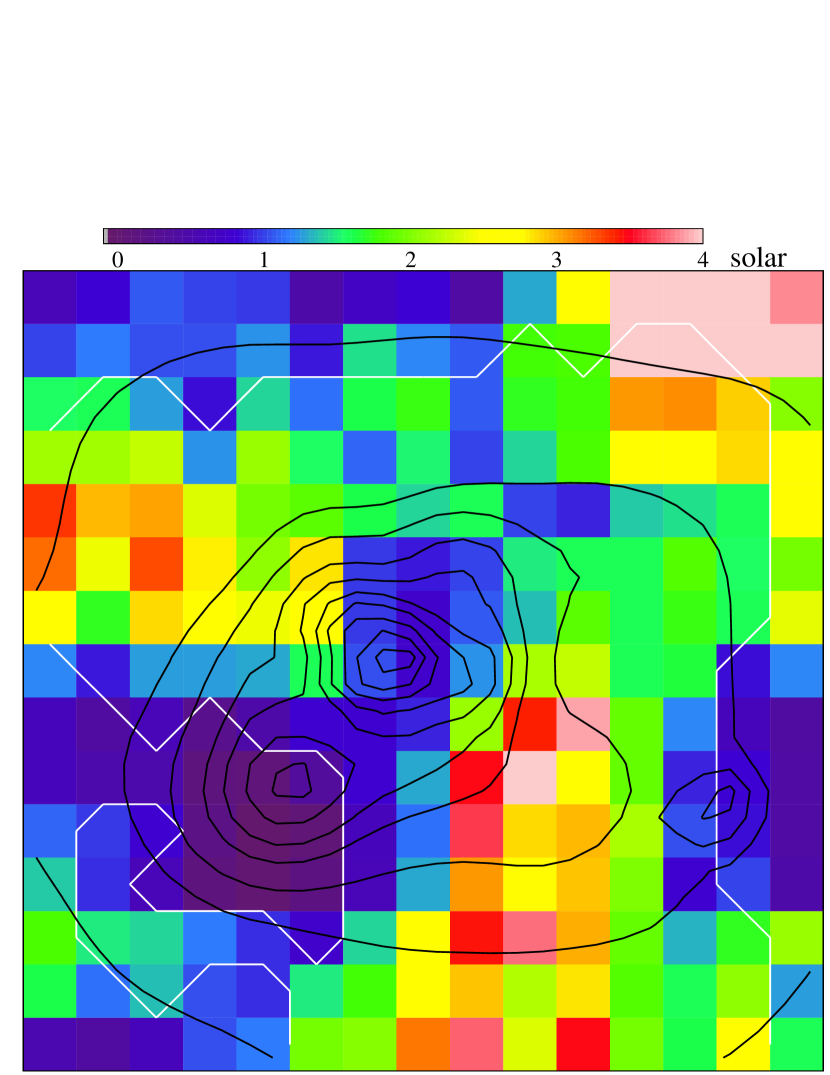
The left panel of Figure 3 shows an image by limiting the data in a narrow energy band 6–7 keV, which includes the Fe-K line, for the central region. The image shows two blob-like features symmetrically located around the cD galaxy center in the northeast and southwest directions. The two blobs contain 25 and 33 counts in the 6–7 keV band, while the surrounding regions of the same size have 9 and 13 counts, respectively. Interestingly, the angle of the line connecting the two blobs is perpendicular to that connecting the cD galaxy center and the hard sub-peak as seen in the 2–10 keV intensity contours. To confirm the enhanced Fe abundance, we calculated hardness ratios between fluxes in 6–7 keV and 2–6 keV for all positions and plotted them in the right panel of Figure 3, by converting them into the abundance values. Since the ICM temperature at is fairly constant within 20 % in this region, the hardness ratio should show us the approximate equivalent width of Fe-K line excluding the very center. We took running means over for each data point, because the photon statistics in the 6–7 keV band was too low to draw a pixel-by-pixel image. The region with good statistics is encircled by the white line, in which the statistical errors are less than 30%. The hardness map also indicates high-abundance regions around the two blobs seen in the left panel. As shown in the spectral fit in §4.3, the abundance value of the Fe blobs is 1.5–2.0 solar. We also note that in both panels of Figure 3 the southeast hard sub-peak has a very low Fe abundance, although the statistical errors are large.
3.3 Spectral Analysis
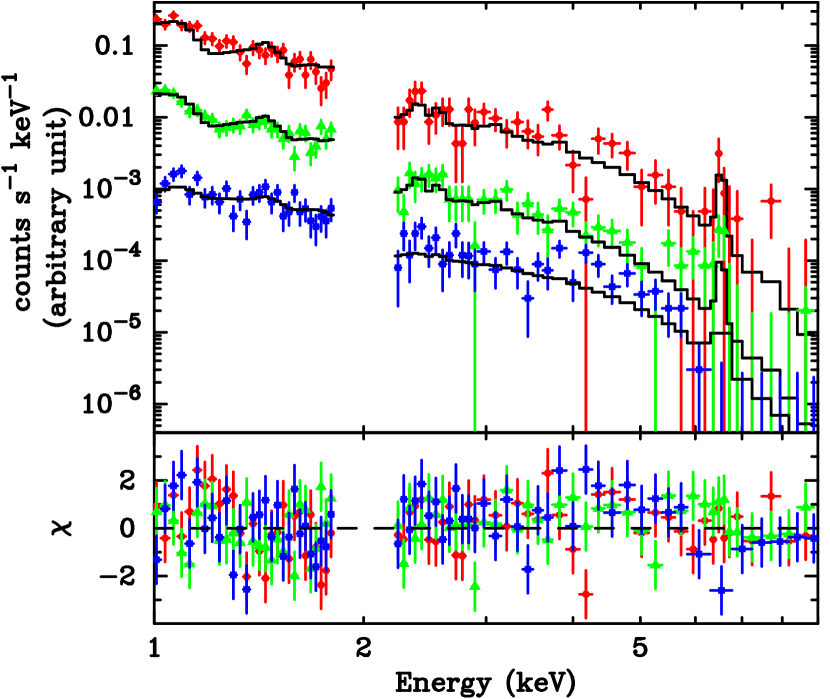
We first extracted pulse-height spectra for the central three regions, which correspond to the hard peak (cD center), soft peak, and the hard sub-peak as shown in Figure 2b. The region sizes are , , and , respectively. The data were corrected for CTI using the software provided by Townsley 111http://www.astro.psu.edu/users/townsley/cti/install.html, which significantly improved residuals of the spectra around Fe-K line. We have created background spectra using the blank sky data described by Maxim Markevitch 222http://asc.harvard.edu/cal. Response matrices and effective area files were made for multiples of pixels, and averaged with a weight of the number of photons in the region using “mkrmf” and “mkarf” in the CIAO software package distributed by the CXC. Since the response for the ACIS spectrum has a problem below 1 keV in determining the accurate absorption due to the material accumulated on the ACIS optical blocking filter, we added the acisabs absorption model 333http://legacy.gsfc.nasa.gov/docs/xanadu/xspec/models/acisabs.html available in XSPEC, and fixed the absorption at the Galactic value of cm-2. The parameter Tdays was set to 392, and the rest of the parameters were kept at their default values. We fit the spectra with an absorbed single temperature MEKAL model in the energy band 1–9 keV, excluding the 1.8–2.2 keV interval around the mirror Ir edge to minimize the effects of calibration uncertainties.
The spectra and resulting best-fit parameters are shown in Figure 4 and Table 1. The normalizations of the spectra are arbitrarily scaled to lay-out the spectra separately. The spectra of the soft and hard peaks, where most part of the emission comes from the NGC 1129 center, show the temperatures of 1.8 and 2.0 keV. They are consistent with the previous PSPC value of keV at the cluster center (Neumann and Böhringer, 1995) and are about half of the ICM temperature in the outer region. The luminosity of the cD galaxy, by adding the former two regions, is derived to be erg s-1 in the 0.5–10 keV band. The temperature of the hard sub-peak is about 3 keV, higher than the former two regions just as expected from the color X-ray image (Figure 1b). Since the spectrum of the sub-peak contains the hot ICM component along the line of sight, a spectral fit with an additional MEKAL component with a fixed temperature of 2.8 keV, which is roughly an average temperature at as shown in Figure 6, was carried out and resulted in the sub-peak temperature to be higher than about 5 keV with the best-fit metallicity value of zero solar. The metal abundance of the sub-peak is significantly lower compared with the other 2 regions and the surrounding ICM (see §4.2). Accordingly, the data also allows a power-law spectrum for the sub-peak component, with the best-fit photon index 1.2 and the 90% error range to be 0–2.5. However, the statistical quality of the data is poor and it is difficult to constrain the actual nature of the sub-peak emission. The estimated luminosity of the sub-peak excluding the ICM component is erg s-1, which is close to the levels of small elliptical galaxies.
To evaluate the significance of the enhanced Fe abundance, we also created a pulse-height spectrum for the sum of the two Fe blob regions and compared it with the one in the surrounding region. The actual regions where the data were accumulated are shown by the white ellipses in Figure 3a for the Fe blobs, and the surrounding low-metal region was an annular region with excluding the Fe blobs. Figure 5 shows the resultant spectra for the Fe blobs and the surrounding region. A prominent Fe-K line is indeed recognized in the blob spectrum. We fit the spectra in the same way as we did for the central spectra, i.e. single temperature MEKAL model with a fixed value. The Fe blob region shows the metal abundance to be 1.57 (1.03–2.10) solar, compared with 0.73 (0.52–1.04) solar for the surround region, with the values in parentheses showing 90% confidence limits for a single parameter. We looked into the difference in the values for two spectral fits, one with a common abundance for the two spectra and the other with separate abundance parameters, and it turned out to be 8.1 (138.8 and 146.9). The reduction of the value is more than 2.7 for one additional model parameter, which indicates that the two regions have different metal abundance at the 90% confidence (Malina, Lampton, & Bowyer, 1976).
4 THE SURROUNDING ICM REGION
4.1 Surface Brightness Profile
The top panel of Figure 6 shows the radial distribution of the X-ray surface brightness within a radius of (60 kpc) in the 0.5–10 keV band. Point source candidates were subtracted, and the exposure was corrected for. We center on the X-ray peak of the 0.5–10 keV image, which is the same position as the soft-band peak because the photons below 2 keV are dominant even in the full band image. The X-ray emission from the cD galaxy within a radius of is smoothly connected to the ICM without significant jump or edge features. The profile as a whole is very well fitted by a single model with the parameters derived as and (0.7 0.1 kpc). Errors denote the 90% confidence limits for a single parameter. The value is slightly larger than the previous HRI results which showed , and the core radius is smaller than the HRI value, (Neumann and Böhringer, 1995). The difference is reasonably explained by the higher spatial resolution of the Chandra data. The value obtained here is much lower than those in typical cD galaxies () or field elliptical galaxies (). The central density is obtained to be cm-3, which is consistent with the value derived from the HRI observation.
4.2 Temperature and Abundance Profiles
We have created annular spectra with a width of and fitted them with an absorbed MEKAL model. The point source candidates are subtracted. We have created background spectra in the same way as we performed for the spectra of the central region in §3.3. Each annular spectrum can be fitted well by an absorbed single temperature model with a reduced of mostly 0.9–1.2. The middle panel of Figure 6 shows the resulting temperature profile. We fit the spectra for two different energy bands, 1–9 keV and 2–9 keV, as indicated by crosses and diamonds in the lower two panels of Figure 6. The best-fit temperatures for these two energy bands are slightly different in each ring by about 0.5 keV. The tendency that the temperature gradually drops toward the center from around 4 keV is the same for both fits. The central temperature is 2 keV, about half of the average ICM temperature in the outer region. Similar features are seen in most cD clusters with ASCA (Ikebe 2001), and is also similar for a universal temperature profile for relaxed lensing clusters reported by Allen, Schmidt, & Fabian (2001).
The bottom panel of Figure 6 shows the radial profile of metal abundance. The abundance increases toward the center from 0.5 solar to 1.5 solar at kpc. The peak value exceeding 1 solar is much higher than the previous ASCA result (Ezawa et al., 1997) which is indicated by the dotted line. The abundance feature was not resolved by the large point spread function of the ASCA X-ray mirror. The central abundance falls back to 0.7 solar with the single temperature fit in the 1–9 keV band, leaving the ring-like metallicity peak at kpc. The similar profile is observed in other cD clusters, such as in the Centaurus cluster (Sanders and Fabian, 2002), Abell 2199 (Johnstone et al., 2002), and Abell 2052 (Blanton, Sarazin, & McNamara, 2003). To take the projection effect into account, we also fitted the central spectrum with a two-temperature model with fixed parameters of the projected ICM component as shown with the thick crosses. The resulting best-fit abundance is about 1.2 solar, which is still lower than the peak value. However, the errors now allow the curve to be flat, or a metal concentration at the center is allowed if one takes the result (1.6 solar) for the 2–9 keV fit. The deprojected abundance profile of M 87 shows the same result, which decreases to the center in the whole band fit, but increases to the very center in the fit above 2 keV (Matsushita et al., 2002). Unfortunately, the smaller core of AWM 7 with rather low surface brightness, compared with the one of Centaurus, M 87, etc, makes confirmation of the low abundance at the very center of AWM 7 difficult.
4.3 Two-dimensional Map
Since the radial profile always suppresses fine angular structures, we studied the spectra in 4 azimuthal directions separately for the central region in steps of . We fit the spectra with a single temperature model in the 1–9 keV band. Figure 7 shows the resulting 2-dimensional maps of temperature and abundance. The map shows that the temperature in the west half is almost isothermal with keV excluding the central region with . The southeast region is hotter than the average by 1.0 keV, while the surface brightness distribution is very smooth and symmetric. The abundance map again shows the high metallicity regions in the northeast of the second ring and the southwest of the third ring. These two regions exactly correspond to the two blobs described in §3.2. The best-fit abundances of the northeast and southwest blobs are solar and solar, respectively, while the surrounding regions show 1.0–1.4 solar with typical errors of 0.2–0.4 solar. The abundance distribution is almost uniform with solar in the four directions outside the Fe blobs.
5 DISCUSSION
We have analyzed the Chandra data of the galaxy cluster AWM 7, which brought us the X-ray view of the cluster center with the best spatial resolution ever achieved. In particular, the 2–10 keV image showed interesting structures in the cD galaxy. We found an extended emission with fairly hard spectrum ( keV) at a position 6–7 kpc off from the cD center. This source has no optical counterpart. Other weaker blob-like features are also seen in the 2–10 keV image in the central region. Based on the Fe band intensity map and the hardness ratio map, we found two extended regions with strong Fe-K line emission almost symmetrically aligned with respect to the cD center. The directions of these Fe blobs from the cD center are perpendicular to that of the hard sub-peak. We derived radial profiles of the surface brightness, temperature, and metal abundance for the surrounding ICM within a radius of , which showed some common X-ray features with other cD clusters. Below, we will discuss about the implications of these new and interesting results.
5.1 Hard Sub-Peak and Hot Blobs
The sub-peak recognized in the hard band image has a spatial extent of about 4 kpc if it belongs to AWM 7, and it is certainly more extended than the PSF. The X-ray luminosity at the distance of AWM 7 is estimated to be erg s-1, which is comparable to those of elliptical galaxies. Other fainter blobs which are suggested in the hard band image (Figure 2b) have lower luminosities by several factors. Here, we examine the possibility whether this hard sub-peak really belongs to AWM 7 or not. The observed properties of this source, i.e. an extended X-ray emission with a temperature keV (or nonthermal) and the lack of optical counterpart, makes the possibility of foreground or background object very unlikely. Possible extragalactic objects with extended emission are elliptical or starburst galaxies, or distant clusters, but the absence of optical counterpart is a severe problem. Furthermore, the complex structure seen in the hard-band image strongly suggest that the whole feature is the emission of AWM 7 itself and that the hard sub-peak is simply the brightest blob among the other fainter ones. With these consideration, we may conclude that the sub-peak feature is a gas cloud residing in the core region of AWM 7. We note that a number of X-ray blobs with a similar size (3 kpc) have been found in the core region of the cluster 2A 0335+096 (Mazzotta et al., 2003), in which blob luminosities are several times erg s-1. A notable difference is that the blob temperatures in 2A 0335+096 ( keV) are similar to the surrounding ICM level, while in AWM 7 the blobs seem to be hotter or the emission is nonthermal.
Let us look into the nature of the hot blobs. If the emission is thermal, the temperature of the sub-peak is higher than 3 keV and the metal abundance is relatively low at solar. These properties are quite unique, and do not match the gas properties of either elliptical galaxies or surrounding ICM. Since there is no radio emission observed at the cluster core, non-thermal pressure such as due to magnetic field is unlikely to be a major source to confine the hot gas in the sub-peak component. In that case, the hard sub-peak and other fainter blobs may not be in pressure equilibrium with the surrounding gas. The sound crossing time to smooth out the density structure is yr, which is shorter than either the conduction time of yr, or the cooling time of yr. If there is indeed no external pressure which stops the structure dissipating away, these hot blobs have to be created very recently, within 1–10 Myr. If major part of the hot gas in the central region is moving, as suggested from the sharp-edge feature in Figure 2b, the blobs may be continuously created in the turbulence.
5.2 Metal Distribution
The projected radial profile of the metal abundance shows a steep gradient, reaching about 1.5 solar. The abundance may fall back at the center, and apparently creates a high metallicity ring at (5–10 kpc). The off-center peak in the abundance profile was found in some major cD cluster cores. The radius of the metallicity peak is, however, smaller in AWM 7 than those in other clusters, such as kpc for Centaurus (Sanders and Fabian, 2002), kpc for Abell 2199 (Johnstone et al., 2002), and kpc for Perseus (Schmidt, Fabian, & Sanders, 2002). Morris & Fabian (2003) suggests that the central abundance begins to decrease with the thermal evolution of ICM with a non-uniform metal distribution, which can account for the smaller peak radius of the rather young cluster AWM 7.
Our 2-dimensional hardness analysis showed that the observed high metallicity peak was mainly caused by the two Fe blobs symmetrically located around the cD center. The angles of the Fe blobs from the cD center are perpendicular to hard sub-peak direction. This configuration suggests that the high metallicity gas may have been expelled from the cD galaxy due to some pressure invoked along the northwest to southeast direction. The hard sub-peak and the fainter one on the other side may be causing such a pressure, for example, by falling into the cD galaxy on both sides. If this is the case, the relatively higher temperature of the blobs can be explained as due to shock or compressional heating.
The total mass of Fe contained in the Fe blobs is estimated to be . The star formation rate of NGC 1129 is yr-1 within kpc (McNamara & O’Connell, 1989). Assuming that 1 solar mass of Fe is injected into ICM when a total of 100 solar mass of the stars are formed, then has been produced within 1 Gyr. Only 5% of the total Fe mass is enough to account for the Fe blob. Therefore, at least the amount of Fe in the Fe blobs can be explained by the metal production in the cD galaxy, even though the reason why metal injection occurs in a directional way is not clear.
5.3 Gas Heating in the cD Galaxy
The radial temperature distribution shows a smooth and monotonic decrease from 4 keV to 2 keV at the cluster center. The temperature decrease toward the cluster core has been previously recognized as cooling flows, but the data from XMM-Newton showed that the low-temperature gas with keV is missing in many cD clusters. In AWM 7, the radiative cooling time at the center is estimated to be yr, which is shorter than the cluster age. However, the central temperature seems to be maintained at 2 keV, which is about half of the gas temperature in the outer region. This situation is similar to the feature seen in many other cD cluster centers observed with Chandra and XMM-Newton (e.g. Peterson et al., 2002). It seems that in AWM 7 also, the thermal structure in the cluster center is determined by a certain balance between radiative cooling and some heat source. We note that the same problem about the unknown heat source so far recognized in cooling flow systems is also met in this relatively poor cluster.
Several scenarios to account for the heat source in cluster cores are proposed by several authors. One of the heating scenario is to invoke radio jets from the central AGNs (Böhringer et al., 2002). In the case of AWM 7, however, no radio activity has been observed in NGC 1129, which makes the AGN jets unlikely to be the heat source. Another possibility to suppress the cooling is the heat input through thermal conduction from the surrounding hotter ICM gas. The necessity for unrealistic fine tuning of the heat conductivity over a wide region is found in explaining the observed temperature distribution (Kitayama & Masai, 2003). Therefore, heat conduction is difficult as the heating mechanism.
In the present case, we consider that the gas motion in the central region may be at least related to the heat source. As already shown earlier, there are hot blobs which are hotter than the gas in the cD center. We also discussed that these blobs may have been created by a possible bulk motion of the gas in the central region, as suggested by the morphology in the hard energy band. Although we do not know the detailed feature and the exact cause of such a motion, it is enough to heat up a considerable fraction of the gas up to keV as seen in the sub-peak spectrum. If this energy is brought in to the central cool gas, it would certainly be able to compensate the energy carried away by the radiative cooling.
The position of the soft X-ray peak shows a significant offset by kpc from the 2MASS position of the cD galaxy center, whereas the X-ray peak in the hard band suggests a smaller offset by kpc. The offset between the soft X-ray and the 2MASS peaks suggests that there is a relative motion between the hot gas and the galaxy core. In the optical band, there is a chain of four small galaxies extending in the southwest direction, so the galaxy distribution is out of symmetry around the cluster core. Peletier et al. (1990) reported that there is a large twist in the position angle of NGC 1129 at a radius of in the optical band. They suggest that this twist could be a result of a galaxy merger. With these optical features as well as the offset of the soft X-ray peak, we may consider that the central region of AWM 7 is fairly dynamic and that it may well connected with the unidentified heat source.
Since ASCA showed a Mpc-scale abundance gradient and isothermal gas distribution, it has been thought that AWM 7 has not experienced cluster-scale mergers nor significant mixing. The present Chandra data revealed kpc-scale structures and suggested that the central region can be dynamic. Further direct information about the dynamical motion of the gas blobs (hard sub-peak and Fe blobs) will give us clearer view about the actual physical process occurring in the cluster core. X-ray imaging spectroscopy facilitated by a new technique, such as microcalorimeters on Astro-E2, will bring us rich information about the evolution of cD galaxies and clusters.
References
- Allen, Schmidt, & Fabian (2001) Allen, S.W., Schmidt, R.W., & Fabian, A.C. 2001, MNRAS, 328, L37
- Anders & Grevesse (1989) Anders, E., & Grevesse, N. 1989, Geochim. Cosmochim. Acta, 53, 197
- Bacon et al. (1985) Bacon, R., Monnet, G., & Simien, F. 1985, A&A, 152, 315
- Blanton, Sarazin, & McNamara (2003) Blanton, E.L., Sarazin, C.L., McNamara, B.R. 2003, ApJ, 585, 227
- Böhringer et al. (2002) Böhringer H., Matsushita K., Churazov E., Ikebe Y., Chen Y., 2002, A&A, 382, 804
- Burns et al. (1980) Burns, J.O., White, R.A., Hanisch, R.J. 1980, AJ, 85, 191
- David et al. (2001) David, L., Nulsen, P.E.J., McNamara, B.R., Forman, W., Jones, C., Robertson. B., Wise. M., 2001, ApJ, 557, 546
- Ezawa et al. (1997) Ezawa, H., et al. 1997, ApJ, 490, L33
- Fabian et al. (2000) Fabian A.C., et al. 2000, MNRAS, 318, L65
- Fabian et al. (2001) Fabian A.C., Mushotzky R.F., Nulsen P.E.J., Peterson J., 2001, MNRAS, 321, L20
- Fujita et al. (2000) Fujita, Y., Tosaki, T., Nakamichi, A., Kuno, N. 2000, PASJ, 52, 235
- Furusho et al. (2001) Furusho, T., et al. 2001, PASJ, 53, 421
- Ikebe (2001) Ikebe, Y. 2001 (astro-ph/0112132)
- Johnstone et al. (2002) Johnstone, R.M., Allen, S.W., Fabian, A.C., Sanders, J.S. 2002, MNRAS, 336, 299
- Kitayama & Masai (2003) Kitayama, T., & Masai, K. in preparation
- Koranyi & Geller (2000) Koranyi, D.M., & Geller, M.J. 2000, AJ, 119, 44
- Malina, Lampton, & Bowyer (1976) Malina, R., Lampton, M., & Bowyer, S. 1976, ApJ, 209, 678
- Matsushita et al. (2002) Matsushita, K., Belsole, E., Finoguenov, A., Bohringer, H. 2002, A&A, 386, 77
- Mazzotta et al. (2003) Mazzotta, P., Edge, A., Markevitch, M. 2003, ApJ submitted (astro-ph/0303314)
- McNamara & O’Connell (1989) McNamara B.R. & O’Connell, R.W. 1989, AJ, 98, 2018
- McNamara et al. (2000) McNamara B. et al. 2000, ApJ, 534, L135
- Morris & Fabian (2003) Morris, R.G., & Fabian, A.C. 2003, MNRAS, 338, 824
- Neumann and Böhringer (1995) Neumann, D.M., & Böhringer, H. 1995, A&A, 301, 865
- Peletier et al. (1990) Peletier et al. 1990, AJ, 100, 1091
- Peterson et al. (2002) Peterson, J.R., Kahn, S.M., Paerels, F.B.S., et al. 2002, ApJ submitted (astro-ph/0210662)
- Sanders and Fabian (2002) Sanders, J.S. & Fabian, A.C., 2002, MNRAS, 331, 273
- Schmidt, Fabian, & Sanders (2002) Schmidt, R.W., Fabian, A.C., & Sanders, J.S. 2002, MNRAS, 337, 71
| region | offset† | /dof | ‡ | ||
|---|---|---|---|---|---|
| (kpc) | (keV) | (solar) | (erg/s) | ||
| soft peak | 2.0 | 2.02 | 0.89 | 100/81 | |
| hard peak (cD center) | 0.8 | 1.79 | 0.68 | 76/81 | |
| hard sub-peak | 6.4 | 2.94 | 0.34 | 104/77 |
† Distance from the center of the cD galaxy.
‡ X-ray luminosity in the 0.5–10 keV band assuming that the distance is 104 Mpc.
(a) (b)
![[Uncaptioned image]](/html/astro-ph/0306331/assets/x3.png)
![[Uncaptioned image]](/html/astro-ph/0306331/assets/x4.png)
(c) (d)