Stellar Populations in NGC 4038/39 (The Antennae): Exploring A Galaxy Merger Pixel-by-Pixel11affiliation: Based in part on observations obtained at the Cerro Tololo Interamerican Observatory, operated by the Association of Universities for Research in Astronomy, Incorporated, under a cooperative agreement with the National Science Foundation.
Abstract
We present deep, photometrically calibrated BVRJHK images of the nearby interacting galaxy pair NGC 4038/39 (“The Antennae”). Color maps of the images are derived, and those using the B, V, and K-bands are analyzed with techniques developed for examining the colors of stars. From these data we derive pixel-by-pixel maps of the distributions of stellar populations and dust extinction for the galaxies. Analysis of the stellar population map reveals two distinct episodes of recent star formation: one currently in progress and a second that occurred 600 Myr ago. A roughly 15 Gyr-old population is found which traces the old disks of the galaxies and the bulge of NGC 4038. The models used successfully reproduce the locations of clusters, and the ages we derive are consistent with those found from previous Hubble Space Telescope observations of individual star clusters. We also find 5 luminous “super star clusters” in our K-band images that do not appear in the B or V-band images. These clusters are located in the overlap region between the two galaxies, and are hidden by dust with visual extinctions of mag. The techniques we describe in this paper should be generally applicable to the study of stellar populations in galaxies for which detailed spatial resolution with Hubble is not possible.
1 Introduction
The Antennae is a well-known example of a strongly interacting pair of nearby spiral galaxies (at 19.2 Mpc assuming ; Whitmore et al. 1999) viewed nearly face-on. With this favorable geometry, we can examine the stellar content in the disks of these galaxies without complications arising from inclination or heavy dust obscuration, as is often the case for more advanced mergers (Sanders Mirabel 1996, and references therein). The galaxies in the Antennae are merging slowly on wide orbits (e.g., Mihos, Bothun, Richstone 1993). Thus, we would expect multiple episodes of enhanced star formation, triggered during times of closest approach of the two systems, to be separated far enough in time from each other to be observed as separate entities in the merging galaxies.
The fact that enhanced episodes of star-formation accompany mergers of galaxies has been hinted at for almost 50 years, at least since Zwicky (1957) noted that the filaments connecting multiple galaxies are mostly blue. However, even though mergers may play a dominant role in determining the morphology of galaxies, recent evidence has shown that the total amount of star-formation over the course of a merger is relatively modest compared to the amount of star-formation over a galaxy’s lifetime (Kennicutt, 1998). For example, the strength of the burst star-formation rate in NGC 4038/9 resulting from their recent merger is at most a few times that of a steadily star- forming disk (Kennicutt, 1998). By studying the Antennae in detail, we will not only gain insight into the nature of the newly formed populations, but we will also learn about the roles of old, intermediate-age, and young populations in NGC 4038/9, and the distribution of dust in the merger.
Optical and near-infrared colors provide a natural way to sort out stellar populations, as shown by Frogel (1985). Near-infrared colors are less sensitive to recent star-formation than optical colors and are relatively insensitive to the severe extinction present at optical wavelengths; the extinction optical depth at K is only 10 percent of that in the V-band (Martin Whittet, 1990). Since mergers are often dusty systems, the contribution of the K-band data to our analysis plays a crucial role in sorting out the amount of dust present, and thus helps us determine the stellar populations present. Near-infrared observations will be most sensitive to radiation from the old stellar population of the Antennae, i.e. those stars present before the most recent bursts of star-formation. For nearly all galaxies the old population constitutes most of a galaxy’s stellar mass. Optical colors, on the other hand, are most sensitive to young Population I blue stars and will be most affected by dust. Even though the young stars dominate the optical light from a galaxy, they account for only a small fraction of the total mass of a galaxy.
The Antennae have been studied in great detail with the Hubble Space Telescope (HST); these studies have concerned themselves primarily with discrete sources in the two galaxies (i.e., star clusters). Many “super star clusters” have been identified in the Antennae. These stellar systems, often found in merging galaxies, present an opportunity to study the formation processes of globular clusters (e.g., Holtzman, J. A. et al. 1992). Extensive work on the Antennae by Whitmore Schweizer (1995), Whitmore et al. (1999) (hereafter, W99), and Zhang, Fall, Whitmore (2001) (hereafter, ZFW) has concentrated on these super star clusters, in addition to less extreme clusters. These authors find that the clusters range in age from very young Myr-old clusters, which must have formed in the most recent merger event, to very old Gyr-old clusters, probably true globular clusters which must have been present in the progenitor galaxies before the interaction. All told, they identified 14,000 point-like objects, with approximately 8000 of them being young clusters (using an estimate based on subtracting all definite stars).
The super star clusters, however, tell only part of the story of star-formation in the Antennae. Our purpose in this paper is primarily to analyze the more extended stellar populations throughout the galaxies, to which clusters may or may not be contributors, such as the disks and bulges of the galaxies. This gives a more complete picture of the star-formation in the merger. Although our data consist of BVRJHK ground based images of the Antennae, we make use of only the B, V, and K band data; the near-infrared K band being crucial in our population analysis. An especially effective way to study the diffuse light of galaxies (e.g., Abraham Merrifield 2000, Eskridge et al. 2003, Kong et al. 2000), or a merger (de Grijs et al., 2003), is to examine images pixel by pixel, thus exploiting the full spatial resolution of the images. Using spectral synthesis of the observed colors in each pixel, we find the luminosity-weighted average population(s) present, and assign a luminosity-weighted average age to each pixel. From this, we derive effective population age and reddening maps of the Antennae that we use to study the locations of young, intermediate-age, and old populations, along with the dust distribution. In we describe the observations and data; in we explain the techniques used to obtain ages and reddening. The derived age and extinction maps, in addition to the clusters detected only at K, are examined in ; our conclusions are given in .
2 Observations
B, V, and R images of the Antennae were obtained under photometric conditions on UTC 1995 March 8 on the 1.5 m telescope of the Cerro Tololo Interamerican Observatory (CTIO) with the direct imaging filter wheel and the Tek No.2 CCD. This CCD gives a field of with a spatial scale of 044 pixel-1. Cumulative on-source integration times were 20 min, 15 min, and 10 min at B, V, and R, respectively. Twilight sky exposures were used to provide flat-field calibration. The images in each filter were added together and cosmic rays were cleaned using interactive median filtering. Equatorial standard star fields from Landolt (1992) were observed at a range of airmasses to derive photometric transformations onto the Kron-Cousins BVR system. The final images have limiting surface brightnesses ( rms) of 24.6, 24.4, and 23.8 mag arcsec-2 for B, V, and R, respectively.
J, H, and K images of the central regions of the Antennae were obtained through thin cirrus on UTC 1995 March 13 with the CTIO 1.5 m telescope using the CTIO Infrared Imager (CIRIM). Each of the images covered a field of view of with a spatial scale of 116 pixel-1. The J and H images were taken in groups of 5 equal length integrations with comparable length off-target sky images acquired between integrations. Among the 5 images, the target position was dithered on the detector by in a cross-shaped pattern to allow for median combination and to avoid bad pixels and detector blemishes. The K images were acquired as 10 separate images taken in two sequences of 5 images each using the same sky chopping and target dithering pattern as the J and H images. The integration time of each image that went into each of the 10 K-band images is only 5 seconds. We would chop to sky each time we took a 5 second image. Each sequence of images in a given filter began and ended with off-target sky images of comparable exposure to the on-target images, providing a complete set of sky frames for subtraction. Cumulative on source exposure times were 30, 23, and 43 minutes at J, H, and K, respectively.
Because the long exposure images were acquired under non-photometric conditions, we also took short J, H, and K images of the Antennae under photometric conditions two nights later. Standard stars from the list of Carter Meadows (1995) were observed at a range of airmasses on the night the short images were taken. The long exposure images were calibrated using stars common to both long- and short-exposure images. Photometry was reduced to the CTIO/CIT system (Elias et al., 1982). The final images have limiting surface brightnesses ( rms) of 21.4, 20.8, and 19.7 mag arcsec-2 for J, H, and K, respectively.
To facilitate comparison between images in different photometric bands, we merged the IR and optical data sets into 6 photometrically calibrated images on a common pixel scale of 116 pixel-1, corresponding to a linear scale of 108 parsecs per pixel. Our final images have a modest seeing of FWHM (140 parsecs effective linear resolution). We used the near-IR images as the fiducial ones since they have the largest pixels. The optical images were placed on the scale of the near-IR ones with linear transformations that included translation, scaling, and rotation terms. These transformations were derived by fitting to the positions of stars common to the images. Inter-image registration is accurate to , as estimated from the variances in the centroids of field stars in the final registered images. These images, in which each pixel in each image samples the same location in the galaxy, form the basic data of our subsequent analysis. As examples, Figures 1a, 1b, and 1c display the B, V, and K images, respectively. Absolute uncertainties in the photometry are estimated to be mag at B, 0.03 at V, and 0.06 at K. The larger uncertainties in the near-infrared reflect our resort to a “bootstrap” calibration between photometric and non-photometric images.
3 Analysis
The main objective of this paper is to determine the stellar content of the Antennae as a function of position. We are especially interested in deriving luminosity-weighted ages for the different populations. As mentioned in the Introduction, our approach to this objective will be based on a pixel-by-pixel analysis of the images. Pixels are excluded from the analysis if they are below a threshold value of 5 above the median sky value at K (18.8 mag/ pixel; 19.2 mag/ arcsec2). This criterion is adopted since contribution from the sky is greatest in the K-band and because the K image is the noisiest of the three. Since all of our images are aligned and transformed onto the same pixel scale, pixels rejected from the K-band image are also rejected from the other bands.
We model pixels from the Antennae with two single stellar population models: one which models exponentially decaying star-formation on a timescale of = 100 Myr, the typical dynamical time for a galactic disk, and another with a decay timescale of = 15 Gyr, which describes an older but still star-forming disk, from the 1996 version of the Bruzual Charlot GISSEL models (Bruzual Charlot 1993; hereafter, BC). The models have a Salpeter initial mass function truncated at 0.1 and 100 M⊙ and solar metallicity. This is in agreement with Mengel et al. (2002) who found that the spectra of a number of clusters in the Antennae was consistent with solar metallicity. We cannot rule out the possibility, however, that there was steady enrichment of the stars over the last 15 Gyr, which would result in older stars that are more metal-poor. Nonetheless, the qualitative results of this paper do not differ if a = 15 Gyr model with sub-solar metallicity is used.
The colors and were chosen because has a long wavelength baseline that gives good leverage for measuring dust extinction, and is a strong indicator of the presence of a young population (young clusters form an age sequence in increasing ). Color maps for and are in Figures 2a and 2b. Young clusters (white) are the most apparent feature on the image, while reveals a large amount of dust (black), in addition to some unobscured clusters (white).
In Figures 3a and 3b we plot contours of pixel densities for versus from the 5 cuts of NGC 4038 and 4039, respectively. These pixels have not been dereddened. BC models are plotted in Figures 3a and 3b as thin and thick lines for the decay times of 100 Myr and 15 Gyr, respectively. Contours are for pixel densities of 10-70 pixels in steps of 20, with the dotted contours tracing the outer envelopes of the distributions of pixels. The contours for pixels from NGC 4038 are also plotted in Figure 3c, and ages are marked on the models in this figure in units of Gyr. Reddening vectors are plotted for of 1.0 in all panels of Figure 3.
We estimate the age of each pixel from the 5 cuts in Figures 3a and 3b by dereddening the pixels to have the same colors as the stellar population models, using the reddening law given by Cardelli, Clayton, Mathis (1989) with an of 3.1. We assume that the light in each pixel is dominated by a single stellar population and that the offset of a pixel from the model locus is due entirely to reddening. The age of the location on the stellar population model that the pixel dereddens to is assigned to the pixel, and the dereddening necessary to move the pixel to the model line is noted. The goal is to produce both age and reddening maps of the Antennae. By doing this analysis pixel-by-pixel, we not only analyze the populations found in star clusters (as in previous analyses), but we also find ages of diffuse light present in the images, where the contribution from clusters is variable.
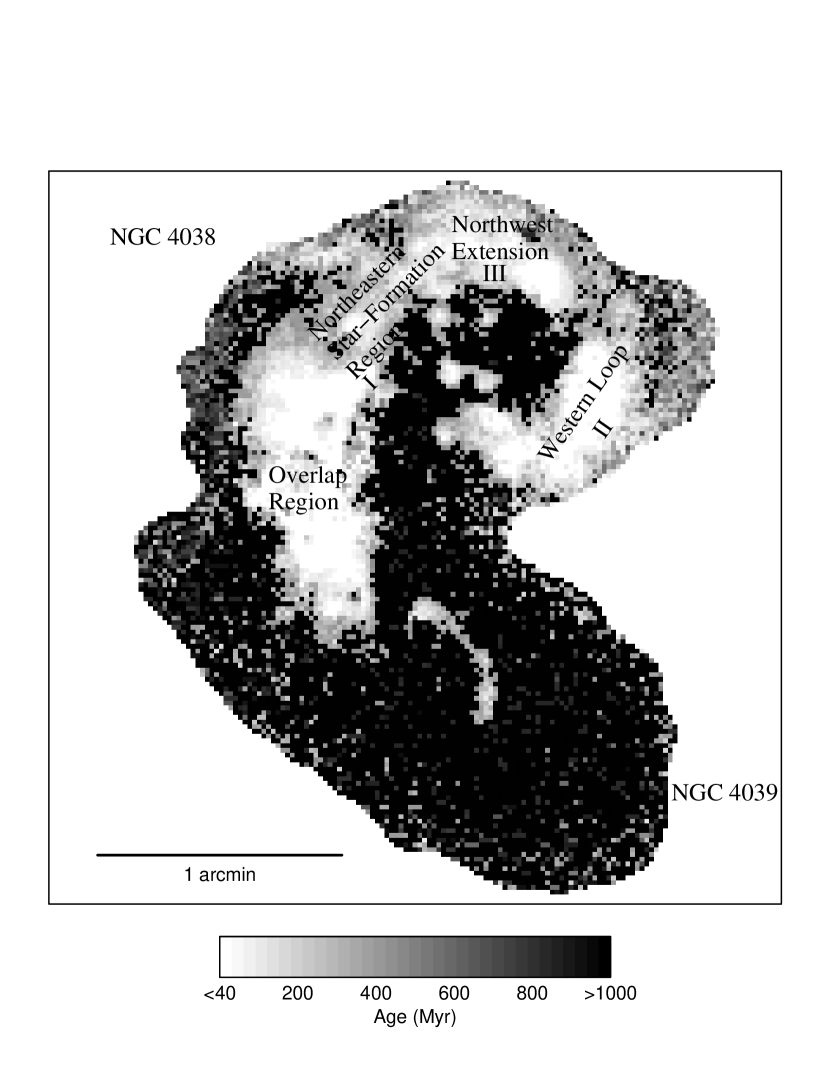
Figures 4a and 4b show histograms of the number of dereddened pixels with different ages for NGC 4038 and 4039, respectively, modeled with the = 15 Gyr model. Both histograms show a tall narrow peak at Gyr along with a smaller peak at a much younger age of less than one or two Gyr. We associate the pixels in the 15 Gyr peak with the old underlying disk and bulge populations of the galaxies and we take the younger peak to be evidence for a recent starburst population. Figure 5 is an image of the stellar ages in the Antennae, where pixels from the 15 Gyr peaks of Figures 4a and 4b are shaded black. We interpret these pixels as composing the older star-forming disks and bulges of the Antennae, and assign ages to them from the model with a decay time of 15 Gyr. These pixels follow the distribution of W99’s old globular clusters.
We model the remaining pixels (excluding the 15 Gyr pixels) with the =100 Myr model. Age histograms for these pixels are shown in Figures 4c and 4d for NGC 4038 and 4039, respectively. We are insensitive to ages Gyr, where reddening vectors are almost exactly parallel to the =100 Myr model. Reddening vectors are not parallel to the =100 Myr model for ages Gyr. Figure 4c shows 3 age peaks in NGC 4038: around 90, 300, and 600 Myr. Poissonian error bars are plotted for each bin in the histogram. These 3 peaks appear to be significant. When we examine where in the images the pixels in each peak lie, we find the following. Pixels from the first peak outline the young star clusters. Those from the second peak tend to be found near pixels from the first peak, and thus also outline the young star clusters. However, pixels from the third peak tend to be found toward the outer regions of NGC 4038’s spiral arm and some in the region of overlap between the two galaxies. Pixels from the youngest peak in NGC 4039 (Figure 4d) have a median age of 400 Myr. When we look for their location in the images, we find that they are primarily situated in the bulge and spiral arm, with a few pixels located along the outskirts of the disk. Those in the small peak at 800 Myr in NGC 4039 are most likely due to noise; these pixels are sparsely scattered along the faint outskirts of the disk of NGC 4039 and are most often isolated pixels. In Figure 5, pixels are shaded according to age, with the oldest ones shaded the darkest. Note that errors in photon counting statistics are about , and calibration errors are for B, for V, and for K. The typical color error bar plotted in Figure 3a implies an error in age that is approximately our bin size in the logarithmic age histograms in Figures 4c and 4d (0.1 dex).
Are the separate 90, 300, and 600 Myr peaks of Figure 4c and the 400 Myr peak of Figure 4d artifacts? If they are, then we would expect to detect random errors in the ages of these pixels, for example, finding young pixels in regions where we would expect to find intermediate-aged or old pixels. Since we observe age gradients in the 90 and 300 Myr pixels, which is a systematic trend, the pixels in these peaks cannot be due to random noise. A similar argument applies to pixels from the 400 Myr peak in Figure 4d and the 600 Myr peak in Figure 4c. The 400 and 600 Myr pixels are spatially separated from the other peaks and trace structure in NGC 4039 (spiral arm and bulge) and in NGC 4038 (outer part of the spiral arm), respectively. Finally, as we shall detail in , the ages of the peaks are consistent with previous observations.
We have thus far assumed that the dereddened colors in each pixel map onto a unique age in the single stellar population models. For those pixels that map onto an intermediate-age population (90, 300, and 600 Myr for NGC 4038, and 400 Myr for NGC 4039; Figures 4c and 4d), their colors might plausibly be due to a mix of young ( Myr) and old ( Gyr) stars. One way to address this issue is to use the properties of a linear color, or “flux-ratio,” diagram. Linear color diagrams were used to identify the components of composite stellar populations by Rabin (1981) and Frogel (1985). With the aid of a linear color diagram, we find that the colors of pixels in the Myr peak can only be due to an intermediate-age single stellar population; no reasonable combination of young and old stars with the models we have used here can produce such colors. In Figure 5, pixels from the Myr peak in NGC 4038’s histogram (Figure 4c) are shaded darker than those of the younger peaks. They are spatially distinct from the young ( Myr) population and are located in the outer parts of NGC 4038’s disk and the overlap region between the two galaxies. The Myr pixels trace the intermediate-aged ( Myr) clusters reported by W99. On the other hand, we find that pixels in the 90 and 300 Myr peaks of NGC 4038 and the 400 Myr peak of NGC 4039 can be due to a mixture of old and young starlight. These pixels tend to lie in regions surrounding the young clusters in Figure 5.
Unfortunately, with our data, stellar population models have little diagnostic power for ages younger than 40 Myr. We therefore take the pixels that do not deredden to the model line (i.e., those that deredden below the model line in Figures 3a and 3b) and assign ages to them of Myr. We call these “zero-age” pixels since the models have no diagnostic power below 40 Myr. On the age map in Figure 5 they compose the white regions and clearly trace the sites of the youngest clusters. These pixels are coincident with most of the Myr clusters in W99 and are found in regions with H emission. Another reason why these pixels deredden below the model line may be due to added contribution to the broadband flux by a gaseous emission component (see Charlot 1996 and references therein, Zackrisson et al. 2001, Anders Fritze-v. Alvensleben (2003), and Krüeger et al. 1995).
4 Morphology
4.1 Age and Extinction Maps
The luminosity-weighted age map of the Antennae in Figure 5 shows that large-scale morphological features correlate with age. The youngest pixels (those which do not deredden to the model line and which are shaded white) are found in the centers of clusters in the very dusty “Northeastern Star Formation Region” (Region I; ), the “Western Loop” (Region II; ), and the “Northwest Extension” (Region III; 1.5-2.5), using nomenclature from Figure 5a of W99. Our K- band image (Figure 1c) aids in the detection of this young population, especially in Region I, since its light can penetrate much of the dust present. Notice the many high surface brightness clusters in Region I, along with patches of dust in the image in Figure 2b. An age gradient is detected surrounding the star-forming clusters in the regions mentioned above, which may also be due to the mixing of light from the old disk population with a contribution from the zero-age clusters that decreases as pixels are located with increasing distance from the young clusters. This gradient is apparent in Figure 5 as the shading darkens with increasing distance from the centers of clusters. Current star-formation is also readily apparent in 4 small knots surrounding the nucleus of NGC 4038. Young pixels of ages Myr are found near their centers, and pixels with ages of up to Myr are found on the outskirts of the knots. Mengel et al. (2001) find knots near the 4038 nucleus to be Myr old from K-band spectra. The nucleus of NGC 4039 has an age of Myr at its center (Mengel et al. 2001 measure Myr for it from K-band spectra), knots in the arm emerging from the nucleus are about 80-90 Myr, and ages of about 100-400 Myr are found in the diffuse light surrounding the knots in the arm. These populations can also be explained as a combination of old and young populations. All these star-forming regions are apparent in both the B and the V-band images in Figures 1a and 1b and the color map in Figure 2a. W99 calculate ages of Myr for clusters in Region II, one third of clusters with ages Myr and two thirds with ages 30 Myr with “streaks” of recent star-formation in Region I, less than Myr for the young clusters in the “Overlap Region,” and “somewhat older” in the arm of NGC 4039 from a mix of GHRS spectroscopy, H, and UBVI colors from HST. The youngest pixels follow the H map in ZFW. ZFW find that the H flux is not followed by highly reddened young clusters, as expected, but is instead closely associated with Myr young bright clusters.
We detect a Myr intermediate-aged population in the diffuse light in an arc to the west of Region II, to the east of Region I, to the north of the “Northwest Extension,” to the south of the NGC 4038 nucleus, and on the east side of the “Overlap Region.” The Myr population appears to be a remnant of NGC 4038’s pre-encounter star-forming disk. W99 identify intermediate-age clusters ( Myr old), “with the most obvious members located in the ‘Western Loop’” (Region III). Our Myr old population follows these clusters. W99 comment that these clusters appear to have formed in a separate burst during a previous encounter of the two galaxies.
In Figure 5, the old Gyr underlying disk and bulge population of NGC 4038 and 4039 is shaded black. This population permeates the disk of NGC 4039 and is prominent only in the inner parts and outskirts of NGC 4038’s disk.
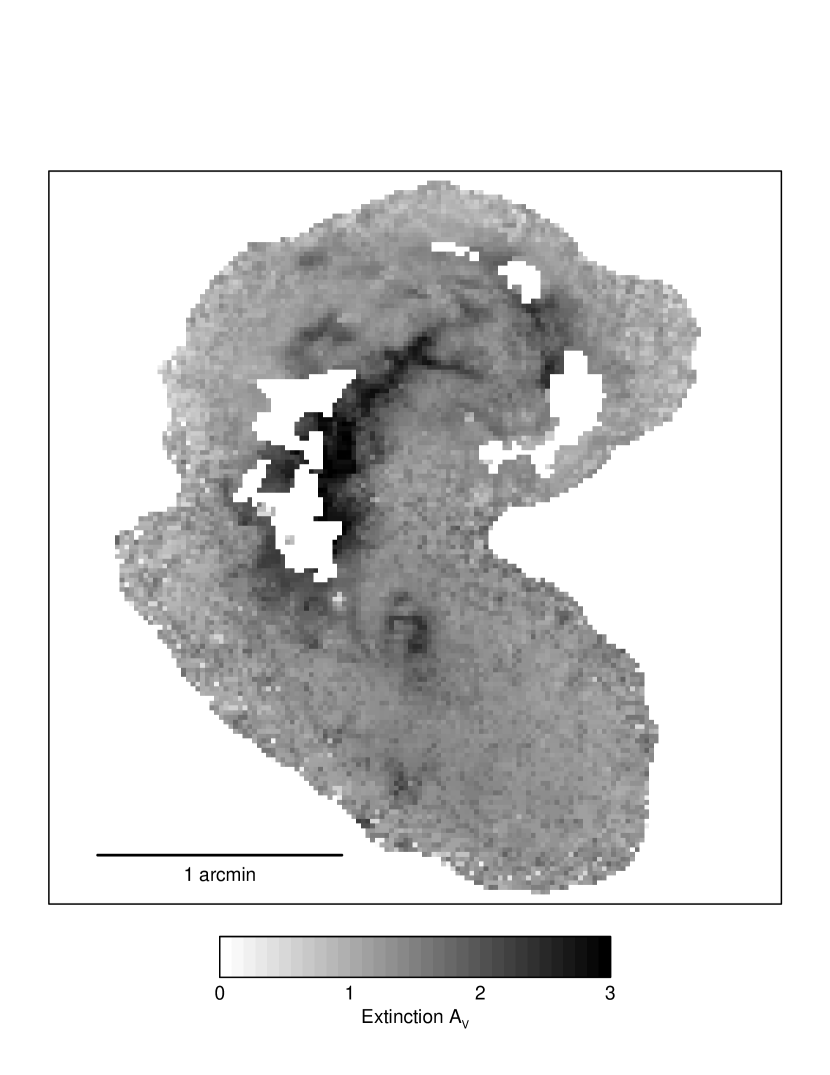
In Figure 6, we present an extinction map of the Antennae where areas shaded black represent the dustiest regions and have of . White areas demarcate the zero-age clusters that do not deredden to a model locus. There is a huge mass of dust apparent in the “Overlap Region” (). Dust clouds of varying thickness ( ) are detected throughout the disk of NGC 4038. The dust lane passing through the nucleus of NGC 4038 has . Most of the diffuse light in this disk has an of . The spread in for pixels from NGC 4038 is evidenced by the spread of pixels in in Figure 2b. NGC 4039’s nucleus and small spiral arm, each with an extinction of and , respectively, are quite dusty. The inner disk of NGC 4039 does not contain many dust clouds and has an of , similar to NGC 4038’s inner disk. This is well illustrated in Figure 2a where the pixels from NGC 4039 do not have as great of a spread in as those from NGC 4038.
A low-resolution CO map shows 3 major concentrations: the NGC 4038 nucleus, the “Overlap Region,” and the NGC 4039 nucleus (ZFW). A high-resolution CO map shows a more extended distribution in the “Overlap Region” and Region II (ZFW). ZFW also find that highly reddened young star clusters correlate well with molecular clouds. Most of the gas in the merger is found in the “Overlap Region,” along with more than half of all highly reddened clusters (ZFW). They also find bright young clusters to generally be near peaks of the CO emission. As seen in the age map in Figure 5, our youngest clusters do indeed come from these highly reddened regions. ZFW find that young bright clusters ( Myr) have a mean of , and that clusters with ages Myr (but still younger than the intermediate-age population) have a mean of . These values are consistent with our extinction map. We also find reddened clusters in the “Overlap Region” in our K-image which are not detected at B or V. In short, the far- and mid-infrared maps presented in ZFW resemble the CO maps, which in turn resemble the extinction map in Figure 6.
4.2 “Hidden” Clusters Present in the K-band
We have detected 5 objects on our K-band image for which we obtain only upper limits in the B and V-bands, and identify them as heavily reddened star clusters. Some have been previously studied with spectroscopy, as discussed below. Their locations are indicated with open circles on the B and K-band images in Figure 7, with clusters numbered from 1 to 5 on the K-band image in Figure 7a. All are located in the very dusty ( ) “Overlap Region” between the two galaxies. K-band magnitudes of these clusters were measured in a square aperture, 3 pixels (348) on a side, corresponding to parsecs. Given our seeing of 15 FWHM at K, these could in fact be multiple (2 or 3) clusters unresolved by our seeing, as it is well known that massive clusters in the Antennae are often clustered (ZWF). Upper limits () for B, V, , and are given in Table 1. The uncertainty in B, V, , and is 0.1, while the uncertainty in K is 0.06.
Clusters 2 and 5 have near-infrared magnitudes reported in the literature that are also listed in Table 1. Mengel et al. (2001) observed cluster 2, also known as cluster 80 from Whitmore Schweizer (1995), with integral field K-band spectroscopy. They derived a K-band magnitude from the spectroscopy in a 22 box (205 parsecs), and measured a V-band magnitude from W99’s V-band image in the same aperture. Gilbert et al. (2000) also imaged cluster 2 in the K-band, and quoted a V-band measurement from the HST image. They determined a half-light radius of parsecs and found that the cluster releases strong far-ultraviolet flux that excites the surrounding medium on scales of up to 200 parsecs. While the K-band measurements for cluster 2 from our measurements, Mengel et al. (2001), and Gilbert et al. (2000) are consistent considering the apertures used, V-band measurements differ between authors. Because of our modest seeing (), we do not directly detect cluster 2. Instead, we measure an upper limit of . This is consistent with Gilbert et al. (2000) who obtain V=23.5 (via a private communication with B.C. Whitmore Q. Zhang 1999 who measure it from the HST image). Mengel et al. (2001) measure V= for cluster 2, which is not consistent with either our measurement or that of Gilbert et al. (2000). Cluster 5 is resolved into at least 2 separate clusters on the W99 image, cluster 355 from Whitmore Schweizer (1995) and cluster 15 from W99. These 2 parts were observed by Mengel et al. (2002), and they give magnitudes for V and Kshort in a 174 radius. In Table 1 we sum Mengel et al. (2002)’s measurements for these 2 clusters. Our measurements of this cluster most likely differ from Mengel et al. (2002) because of a combination of factors. Namely, the seeing on our image is large, we use a different aperture than Mengel et al. (2002), and we calculate sky counts locally, in an area which could be contaminated by light from neighboring clusters. In addition, Mengel et al. (2002) noted (see the “Comments” column in Table 1 of their paper), that there were difficulties keeping both targets in the slit during integrations.
Mengel et al. (2001) derive an for cluster 2 of 4.3 from the flux ratio of Br/H. Gilbert et al. (2000) estimate the screen extinction to the cluster to be . The extinction values found from these higher resolution observations are larger than those determined from our data since, with a higher resolution, one can see in between dust features which are smoothed over in our images.
5 Conclusions
With simple modeling, we have mapped the distributions of stellar populations and dust in the Antennae, and derived the star-formation history of the encounter between NGC 4038 and 4039. This was done with a pixel-by-pixel analysis of modest-seeing (15) ground-based images.
We detected two epochs of star-formation that presumably resulted from the two most recent close encounters of the galaxies. In brighter regions, where we do not expect a significant contribution from an underlying older ( Gyr) population, we discerned a very young, essentially zero-age burst. We called it “zero-age” because we have no diagnostic power with single stellar population models for very young populations where, below 40 Myr, colors are degenerate with reddening for our data. Pixels of “zero-age” correspond to the brightest blue star-forming regions associated with the HII regions seen by W99. An intermediate-aged ( Myr) population was found to lie in the outer regions of NGC 4038’s spiral arm; it is the same population as the one detected in W99’s HST study. Populations with ages between about 40 and 500 Myr can be explained as either single or composite populations, depending on assumptions about reddening. These populations outline young star-forming regions in the Antennae. The intermediate-age ( Myr) population most likely formed in a burst during the first encounter between the two galaxies which resulted in the tidal tails. Current star-formation in the Antennae appears to be confined to locations where there was previous star-formation activity, as evidenced by the location of the intermediate-aged population, along the NGC 4038 spiral arm. In addition to the young and intermediate-aged populations, we detected an old star-forming disk population of Gyr which traces the disk of NGC 4039 and the inner disk and bulge of NGC 4038.
Based on de Vaucouleurs et al. (1991)’s classification of NGC 4038 as an SB(s)mpec and NGC 4039 as an SA(s)mpec, we suggest that NGC 4038 was probably a gas-rich Sb/Sc galaxy before the encounter, while NGC 4039 was probably a relatively gas-poor Sa. The encounter between the two that occurred about 600 Myr ago could have consumed most of the gas in NGC 4039. Thus, within this galaxy we found very few “zero-age” clusters. NGC 4038, being of later type, still retained a significant amount of its copious gas content after the first encounter. It is this gas that is responsible for the current “zero-age” burst of star-formation and that gives NGC 4038 its dramatic appearance. We infer that the product of a merger between an Sa and an Sc galaxy, especially if observed at a higher redshift, would probably resemble a disturbed Sc galaxy if viewed in a rest-frame optical band at a similar stage in a merger sequence as the Antennae. This is due to the prominence of star-formation in the disk of NGC 4038, compared to activity elsewhere in the merger, and to the low surface brightness of other features such as tidal tails and the meager amount of star-formation in NGC 4039.
Our extinction map delineates where dust accumulates in the merger. While there is a large dust cloud where the two galaxies overlap, much less extinction is detected over most of the galaxies’ disks. This is expected, since in a merger interstellar gas and dust are destabilized and fall toward the central potential well. In addition to reddening, our K-band image allows us to find buried star-formation regions that are not detected in our B or V-band images, clearly showing the value of near-infrared imaging of dusty mergers.
The success of the pixel by pixel analysis when applied to a complex system such as the Antennae suggests that this simple method could be used to study the stellar content and star-formation histories of galaxies for which comparably detailed HST imagery is not available. The key is to have the rest-frame H or K-band in addition to rest-frame visible colors to create a long baseline in wavelength that reaches to the near-infrared. This baseline is needed to gain leverage with the dust content and thus be able to do the population analysis, and, at least in this case, to reveal a few surprises (i.e., the buried clusters).
References
- Abraham Merrifield (2000) Abraham, R. G. Merrifield, M. R. 2000, AJ, 120, 2835
- Anders Fritze-v. Alvensleben (2003) Anders, P. Fritze-v. Alvensleben, U. 2003, A&A, 401, 1063
- Bruzual Charlot (1993) Bruzual, A. G., Charlot, S. 1993, ApJ, 405, 538 (BC)
- Cardelli, Clayton, Mathis (1989) Cardelli, J. A., Clayton, G. C., Mathis, J. S. 1989, ApJ, 345, 245
- Carter Meadows (1995) Carter, B. S., Meadows, V. S. 1995, MNRAS, 276, 734
- Charlot (1996) Charlot, S. 1996, in From Stars to Galaxies: The Impact of Stellar Physics on Galaxy Evolution, ed. C. Leitherer, U. Fritze-von-Alvensleben, J. Huchra (San Francisco:ASP), 275
- de Grijs et al. (2003) de Grijs, R.; Lee, J. T.; Clemencia Mora Herrera, M., Fritze-v. Alvensleben, U, Anders, P. 2003 New Astron., 8, 155
- de Vaucouleurs et al. (1991) de Vaucouleurs, G., de Vaucouleurs, A., Corwin, H. G., Jr., Buta, R. J., Paturel, G., Fouque, P. 1991, The Third Reference Catalogue of Bright Galaxies (New York: Springer-Verlag)
- Elias et al. (1982) Elias, J. H., Frogel, J. A., Matthews, K., Neugebauer, G. 1982, AJ, 87, 1029
- Eskridge et al. (2003) Eskridge, P. B., Frogel, J. A., Taylor, V. A., Windhorst, R. A., Odewahn, S. C., Chiarenza, C. A. T. C., Conselice, C. J., de Grijs, R., Matthews, L. D., O’Connell, R. W., Gallagher, J. S., III 2003, ApJ, 586, 923
- Frogel (1985) Frogel, J. A. 1985, ApJ, 298, 528
- Gilbert et al. (2000) Gilbert, A., M., Graham, J., R., McLean, I., S., Becklin, E., E., Figer, D., F., Larkin, J., E., Levenson, N., A., Teplitz, H., I., Wilcox, M., K. 2000, ApJ, 533, L57
- Holtzman, J. A. et al. (1992) Holtzman et al. 1992, AJ, 103, 691
- Kennicutt (1998) Kennicutt, R. C., Schweizer, F., Barnes, J. E. 1998, Galaxies: Interactions and Induced Star Formation, Saas-Fee Advanced Course 26 ed. D. Friedli, L. Martinet, D. Pfenniger (Berlin:Springer)
- Kong et al. (2000) Kong, X. et al. 2000, AJ, 119, 2745
- Krüeger et al. (1995) Krüeger, H., Fritze-v. Alvensleben, U., Loose, H.-H. 1995, A&A, 303, 41
- Landolt (1992) Landolt, A. U. 1992, AJ, 104, 340
- Martin Whittet (1990) Martin, P. G. Whittet, D. C. B. 1990, ApJ, 357, 113
- Mengel et al. (2001) Mengel, S., Lehnert, M., D., Thatte, N., Tacconi-Garman, L., E., Genzel, R. 2001, ApJ, 550, 280
- Mengel et al. (2002) Mengel, S., Lehnert, M. D., Thatte, N., Genzel, R. 2002, A&A, 383, 137
- Mihos, Bothun, Richstone (1993) Mihos, J. C., Bothun, G. D., Richstone, D. O. 1993, ApJ, 418, 82
- Rabin (1981) Rabin, D. M. 1981, Ph.D. thesis, California Institute of Technology
- Sanders Mirabel (1996) Sanders, D. B. Mirabel, I. F. 1996, ARA&A, 34, 749
- Whitmore Schweizer (1995) Whitmore, B. C. Schweizer, F. 1995, AJ, 109, 960
- Whitmore et al. (1999) Whitmore, B. C., Zhang, Q., Leitherer, C., Fall, S. M., Schweizer, F., Miller, B. W. 1999 AJ, 118, 1551 (W99)
- Zackrisson et al. (2001) Zackrisson, E., Bergvall, N., Olofsson, K., Siebert, A. 2001, A&A, 375, 814
- Zhang, Fall, Whitmore (2001) Zhang, Q., Fall, S. M., Whitmore, B. C. 2001 ApJ, 561, 727 (ZFW)
- Zwicky (1957) Zwicky, F. 1957, Morphological Astronomy (Berlin: Springer)


| This paperaaMeasured in a 348 box. Uncertainties are 0.1, for B, V, , and . K has an uncertainty of 0.06. | Gilbert et al. | Mengel et al. | |||||||||
|---|---|---|---|---|---|---|---|---|---|---|---|
| cluster | B | V | K | V | K | V | K | ||||
| 1 | 16.33 | ||||||||||
| 2 | 14.85 | 23.5bbThe half-light radius is measured to be 32 parsecs. The color is calculated from the HST V-band image. | 14.6bbThe half-light radius is measured to be 32 parsecs. The color is calculated from the HST V-band image. | 8.9bbThe half-light radius is measured to be 32 parsecs. The color is calculated from the HST V-band image. | 18.8ccFrom Mengel et al. (2001). Measured in a 22 box. K-band is measured from spectroscopy; V-band is from W99 image. | 14.8ccFrom Mengel et al. (2001). Measured in a 22 box. K-band is measured from spectroscopy; V-band is from W99 image. | 4.0ccFrom Mengel et al. (2001). Measured in a 22 box. K-band is measured from spectroscopy; V-band is from W99 image. | ||||
| 3 | 14.94 | ||||||||||
| 4 | 16.04 | ||||||||||
| 5 | 15.60 | 19.31ddFrom Mengel et al. (2002). The sum of measurements of cluster 15 from W99 and 355 from Whitmore Schweizer (1995), each measured in a 174 radius. K is Kshort, and the V-band is measured from the W99 image. | 15.04ddFrom Mengel et al. (2002). The sum of measurements of cluster 15 from W99 and 355 from Whitmore Schweizer (1995), each measured in a 174 radius. K is Kshort, and the V-band is measured from the W99 image. | 4.27ddFrom Mengel et al. (2002). The sum of measurements of cluster 15 from W99 and 355 from Whitmore Schweizer (1995), each measured in a 174 radius. K is Kshort, and the V-band is measured from the W99 image. | |||||||