Detection of Magnesium-Rich Ejecta in the Middle-Aged Supernova Remnant N49B
Abstract
The middle-aged supernova remnant (SNR) N49B in the Large Magellanic Cloud has been observed with the Chandra X-Ray Observatory. The superb angular resolution of Chandra resolves the complex structure of X-ray emitting filaments across the SNR. All observed features are soft ( 3 keV) and we find no evidence for either point-like or extended hard emission within the SNR. Spectral lines from O, Ne, Mg, Si, S, and Fe are present. Equivalent width images for the detected elemental species and spatially-resolved spectral analysis reveal the presence of Mg-rich ejecta within the SNR. We find no such enrichment in O or Ne, which may reflect details of the nucleosynthesis process or the heating and cooling of the ejecta as it evolved. The bright circumferential filaments are emission from the shocked dense interstellar medium (ISM). We detect faint diffuse X-ray emission that extends beyond the X-ray bright filaments toward the west and southeast. These features appear to be the blast wave shock front expanding into lower density portions of the ISM seen in projection. We set an upper limit of ergs s-1 on the 0.5 5 keV band X-ray luminosity of any embedded compact object.
1 INTRODUCTION
N49B (052566.0) is a supernova remnant (SNR) in the Large Magellanic Cloud (LMC), which is located 65 northwest of N49, another bright LMC SNR (Milne, 1972). In the optical band, N49B consists of two irregular-shaped knots, separated by 14 (Mathewson et al., 1983); spatially variable extinction is present around this SNR. The Einstein/HRI and ROSAT/HRI data revealed a nearly circular X-ray morphology encompassing the optical knots (Mathewson et al., 1983; Williams et al., 1999). Radio data also showed a circular morphology and a steep radio spectral index ( 0.7 where ), typical for shell-type SNRs (Dickel & Milne, 1998). Chu & Kennicutt (1988) suggested a Population I progenitor for N49B based on its proximity to the HII region DEM 181 and a possible association with a molecular cloud (Cohen et al., 1988).
The ASCA spectrum of N49B was described with a nonequilibrium ionization (NEI) Sedov model with kT 0.4 keV (Hughes et al., 1998). The fitted metal abundances were consistent with the LMC interstellar medium (ISM), although there was evidence for a slightly enhanced Mg abundance. The measured X-ray absorbing column (2.5 1021 cm-2) was in agreement with the HI column toward N49B ( cm-2) (Heiles & Cleary, 1979; McGee & Milton, 1966). This relatively high column, as compared with other LMC SNRs, supports N49B’s physical association with a moderately dense ISM ( 0.8 cm-3 and swept-up mass of 560 ; Hughes et al. [1998]). A discrepancy between the ionization and dynamical ages (3 kyr vs. 10 kyr) was attributed to the SN explosion having occurred in a pre-existing interstellar cavity (Hughes et al., 1998). Einstein and ROSAT images revealed the broadband X-ray structure of N49B down to 5′′ angular scales. ASCA data provided an integrated spectrum, but to date spatially-resolved spectroscopy has been impossible because of the poor angular resolution of ASCA and the small angular size of N49B. The superb angular resolution of the Chandra X-Ray Observatory allows us to resolve the complex structure of N49B with good photon statistics and spectral resolution. Here we report results from high resolution image and spatially-resolved spectral analyses of the Chandra observation of N49B.
2 OBSERVATION & DATA REDUCTION
N49B was observed with the Advanced CCD Imaging Spectrometer (ACIS) on board Chandra on 2001 September 15 as part of the Guaranteed Time Observation program. The ACIS-S3 chip was chosen to utilize the best sensitivity and energy resolution of the detector in the soft X-ray band. The pointing was toward the X-ray centroid of N49B (2000 = 05h 25m 26s.04, 2000 = 65∘ 59′ 069) with the aim point shifted by 245 detector pixels (2′) from the nominal aim point on S3 in order to simultaneously observe the nearby LMC SNR N49 on the same CCD chip as well. Results from the analysis of the N49 data are presented elsewhere (Park et al., 2003).
We utilized the data reduction techniques developed by Townsley et al. (2002a) for correcting the spatial and spectral degradation of the ACIS data caused by radiation damage, the charge transfer inefficiency (CTI; Townsley et al. 2000). We screened the data with the flight timeline filter and then applied the CTI correction before further standard screening by status and grade. There is no significant photon flux from N49B at 3 keV (above background), thus we only use X-rays with 3 keV in the subsequent analysis. The overall lightcurve was examined for possible contamination from time-variable background. The background flux is relatively high (by a factor of 2) for the last 10% of the exposure. We have excluded the 4 ks time interval affected by this flare. This data reduction results in effective exposure of 30.2 ks which yields 143,000 photons in the 0.33 keV band from the SNR within a 14 radius region.
3 X-RAY IMAGES
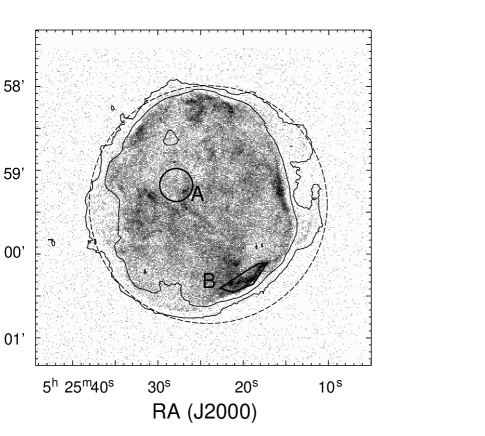
Figure 1 is the broadband ACIS image of N49B. The ACIS image reveals X-ray filamentary structures down to subarcsec angular scales. The outermost and faintest X-ray emission traces a roughly circular boundary (14 radius). The brightest parts of the circumferential filaments (notably along the southwest, west, north, and northeast) appear to be flattened. The surface brightness of the complex filamentary structures in the middle of the eastern side is nearly as high as at the bright rims. Elsewhere in the interior the emission is more than an order of magnitude fainter than at the rim. The faint radio shell that extends toward the west (Dickel & Milne, 1998), which has not been seen in previous X-ray observations, is detected beyond the bright X-ray filament in the west (Figure 1). This X-ray “double-shell” structure in the west, as well as the faint outermost “plateau” of emission toward the southeast, may be projection effects of the shock propagating into low density regions of the ISM, with the bright filaments corresponding to regions where dense ISM has been encountered (more discussion in §5).
The surface brightness distribution of N49B is dominated by X-ray emission below 3 keV and we find no evidence for an embedded hard point source or diffuse synchrotron nebula. We do detect spectral variations across the SNR: emission from the northeast is softer with a larger relative flux at 0.8 keV, while emission in the central-to-west regions is harder (enhanced at 1.1 3.0 keV). These variations in the broadband X-ray fluxes appear to imply variations in the absorbing column and/or local enhancements of line emission, especially from Mg and Si. To quantify the column density variations, we compare the spectra of numerous small angular regions to the SNR’s total spectrum, following the method described in Warren et al. (2003). The average column density measured by ASCA over the entire SNR is = 2.5 1021 cm-2 (Hughes et al., 1998). Spectra from the bright northern limb indicate column densities lower than the average by cm-2. Spectra from the southwest suggest columns higher than the average by up to cm-2. This means a factor of 4 variation of the absorbing column across N49B.
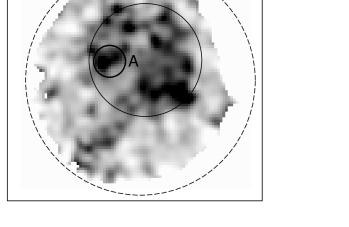
We explore the angular distributions of the line emission by constructing equivalent width (EW) images for the detected elemental species, following the method by Park et al. (2002). EW images for O, Ne, and Mg were generated by selecting photons around the broad line features. The O and Ne EW images are featureless, which indicates the absence of any local enhancements of O/Ne line emission. The Mg EW image, on the other hand, reveals significant enhancements near the center of the SNR (Figure 2), establishing that the hard enhancements in the central-to-western regions of the SNR are caused by enhanced Mg line emission. The Mg EW distribution suggests substantial variations in the metal abundances and/or temperature/ionization between the center and periphery of the SNR. The bright circumferential X-ray filaments are featureless in all EW maps indicating that there is little azimuthal variation of abundance and/or thermodynamic state around the rim.
4 X-ray Spectra
In order to investigate the origin of the line enhancements, we extracted spectra from a small region where the Mg EW is high (region A in Figures 1 and 2), and a bright X-ray filament (region B; Figure 1). The extracted source spectra (Figure 3) contain 3700 (region A) and 7300 (region B) photons in the 0.4 3.0 keV band. Both spectra were binned to contain a minimum of 20 counts per channel. For the spectral analysis of our CTI corrected data, we used the response matrices appropriate for the spectral redistribution of the CCD (Townsley et al. 2002b, ). The low energy ( 1 keV) quantum efficiency (QE) of the ACIS has degraded with time due to accumulating molecular contamination on the optical blocking filter. We have corrected the time-dependent QE degradation by modifying the ancillary response function for the extracted spectrum using the ACISABS software (Chartas et al., 2003).
We fit the spectra with an NEI plane-parallel shock model (Borkowski et al., 2001). Elemental abundances were fixed for He (0.89), C (0.30), N (0.12), Ca (0.34) and Ni (0.62) at the LMC values (Russell & Dopita, 1992) (hereafter, all abundances are with respect to solar; Anders & Grevesse [1989]) since our data do not constrain the contribution from these species. Other elemental abundances were allowed to vary freely. The region A spectrum reveals a remarkably strong Mg line with a best-fit abundance of 1.7. This is more than 5 times higher than the LMC abundance. Si is also overabundant (1.4 or 5 times the LMC abundance). O, Ne, and Fe are best fitted with LMC-like abundances. In contrast to region A, the region B spectrum is best fitted with the LMC abundances for O, Ne, and Mg (Table 1). Other bright circumferential filaments show similar spectral features and derived abundances to region B.These indicate that the X-ray bright filaments are dominated by emission from the shocked ISM. We thus confirm that the EW distributions are primarily caused by abundance variations.
The use of a single plane shock model to describe region A is oversimplistic, since this position contains emission from shock-heated swept-up ISM integrated through the depth of the SNR, besides a possible ejecta component. Although the single-temperature plane shock model indicates a high Mg abundance as the primary cause of the strong Mg line, we also test whether higher temperature plasma in the SNR interior could be the source of the strong Mg line. For this purpose, we use a Sedov model, which provides a physically motivated temperature distribution, to fit the region A spectrum. Even these fits, however, require a high Mg abundance (1.4) and LMC-like abundances for O and Ne (0.2). We finally employ a two-component model consisting of a Sedov component to account for the shocked ISM and a plane shock component to describe the metal-rich ejecta. We set the Sedov model parameters to those previously obtained by ASCA (Hughes et al., 1998), since they are consistent with our own Sedov fit results, and fix abundances at LMC values. Fits with no constraint on the model normalizations result in a negligible contribution from the Sedov model, i.e., the single-temperature plane shock model (with enhanced Mg) is the preferred model. Even if we force each component to contribute equally to the observed emission, the high Mg abundance (with low O and Ne) persist in the ejecta component. In all cases, the best-fit temperatures are keV. The Mg to O abundance ratio (by number) for region A is 0.19 for the single plane shock and 0.44 for the two component (plane shock and Sedov) model. Compared to the LMC and solar abundance ratio of Mg/O 0.05, these support a significant overabundance of Mg in the interior of N49B.
5 DISCUSSION
The overabundant Mg and Si in the center of N49B suggest the presence of SN ejecta within the SNR’s interior. It is remarkable that metal-rich ejecta can still be significant and observable in an aged SNR (104 yr, Hughes et al. [1998]). N49B thus joins a growing number of middle-aged SNRs showing evidence for ejecta (e.g., Hughes et al. 2003). Mg is produced in astrophysical sites such as hydrostatic C and Ne burning, explosive C/Ne-burning during core-collapse SNe (Thielemann et al., 1996), and thermonuclear (Type Ia) SNe (Iwamoto et al., 1999). In nucleosynthesis models, though, Mg is accompanied by other elemental species with O invariably being produced in greater quantities. The presence of ejecta rich in Mg, but not in O/Ne, is thus surprising. It is possible that particular heating or cooling effects have produced a thermal/ionization state in which O/Ne line emission is suppressed relative to Mg, but a full investigation of such plasma conditions is beyond the scope of this paper. We note that N49B is not classified as an O-rich SNR in the optical band, nor have there been any reports of ejecta in this SNR prior to this work.
We estimate the total mass of Mg in N49B by determining the density from spectral fits of region A and then applying it to the entire volume of the Mg-rich region. For region A, we assume emission from a spherical volume = 3 1057 cm where is the X-ray volume filling factor and is the distance to the SNR in units of 50 kpc. Using the best-fit volume emission measure () and Mg abundance (Table 1), we find 0.07 cm-3 under the assumption that the bulk of the electrons are from Mg (i.e., a pure Mg ejecta) where 10 for the mean charge state of Mg implied by the measured temperature and ionization timescale. Assuming a spherical volume with a radius of 07 (large solid circle in Figure 2) for the entire enhanced Mg emission region, we find a total Mg ejecta mass of 18 which is a conservative upper limit. For the case where the electrons are primarily from H/He, this becomes 0.5 . There is some uncertainty associated with extrapolating the density obtained from within a small area directly to the larger area of the metal-rich ejecta. The broadband surface brightness of the Mg-enhanced region is however relatively uniform, indicating a modest variations over the larger area. Our simple extrapolation thus provides a reasonable, although crude, estimate of the plasma density. The large mass of Mg we derive, even with the large uncertainties, strongly suggest a core-collapse SN from a massive progenitor ( 25 ) (Thielemann et al., 1996).
The bright filaments along the periphery of the SNR are not evident in the EW maps, and their spectra can be fitted with LMC abundances. These filaments also appear to be compressed, and have little faint X-ray emission beyond them (except notably for the western side). These bright features most likely represent interactions of the blast wave with dense portions of the ISM. Because of the ambiguous geometry for these thin filaments, estimates of the electron density for these regions are difficult. We assume a slab-like cylindrical geometry for the emitting volume for region B. For the apparent angular size of 30′′ 8′′, and a line-of-sight path-length of 3 pc comparable to an angular scale of 15′′ at = 50 kpc, we obtain 1 1057 cm3 (for 1), and 15 cm-3 for this filament. The derived X-ray emitting mass is 8. Considerable mass has thus been encountered along the filamentary regions.
We detect a faint shell-like feature extending beyond the bright X-ray filament on the western side of N49B. This feature has a fairly large angular size (15 05) with soft emission, and is spatially coincident with the radio shell on the west. These morphologies suggest that this feature is the blast wave shock front propagating into less dense portions of the ISM, whereas the bright X-ray filaments are emission from the shock encountering denser ISM. This may also be the case in the south-east as shown by the faint diffuse X-ray emission beyond the bright X-ray knots. These “superpositions” of bright and faint features appear to be projection effects of the blast wave expanding into a cloudy ISM. The presence of bright optical knots corresponding to the bright X-ray filaments in the southwest and in the middle of the eastern side supports this hypothesis. We can get an estimate of the ambient density contrast by comparing the surface brightness of the X-ray faint and bright features. Assuming similar spectra and line-of-sight depths for these regions, the surface brightness ratio implies the ratio of electron density squared. We compare the bright X-ray filament on the western side of the SNR to the faint X-ray shell just ahead of it, where the surface brightness ratio is 15. The bright filament has 5 cm-3 (derived by actual spectral fitting), which implies 0.7 cm-3 for the faint X-ray shell. This latter value is consistent with previous estimates of the average preshock density around N49B (Hughes et al., 1998). The blast wave thus appears to be expanding into an ambient ISM with local density variations of an order of magnitude.
N49B appears to lie in projection near an HII region suggesting a core-collapse SN. However, we find no apparent evidence for the associated neutron star or its wind nebula. The radio data also showed no compact source or strong polarization within N49B (Dickel & Milne, 1998). We estimate a flux limit for an embedded point source. We convolved a point source, assuming a power law spectrum and various fluxes, with the ACIS-S3 point spread function. Each simulated point source was then added to the central 30′′ 30′′ observed region of N49B. A 3 detection limit is then 30 counts, corresponding to an X-ray luminosity of 2 1033 ergs s-1 (0.5 5 keV). This limit does not conclusively rule out the presence of an embedded neutron star in N49B, since some Galactic spin-powered pulsars have 1033 ergs s-1 (e.g., Becker & Trümper 2002).
References
- Anders & Grevesse (1989) Anders, E., & Grevesse, N. 1989, Geochimica et Cosmochimica Acta, 53, 197
- (2) Becker, A., & Aschenbach, B. 2002, “Neutron Stars, Pulsars, and Supernova Remnants”, Physikzentrum Bad Honnef, Germany, eds, W. Becker, H. Lesch, & J. Trümper, MPE Report 278, 64 (astro-ph/0208466)
- Borkowski et al. (2001) Borkowski, K. J., Lyerly, W. J., & Reynolds, S. P. 2001, ApJ, 548, 820
- Chartas et al. (2003) Chartas, G. et al. 2003, in preparation (also Chandra Contributed Software: http://asc.harvard.edu/cont-soft/software/ACISABS.1.1.html).
- Chu & Kennicutt (1988) Chu, Y.-H. & Kennicutt, R. C. 1988, AJ, 96, 1874
- Cohen et al. (1988) Cohen, R. S., Dame, T. M., Garay, G. et al. 1988, ApJ, 331, L95
- Dickel & Milne (1998) Dickel, J. R., & Milne, D. K., 1998, AJ, 115, 1057
- Heiles & Cleary (1979) Heiles, C., & Cleary, M. N., 1979, Australian J. Phys. Astrophys. Suppl., 47, 1
- Hughes et al. (1998) Hughes, J. P., Hayashi, I., & Koyama, K. 1998, ApJ, 505, 732
- Hughes et al. (2003) Hughes, J. P., Ghavamian, P., Rakowski, C. E. et al. 2003, ApJ, 582, L95
- Iwamoto et al. (1999) Iwamoto, K. Brachwitz, F., Nomoto, K. et al. 1999, ApJS, 125, 439
- Mathewson et al. (1983) Mathewson, D. S., Ford, V. L., Dopita, M. A. et al. 1983, ApJS, 51, 345
- McGee & Milton (1966) McGee, R. X., & Milton, J. A., 1966, Australian J. Phys., 19, 343
- Milne (1972) Milne, D. K. 1972, ApL, 11, 167
- Park et al. (2002) Park, S., Roming, P. W. A., Hughes, J. P. et al. 2002, ApJ, 564, L39
- Park et al. (2003) Park, S. Burrows, D. N., Garmire, G. P. et al. 2003, ApJ, 586, 210
- Russell & Dopita (1992) Russell, S. C., & Dopita, M. A., 1992, ApJ, 384, 508
- Thielemann et al. (1996) Thielemann, F.-K, Nomoto, K., & Hashimoto, M.-A. 1996, ApJ, 460, 408
- Townsley et al. (2000) Townsley, L. K., Broos, P. S., Garmire, G. P. et al. 2000, ApJ, 534, L139
- (20) Townsley, L. K. et al. 2002a, NIMPA, 486, 751
- (21) Townsley, L. K. et al. 2002b, NIMPA, 486, 716
- Warren et al. (2003) Warren, J. S., Hughes, J. P., & Slane, P. O. 2003, ApJ, 583, 260
- Williams et al. (1999) Williams, R. M., Chu, Y.-H., Dickel, J. R. et al. 1999, ApJS, 123, 467
| Region | O | Ne | Mg | Si | Fe | bbVolume emission measure in units of 1058 cm-3, = . | / | |||
|---|---|---|---|---|---|---|---|---|---|---|
| (1021 cm-2) | (keV) | (1011 cm-3 s) | ||||||||
| A | 2.3 | 0.36 | 4.5 | 0.41 | 0.37 | 1.73 | 1.44 | 0.20 | 2.9 | 43.3/58 |
| B | 3.3 | 0.34 | 11.2 | 0.33 | 0.34 | 0.28 | 0.42 | 0.15 | 14.7 | 47.1/75 |