Delayed soft X-ray emission lines in the afterglow of GRB 030227
Abstract
Strong, delayed X-ray line emission is detected in the afterglow of GRB 030227, appearing near the end of the XMM-Newton observation, nearly twenty hours after the burst. The observed flux in the lines, not simply the equivalent width, sharply increases from an undetectable level ( erg cm-2 s-1, ) to erg cm-2 s-1 in the final 9.7 ks. The line emission alone has nearly twice as many detected photons as any previous detection of X-ray lines. The lines correspond well to hydrogen and/or helium-like emission from Mg, Si, S, Ar and Ca at a redshift . There is no evidence for Fe, Co or Ni—the ultimate iron abundance must be less than a tenth that of the lighter metals. If the supernova and GRB events are nearly simultaneous there must be continuing, sporadic power output after the GRB of a luminosity erg s-1, exceeding all but the most powerful quasars.
1 Introduction
Analysis of the afterglows of long-duration -ray bursts (GRBs) have finally shown their progenitors to be massive stars (Reeves et al., 2002; Paczynski, 1998; Galama et al., 1998), with a catastrophic endpoint that seems to produce both a GRB and a supernova (Bloom et al., 1999; Hjorth et al., 2003; Stanek et al., 2003). Rapid follow-up observations of GRBs at X-ray wavelengths have provided spectra of the afterglows showing very high luminosity line emission. Initially single, emission lines believed to be Fe (Antonelli et al., 2000; Piro et al., 1998, 2000; Yoshida et al., 2001) or Ni (Watson et al., 2002a) were reported and more recently transient multiple emission lines from highly-ionised Si, S, Ar, Ca and possibly Mg and Ni (Reeves et al., 2002). A careful analysis of the Chandra HETG grating spectra of the afterglow of GRB 020813 has indicated the presence of highly-ionized states of similar low-Z metals, in particular S and Si at much lower equivalent widths than those observed in GRB 011211 (Butler et al., 2003). Detection of soft X-ray lines is critical since they require such high energies to produce them while at the same time allowing fairly unhindered access to the GRB and its remnant with an accuracy unachievable in hard X- and -rays.
2 Observations and data reduction
XMM-Newton (Jansen et al., 2001) began observing the error-box of GRB 030227 eight hours after the burst (for thirteen hours) and for the first time a GRB detected by INTEGRAL (Parmar et al., 2003) was localized to within a few arcseconds (Loiseau et al., 2003). Three exposures were made with the EPIC cameras, the first two interrupted by high background events. The effective time of the first exposure was less than 1 ks for each EPIC camera and is contaminated by high particle background, it was therefore not considered for spectral analysis. The second exposure spanned 3.6 ks for the EPIC-MOS cameras and 7.2 ks for the EPIC-pn and also suffered from a relatively high background rate. The third exposure spanned 32.4 ks for the MOS cameras and 30.9 ks for the pn. The background rate for this exposure decreased to a low level after a few thousand seconds. Data from the MOS and pn cameras are consistent allowing for cross-calibration uncertainties of ¡ 15% between the instruments. Because of the extra free parameters introduced by allowing for systematic differences between instruments and the much greater sensitivity of the EPIC-pn detector the pn data were used for spectral fitting. The final fit results were then checked against the MOS data and found to be consistent.
The data were divided into four time segments to examine spectral evolution. The first segment corresponded to the second exposure, the remaining three comprising consecutive 10 ks, 10 ks and 10.9 ks parts of the third exposure, giving effective exposure times of 5.7 ks, 8.7 ks, 9.0 ks and 9.7 ks respectively. The data reduction followed a standard procedure similar to that outlined in Watson et al. (2002b) except that the data were processed and reduced with the XMM-Newton Science Analysis Software version 5.4.1. A spectral binning using a minimum of 20 counts per bin was used. Consistent results were obtained using minima of 10, 12, 20 and 25 counts per bin, as expected (Yaqoob, 1998) and using background spectra from different regions on the detector.
3 Results
This is the first afterglow discovered for an INTEGRAL GRB and had an average 0.2–10.0 keV flux of erg cm-2 s-1, decaying with a power-law slope of with no strong evidence for deviations from this decay rate (Mereghetti et al., 2003).
As outlined above, the XMM-Newton data were divided into four time segments, each about 10 ks long, to examine spectral evolution. The complete spectrum of the afterglow, and each time segment individually, can be fit with a power-law and require absorption well in excess of the Galactic value, with absorption consistently around twice the Galactic foreground column density (the Galactic hydrogen absorbing column in this direction is cm-2, though the uncertainty on this value may be as large as 50%, Dickey & Lockman, 1990).
3.1 Spectral emission features
However the spectrum evolves during the observation, showing emission lines (see Fig. 1) at observed energies of , , , and keV only in the final ks, approximately 70 ks after the GRB.

The absorbed power-law fit (/d.o.f. = 85.2/71) is clearly improved in the last segment by the addition of the line emission (Fig. 2). Adding five narrow Gaussian emission lines (with energy and flux as free parameters) to a power-law with variable slope, normalization and absorption, gave an improvement in the fit of , corresponding to a null hypothesis probability of 0.04%. Table 1 contains the individual best-fit line parameters and significances.
Since four spectra were examined, a very conservative estimate of the significance of these line features is therefore given by the -test probability for the addition of five Gaussian lines to an absorbed power-law over four independent trials, which is 0.15% (). A more realistic estimate of the significance is given by a fit to an a priori expected model, i.e. that used by Reeves et al. (2002) to characterise the line emission in GRB 011211. In this model one expects to observe the Hydrogen-like emission lines of Mg, Si, and S and the Helium-like lines of Ar and Ca at an arbitrary redshift. The trial-corrected -test null hypothesis probability from this model is (). Finally, one can simply search the parameter space directly for the error on the total line flux, for the relevant parameters of interest (power-law normalisation and slope, absorption, redshift and the total emission line flux). This yields a probability of or ( for four trials) for zero emission line flux (see inset in Fig. 1).
| Line | Energy | Line | Unabs. Flux | EW (eV) | Sig. | |
|---|---|---|---|---|---|---|
| ID | (keV) | ( erg cm-2 s-1) | % | |||
| Mg XII | 97 | 2.2 | ||||
| Si XIV | 99.98 | 3.8 | ||||
| S XVI | 99.96 | 3.5 | ||||
| Ar XVIII | 92 | 1.7 | ||||
| (Ar XVIII) | (1.31) | |||||
| Ca XX | 99 | 2.5 | ||||
| (Ca XIX) | (1.34) | |||||
Note. — Column 1 lists the probable line identifications. For Ar and Ca, a helium-like ionization state seems more probable, giving a better match to the inferred redshifts (column 3) for the lighter elements. Columns 2, 4 and 5 are the observed line energies, unabsorbed fluxes and observed equivalent widths respectively, while the fifth and sixth columns give the statistical significance (percentage probability and equivalent Gaussian standard deviations) of each line detection (based on the -test comparison between the best-fit model with and without the line).
3.2 Comparison with previous X-ray emission lines
The detection of soft X-ray line emission in GRB 011211 has been criticised on the basis of possible systematic errors (Borozdin & Trudolyubov, 2003) and the level of statistical significance (Rutledge & Sako, 2003). Two later reanalyses of the data have been unable to reproduce the systematic problems at all (Reeves et al., 2003; Rutledge & Sako, 2003) and they appear to be due to non-standard event selection by Borozdin & Trudolyubov (2003). Concerns regarding the statistical significance have been addressed by Reeves et al. (2003).
Similar critical analysis has yet to be addressed to the other claims of X-ray line detections. An interesting comparison of the line detections made to date is the number of photons detected only in the line emission. For instance in GRB 991216, photons (Piro et al., 2000); GRB 000214, photons (Antonelli et al., 2000); GRB 020813, photons (Butler et al., 2003); GRB 011211, photons (Reeves et al., 2003). In all of these bursts, the number of counts detected per individual emission line has been –40. In these observations we detect line photons, nearly twice as many as in GRB 011211 and nearly an order of magnitude more than GRB 991216; the number of counts for the brighter individual emission lines here is .
4 Properties of the line emission
The lines are remarkably similar to those observed in GRB 011211 (Reeves et al., 2002)—they correspond well to the Hydrogen- and Helium-like lines of Mg, Si, S, Ar and Ca. The median redshift of these lines is , where the ions are assumed to be Hydrogen-like; however the ionisation states in the heavier elements, Ar and Ca, may be dominated by the He-like ions (see Table 1), resulting in a slighter lower median redshift (). The redshift determination is very robust; the relative line-spacing is only correct for lines due to Mg, Si, S, Ar and Ca and excludes the possibility of degeneracy in the redshift solution. An outflow velocity close to is expected for the X-ray plasma (Reeves et al., 2002; Butler et al., 2003) which is similar to that observed in optical GRB outflows (Hjorth et al., 2003). The GRB progenitor redshift is therefore expected to be .
The line emission alone accounts for about 6% of the total flux in the final 10 ks, which is an unabsorbed flux of erg cm-2 s-1. Assuming a redshift of and a flat cosmology where H km s-1 Mpc-1 and , this translates to an isotropic line luminosity of erg s-1 or a total energy of at least erg, implying that the lower limit to the energy required to produce the lines is erg (Ghisellini et al., 2002), within a factor of two of the total -ray energy in the burst (Frail et al., 2001).

4.1 Iron, Cobalt and Nickel
As with GRB 011211 there is no evidence for emission from iron; the upper-limit to the observed equivalent width for hydrogenic Fe is 175 eV. However, in this afterglow there is no evidence for Ni or Co emission either (equivalent width eV). In order to characterise the relative abundances, a pure (absorbed) collisionally-ionised plasma model was fit (without a power-law component).111Adding a power-law to the thermal fit does not change the plasma temperature significantly, but makes the absolute abundances harder to constrain by adding two extra free parameters; however, the Fe abundance upper-limit is still an order of magnitude less than the light metal abundance even after adding an underlying power-law to the collisionally-ionised plasma model. The best-fit redshift for this model was . The minimum () light metal abundance was 24 times the solar abundance, compared to upper limits of only 1.6 and 18 for Fe and Ni respectively. The implication of these upper limits is that there is only enough Fe, 56Ni and 56Co to produce an order of magnitude lower abundance of iron than that found for the lighter metals. This is important since 56Ni is produced in large quantities in supernovae and decays to 56Co and then 56Fe and none of these products is observed. A low abundance of Fe, Co or Ni is not anticipated in the standard models of GRB progenitors (Pruet et al., 2003; Vietri & Stella, 1998), suggesting a bias towards observing emission from the outer layers of the progenitor star and that very little Ni has been dredged up to these layers by turbulent mixing by the time the line emission is excited.
It has been suggested (Lazzati et al., 2002) that a high Fe abundance may still be present while the Fe K emission is suppressed by Auger auto-ionisation. A model based on reflection from an optically-thick medium was examined. Available models (e.g. Ballantyne & Ramirez-Ruiz, 2001) are dominated by Fe emission, do not include some abundant metals (S, Ar, Ca) and cannot give a reasonable fit to the data at low energies; however the model and data were compared at high energies in the relevant ionisation regime. One can indeed strongly depress the Fe K lines, however, the model cannot fit the continuum at energies above 7 keV (in the rest frame) due to large Fe absorption. It appears unlikely that this mechanism can both suppress the Fe or Ni emission and produce a smooth continuum at high energies. It is therefore concluded that Si and other -burning products but not Fe, Co or Ni are highly abundant in the line-emitting plasma.
4.2 Photo-ionisation
The line emission may result from photo-ionisation rather than collisional ionisation. In this case the plasma may have quite different properties. A model for a photo-ionised plasma was developed with XSTAR (Kallman, 2002) allowing variable abundances of the most abundant elements and was added to the absorbed power-law model and fit to the data from the final segment of the observation. The data were as well-fit by this model (/d.o.f. = 59.3/62) as by the collisionally-ionised model (/d.o.f. = 61.3/67), though requiring more free parameters. The model requires a moderately high ionisation parameter, . The best-fit redshift () and elemental abundance ratios (high light metal abundances, low Fe) are similar to those derived from the collisionally-ionised model above, confirming that these results are independent of the assumed emission model.
If the underlying power-law slope does not change significantly during the observation, it is possible to discount the sudden appearance of thermal emission in the last 11 ks of the observation, since the thermal flux would have to be about half the total flux (in the case where the spectral index and absorption are fixed at the level required to fit the full dataset) and the sudden appearance of emission of this magnitude is ruled out by the X-ray lightcurve (Fig. 3).
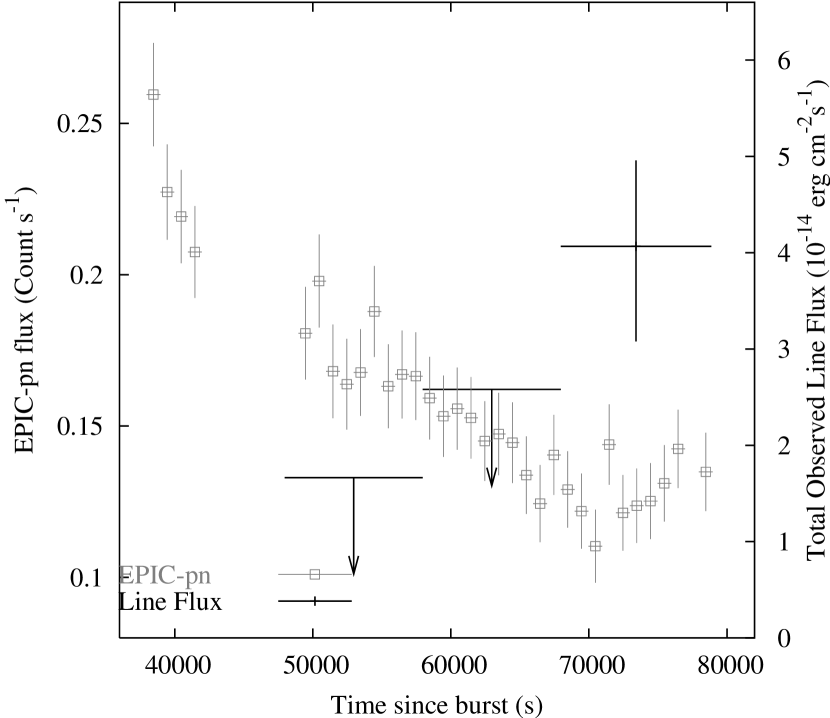
The extra emission component must therefore either appear gradually or be non-thermal in origin, strengthening the case for photo-ionisation.
5 Implications of the delay
The line emission in this afterglow is detected only in the final segment of the observation (Fig. 3), implying that the lines not only fade, as observed in GRB 011211, but also appear a significant time after the GRB, in this case six or seven hours in the rest frame. There are two alternative explanations for delayed line emission and each specifies both the geometry and the delay in the central power output.
The first alternative involves direct excitation of the lines by the GRB event; they must be delayed by taking a much longer path to the observer than the -rays (reverberation). In the second case there must be continuing, sporadic injection of energy after the GRB has finished.
In a reverberation-dominated scenario the minimum distance from the GRB to the line-emitting plasma can be estimated. It is cm (where the off-axis angle is ). If the plasma is flowing out from the stellar remnant at (Reeves et al., 2002; Hjorth et al., 2003; Butler et al., 2003) it implies a delay of at least 3.5 days between the event causing the matter outflow (presumably a supernova) and the GRB. If the line emission is produced by the GRB jet itself, the line-emitting plasma must be very near or in the edge of the jet. The off-axis angle must then be much less than implying a longer time delay between the matter outflow and the GRB. The jet opening angle (and hence the off-axis angle for the material) can be constrained. Using the method of Bloom et al. (2001) the equivalent isotropic energy was derived for this burst (extrapolating the INTEGRAL-SPI spectrum) and the actual -ray energy release was assumed to be erg (Frail et al., 2001). The ratio of these numbers implies a half-opening angle of for the jet. At this angle, the inferred distance is cm implying a delay between the matter expulsion and the GRB of about 80 days. A supernova considerably prior to the GRB (e.g. a ‘supranova’) would be a natural interpretation in this scenario (Lazzati, 2003). It should be noted that for delay due to reverberation as outlined above, the line-emitting material would have to be enriched in light elements, poor in iron, nickel and cobalt and concentrated in dense clumps slightly off-axis from the GRB jet but generally located around this axis, otherwise the total ejected mass is prohibitively large.
Very recent observations of a nearby GRB (030329) show clear evidence of a supernova in the optical spectra, constraining the time-delay between the supernova and the GRB to be less than a few days (Hjorth et al., 2003; Kawabata et al., 2003). If the result is general and all long-duration GRBs have the same progenitors, as appears likely, then the delay between supernova and GRB required in the reverberation scenario described above probably disqualifies it. An analysis of a different reverberation scenario has been made by Kumar & Narayan (2003), where - and hard X-radiation from the GRB and the early afterglow is reflected back onto the outer layers of the expanding supernova. This concept has the advantage that it does not require a delayed two-stage explosion sequence (SN, GRB) to produce the reverberation. Furthermore, it naturally explains the lack of emission from heavier ions (Fe, Co, Ni) if the outer layers of the SN ejecta are dominated by lighter metals. The principle difficulty, as pointed out by Kumar & Narayan (2003), is that it is hard to produce X-ray line luminosities erg as directly observed here.
Finally we turn to continuing energy injection to explain the delayed X-ray lines. In the collapsar model (MacFadyen & Woosley, 1999) where the radius of the dense matter must be cm (the size of an exploding Wolf-Rayet star) and a single event (the GRB) must produce all the observed features, the reverberation time is too short to account for the observed delay. In order to produce emission lines it has been proposed (Rees & Mészáros, 2000) that a strong, post-GRB source is reflected off the internal edges of a cavity evacuated in the star by the GRB jet (Zhang et al., 2003). The enormous power in the X-ray lines implies that the continuum luminosity onto the cavity edge must, at the very least, be erg s-1 for a duration of a few thousand seconds. A source with this luminosity would equal the X-ray afterglow continuum observed here and be clearly detected; the continuum source must therefore either be obscured or be intrinsically anisotropic. The more likely proposition is an anisotropic source as expected for a hot accretion disk (Zhang et al., 2003) or a young, rapidly accreting pulsar with a strong magnetic field (Rees & Mészáros, 2000), both proposed as consequences of a GRB in a massive star. In normal pulsars the emission axis is offset from the rotation axis, as is required here. Furthermore a natural corollary of the geometry in the case of the pulsar, if the emission can be restricted to a cone-shaped beam from the poles, is that the inner regions of the cavity wall, where the Fe/Ni abundance can be expected to be highest, may not be illuminated by the pulsar beam, resulting in a light-metal-rich, but Fe/Ni-deficient X-ray reflection spectrum due to the laminar separation of elements in an aged, massive star.
References
- Antonelli et al. (2000) Antonelli L. A., Piro L., Vietri M. et al., 2000, ApJ 545, L39
- Ballantyne & Ramirez-Ruiz (2001) Ballantyne D. R., Ramirez-Ruiz E., 2001, ApJ 559, L83
- Bloom et al. (2001) Bloom J. S., Frail D. A., Sari R., 2001, AJ 121, 2879
- Bloom et al. (1999) Bloom J. S., Kulkarni S. R., Djorgovski S. G. et al., 1999, Nat 401, 453
- Borozdin & Trudolyubov (2003) Borozdin K. N., Trudolyubov S. P., 2003, ApJ 583, L57
- Butler et al. (2003) Butler N. R., Marshall H. L., Ricker G. R. et al., 2003, [astro-ph/0303539]
- Dickey & Lockman (1990) Dickey J. M., Lockman F. J., 1990, ARA&A 28, 215
- Frail et al. (2001) Frail D. A., Kulkarni S. R., Sari R. et al., 2001, ApJ 562, L55
- Galama et al. (1998) Galama T. J., Vreeswijk P. M., van Paradijs J. et al., 1998, Nat 395, 670
- Ghisellini et al. (2002) Ghisellini G., Lazzati D., Rossi E., Rees M. J., 2002, A&A 389, L33
- Hjorth et al. (2003) Hjorth J., Sollerman J., Møller P. et al., 2003, Nat, in press
- Jansen et al. (2001) Jansen F., Lumb D., Altieri B. et al., 2001, A&A 365, L1
- Kallman (2002) Kallman T. R., 2002, http://heasarc.gsfc.nasa.gov/docs/software/xstar/xstar.html
- Kawabata et al. (2003) Kawabata K. S., Deng J., Wang L. et al., 2003, [astro-ph/0306155]
- Kumar & Narayan (2003) Kumar P., Narayan R., 2003, ApJ 584, 895
- Lazzati (2003) Lazzati D., 2003, A&A 399, 913
- Lazzati et al. (2002) Lazzati D., Ramirez-Ruiz E., Rees M. J., 2002, ApJ 572, L57
- Loiseau et al. (2003) Loiseau N., Gilomo M., Gonzalez-Riestra R. et al., 2003, GRB Coordinates Network Circular 1901
- MacFadyen & Woosley (1999) MacFadyen A. I., Woosley S. E., 1999, ApJ 524, 262
- Mereghetti et al. (2003) Mereghetti S., Götz D., Tiengo A. et al., 2003, ApJ 590, L73
- Paczynski (1998) Paczynski B., 1998, ApJ 494, L45
- Parmar et al. (2003) Parmar A. N., Winkler C., Barr P. et al., 2003, In: Proceedings of the SPIE, Vol. 4851, pp 1104–1112
- Piro et al. (1998) Piro L., Amati L., Antonelli L. A. et al., 1998, A&A 331, L41
- Piro et al. (2000) Piro L., Garmire G., Garcia M. et al., 2000, Sci 290, 955
- Pruet et al. (2003) Pruet J., Woosley S. E., Hoffman R. D., 2003, ApJ 586, 1254
- Rees & Mészáros (2000) Rees M. J., Mészáros P., 2000, ApJ 545, L73
- Reeves et al. (2003) Reeves J. N., Watson D., Osborne J. P., Pounds K. A., O’Brien P. T., 2003, A&A 403, 463
- Reeves et al. (2002) Reeves J. N., Watson D., Osborne J. P. et al., 2002, Nat 416, 512
- Rutledge & Sako (2003) Rutledge R. E., Sako M., 2003, MNRAS 339, 600
- Stanek et al. (2003) Stanek K. Z., Matheson T., Garnavich P. M. et al., 2003, ApJ in press, [astro-ph/0304173]
- Vietri & Stella (1998) Vietri M., Stella L., 1998, ApJ 507, L45
- Watson et al. (2002a) Watson D., Reeves J. N., Osborne J. et al., 2002a, A&A 393, L1
- Watson et al. (2002b) Watson D., Reeves J. N., Osborne J. P. et al., 2002b, A&A 395, L41
- Yaqoob (1998) Yaqoob T., 1998, ApJ 500, 893
- Yoshida et al. (2001) Yoshida A., Namiki M., Yonetoku D. et al., 2001, ApJ 557, L27
- Zhang et al. (2003) Zhang W., Woosley S. E., MacFadyen A. I., 2003, ApJ 586, 356