Abstract
In the SACY (Search for Associations Containing Young-stars) project we try to identify associations of stars younger than the Local Association among HIPPARCOS and/or TYCHO-2 stars later than G0 which are counterparts of the ROSAT X-ray bright sources. High-resolution spectra for the possible optical counterparts were obtained in order to assess both the youth and the spatial motion of each target. More than 1000 ROSAT sources were observed, covering a large area in the Southern Hemisphere. Associations are characterized mainly by the similarity in UVW velocity space of their proposed member, but other parameters, as evolutionary age, Li abundance and distribution in space must also be taken into account. We proposed a method to identify associations when proper motions and radial velocities are available, but no parallaxes. Using the method we found eleven associations in the SACY data.
A Method to Search for Associations of Young Stars 111 Based on observations made under the ON-ESO agreement for the joint operation of the 1.52 m ESO telescope and at the Observatório do Pico dos Dias (LNA/MCT), Brazil
SACY
Torres et al.
Introduction
In 1989, de la Reza et al. searched for isolated T Tau stars (TTS) and found a group of TTS around TW Hya. This was the beginning of the Pico dos Dias survey (PDS). The PDS was a search for young stars using the IRAS Point Source Catalog as the main selector (Gregorio-Hetem et al., 1992; Torres et al., 1995; Torres, 1998). X-ray sources from the ROSAT All-Sky Survey (RASS) gave a new tool to find new young associations (Neuhäuser 1997). With some of these sources, Torres et al. (2000) found evidences for a young nearby association: they called it Horologium Association (HorA). Almost simultaneously, Zuckerman & Webb (2000) found another one, very similar and adjacent in the sky, which they called Tucana Association (TucA). In order to examine the physical relation between both of them, and to search for other ones, we started the SACY project (de la Reza et al. 2001; Torres et al. 2001; Quast et al. 2001).
1 Observations
For SACY we selected all bright RASS sources that could be associated with TYCHO-2 or HIPPARCOS stars with (B-V) 0.6, excluding well known RS CVn, W UMa, giants, etc from SIMBAD. We restricted our sample to stars later than G0 because we use the Li I 6707Å equivalent width as an age indicator.
We obtained high resolution spectra for the selected candidates with the FEROS échelle spectrograph (Kaufer et al. 1999) (resolution of 50000; spectral coverage of 5000 Å) of the 1.52 m ESO telescope at La Silla or with the coudé spectrograph (resolution of 9000; spectral coverage of 450 Å, centered at 6500 Å) of the 1.60 m telescope of the Observatório do Pico dos Dias (OPD). For some stars we obtained radial velocities with CORALIE at the Swiss Euler Telescope at ESO (Queloz et al. 2000). We derived spectral classifications, radial velocities and equivalent widths of Li I 6707 Å lines. In particular, the Li I line is important since it can provide a crude age estimate (Jeffries 1995) for late type stars. If the Li I line equivalent width is larger than the highest values for stars stars belonging to the Local Association (Neuhäuser 1997), the star is flagged as young.
photometry for some of the stars of the sample was obtained using FOTRAP (Jablonski et al. 1994) at the 0.60 m telescope of the OPD.
1.1 Statistics
There are 9574 RASS bright sources in the Southern Hemisphere, 2071 of them having counterparts with (B-V) 0.6 in TYCHO-2. We observed 1096 sources. We also used published information for 99 others, most of them without interest for our search and the young ones taken mainly from Covino et al. (1997). Unfortunately we have no observations in the Upper Cen-Lup of the Sco-Cen Association. We classified 201 stars as giants and 966 as dwarfs, 421 of them being younger than the Pleiades, 174 having the Pleiades age and 371 older than it.
More details can be seen in the paper of Torres et al. in the meeting book.
2 The analysis
Our observational data set include proper motions, radial velocities, spectral types, B-V magnitudes, Li abundances and, for some stars, HIPPARCOS parallaxes. For B-V colors we use data with the following priorities: our own colors observations, good observed colors found in the literature, HIPPARCOS colors, TYCHO-2 colors corrected to the Johnson system if the stars are brighter than magnitude 10 and finally, intrinsic colors related to their spectral type.
As most of our young stars have no HIPPARCOS parallaxes we developed a method to find possible associations: We first perform a global kinematical analysis in which, for each point in a grid in UVW space, we compute the density of stars around this point, adjusting the parallaxes so that the distances in UVW space to this point (or the moduli of the space velocity vectors relative to this point) are minimized. Since we preserve the parallaxes of HIPPARCOS stars their UVW are fixed. Constrains are applied so that the stars fall into plausible positions in the HR diagram. Maxima density concentrations much larger than the background fluctuation may represent real associations.
Once a possible association has been found by the global analysis and its age estimated (i. e., by the Li abundance), its parameters can be refined and the membership to the association for each star weighted, by a simultaneous adjustment of the kinematics and the age. We impose some restriction on the magnitudes differences that we accept possible candidates. For example, we can reject a star if its kinematical solution for a possible membership to an association age is more than one magnitude. We weight the “evolutionary distance” and the “kinematical distance” to each star solution to accept or reject it as a possible member. Since the kinematics of the young associations are, in general, very similar one to another we have to use the distribution in space as an additional constrain. In fact, all the main concentrations in UVW space are also spatially localized, albeit some of them cover large areas. It is in general very easy to recognize that an initial concentration in UVW is actually formed by more than one association with similar velocities as its split in distinct concentrations in the real space. Anyway, for some stars we must infer a “best membership”. Some iterations may be necessary to obtain a good solution.
3 The Young Associations
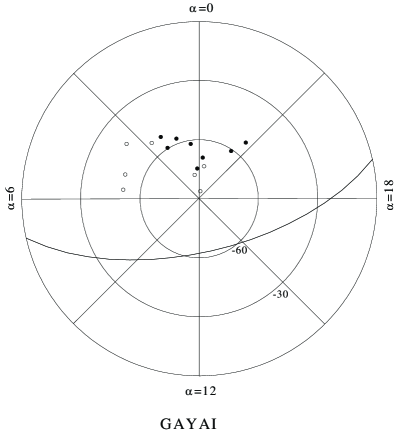
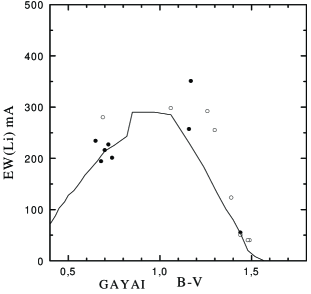
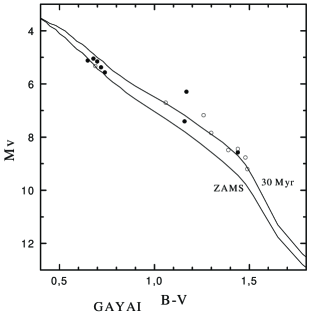
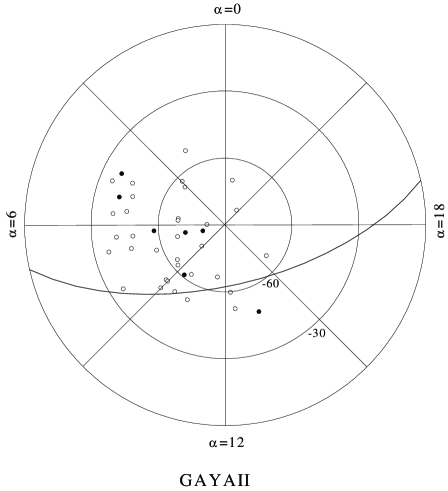
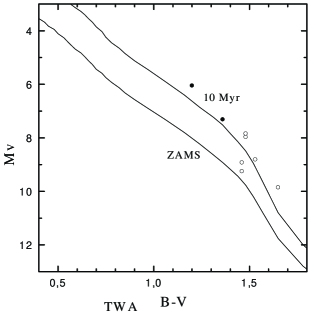
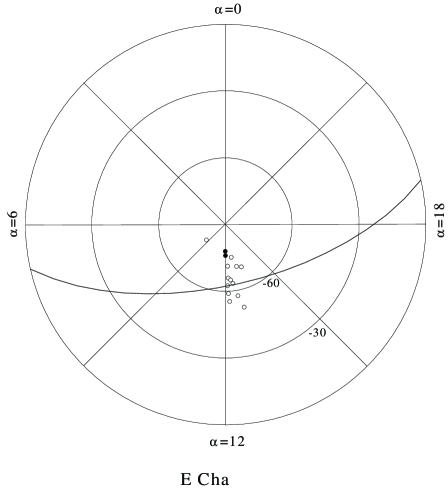
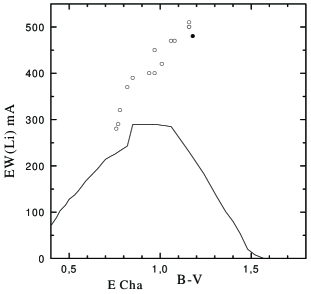
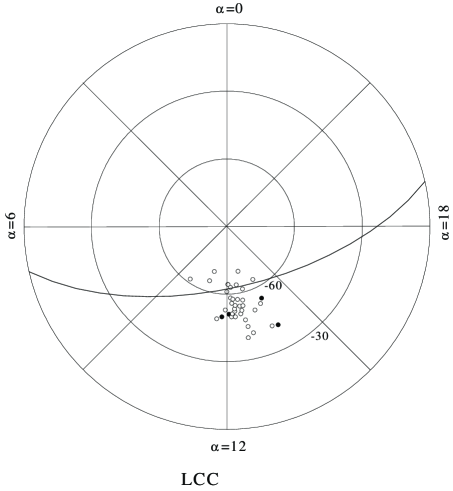
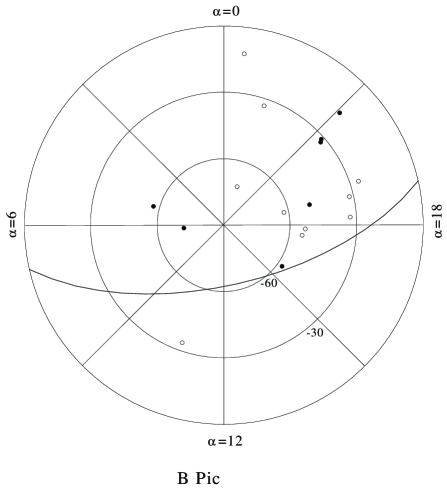
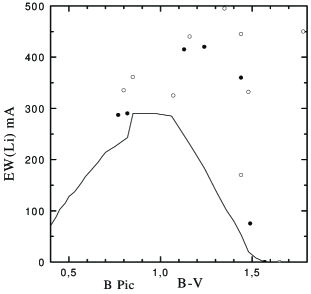
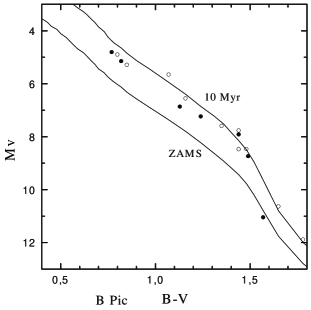
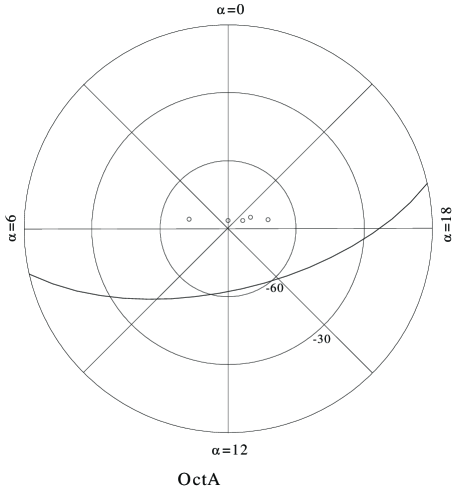
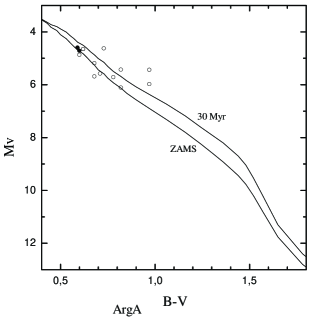
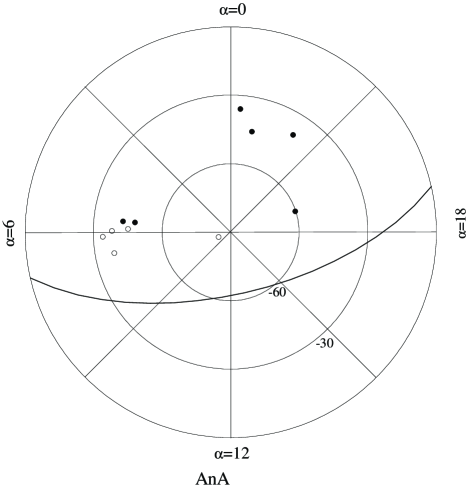
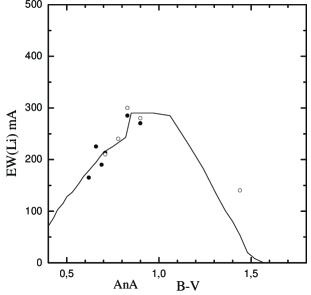
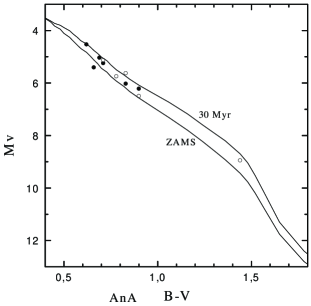
Applying the method to the database of the SACY project we find 11 associations of young stars. Their relevant properties are shown in the Tables 1 and 2 and could be visualized in the figures. For each suggested association we plot:
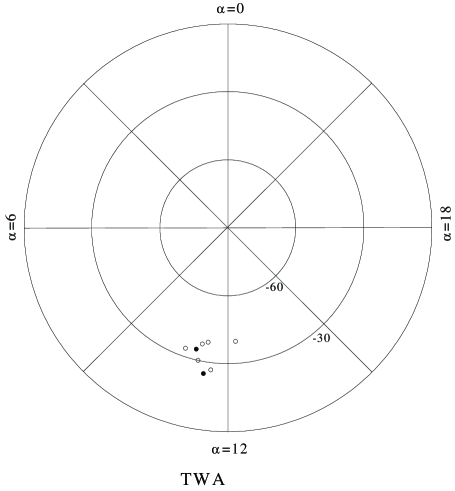
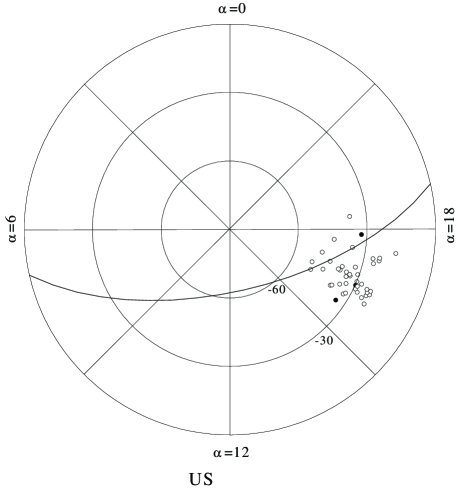
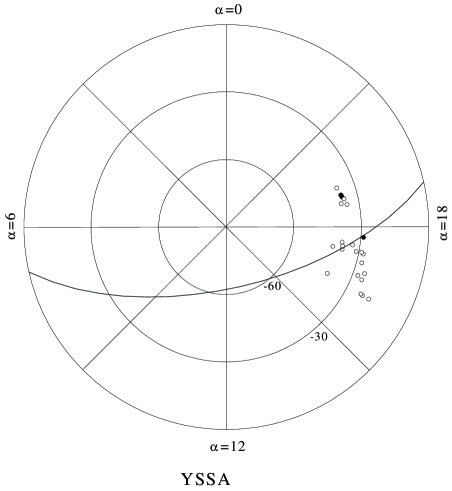
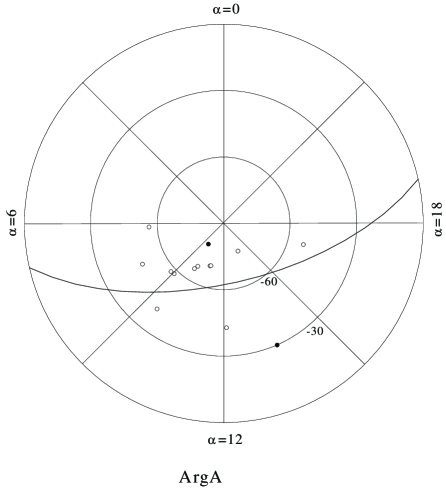
a) The distribution in the sky in a polar projection.
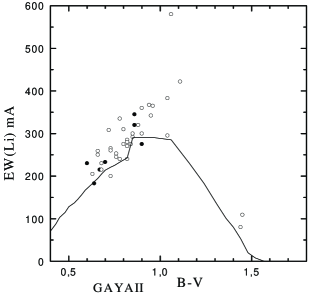
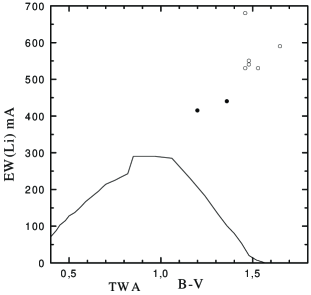
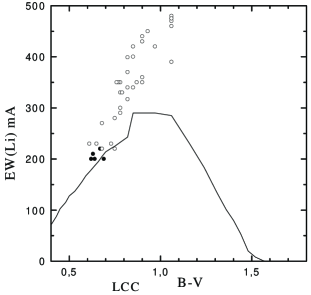
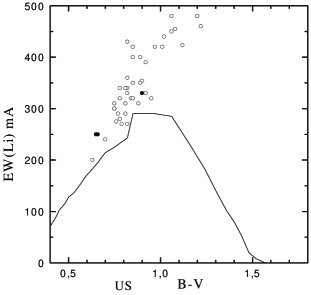
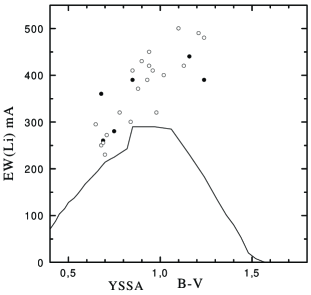
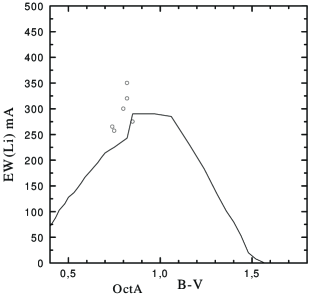
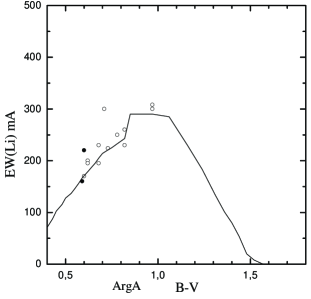
b) The distribution of Li I 6707 Å line equivalent width as a function of color. The continuous line represents the upper limit for Pleiades Association stars.
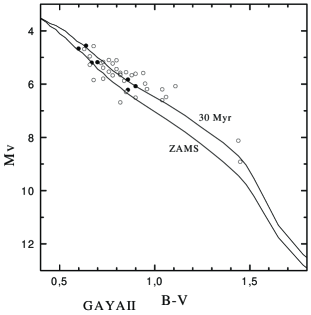
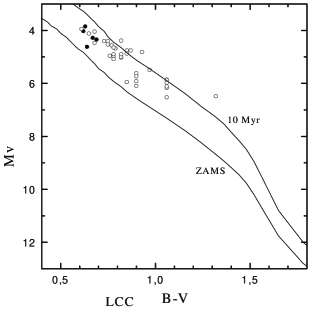
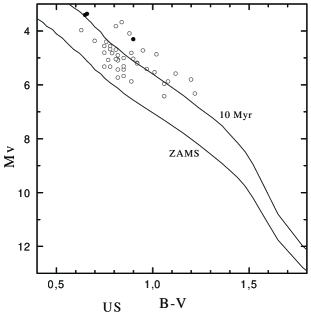
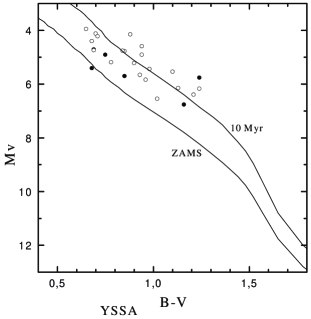
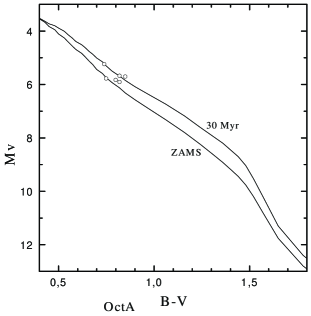
c) The evolutionary diagram. The continuous lines represent the ZAMS and an isochrone of either 30 Myr or 10 Myr from Siess (1997)
| \sphlineName | U | V | W | N∗ | |||||
|---|---|---|---|---|---|---|---|---|---|
| km/s | km/s | km/s | km/s | km/s | km/s | mas | mas | ||
| \sphlineGAYA1 | -9.1 | 1.1 | -20.9 | 1.0 | -1.2 | 0.9 | 22.0 | 2.2 | 16 |
| GAYA2 | -11.0 | 1.0 | -22.5 | 1.0 | -4.6 | 1.1 | 11.9 | 4.2 | 41 |
| TWA | -12.1 | 0.7 | -17.1 | 0.8 | -5.5 | 0.9 | 22.4 | 5.6 | 5+3 |
| ChaA | -7.7 | 0.6 | -19.7 | 0.8 | -8.5 | 0.9 | 10.5 | 1.3 | 15 |
| LCC | -8.6 | 0.8 | -21.4 | 1.1 | -5.6 | 1.1 | 8.7 | 1.4 | 40 |
| US | -4.7 | 1.2 | -19.3 | 0.7 | -5.2 | 1.3 | 7.5 | 1.4 | 43 |
| YSSA | -4.0 | 1.3 | -13.4 | 1.0 | -8.0 | 1.2 | 8.6 | 1.9 | 21+5 |
| PicA | -9.5 | 1.2 | -16.4 | 1.1 | -9.4 | 0.9 | 34.1 | 27.2 | 16+1 |
| OctA | -10.4 | 0.6 | -1.5 | 0.6 | -8.0 | 0.8 | 8.9 | 1.5 | 6 |
| ArgusA | -21.5 | 0.8 | -13.1 | 1.1 | -5.1 | 1.4 | 9.8 | 2.7 | 14 |
| AnA | -7.1 | 0.8 | -28.0 | 1.1 | -12.4 | 1.2 | 19.0 | 10.5 | 11 |
| \sphline |
| \sphlineName | X | Y | Z | age | N∗ | ||||
|---|---|---|---|---|---|---|---|---|---|
| pc | pc | pc | pc | pc | pc | pc | Myr | ||
| \sphlineGAYA1 | 12 | 14 | -25 | 8 | -33 | 5 | 26 | 30 | 16 |
| GAYA2 | 7 | 27 | -78 | 33 | -31 | 25 | 84 | 20 | 41 |
| TWA | 9 | 6 | -41 | 10 | 20 | 5 | 18 | 8 | 8 |
| ChaA | 47 | 7 | -82 | 12 | -6 | 14 | 34 | 10 | 15 |
| LCC | 57 | 12 | -100 | 20 | 16 | 17 | 75 | 15 | 40 |
| US | 132 | 27 | -28 | 18 | 22 | 18 | 72 | 8 | 43 |
| YSSA | 117 | 22 | -10 | 10 | -2 | 30 | 50 | 8 | 26 |
| PicA | 33 | 28 | -8 | 16 | -16 | 7 | 50 | 15 | 17 |
| OctA | 65 | 30 | -73 | 7 | -55 | 6 | 46 | 30 | 6 |
| ArgusA | 30 | 30 | -95 | 34 | -10 | 25 | 83 | 30? | 14 |
| AnA | 4 | 32 | -35 | 28 | -35 | 17 | 69 | 50 | 11 |
| \sphline |
In Tables 1 & 2 we present the properties of the young associations detected in this way. In Table 1 we give the mean kinematical values and the mean parallax. For some known associations we use members not observed in the SACY to help in their definition. Their numbers are indicated in the last column in Table 1. In Table 2 we give the mean XYZ, the age, and the distance () of the most distant member with respect to the calculated center of the association, giving an idea of its size.
3.0.1 GAYA1
We are calling GAYA (Torres et al. 2001) two nearby concentrations on the UVW space, separated mainly in W velocities. Both seem adjacent in the real space. GAYA1 is somewhat older and is one of the more well defined of the associations in SACY and the previous HorA and TucA are within it. Some of the proposed members of TucA are outside of the velocity definition (mainly the eastern ones). Of their 16 proposed members 8 have parallaxes in HIPPARCOS. The spread in distance is small and this does not seem an artifact either of the SACY or our analysis as its derived center is at only 45 pc.
3.0.2 GAYA2
GAYA2 is much less well defined, although it shows a clear concentration using HIPPARCOS stars, but reinforced by members of Lower Cru-Cen (LCC). Actually, the UVW are very near the LCC ones and it is adjacent in space. Nevertheless GAYA2 seems older than LCC and closer to us.
3.0.3 TWA
The TW Hya association is not very well defined in SACY since only two members have trigonometric parallaxes. Torres et al. (2003) present a list of proposed members, but many of them lack information for a complete kinematical analysis. Anyway, we try to use all possible data. The convergence method has problems as TWA is near in velocity and space of ChaA and LCC. We applied it limiting the possible spatial volume but including any star position in Torres et al. list. Nevertheless our solution excludes many stars in their list. We proposed as bonafide kinematical members: TWA 1, 2, 3, 4, 7, 8, 12 plus a new member, CD-39 7538.
3.0.4 ChaA
This association is defined by Mamajek, Lawson & Feigelson (2000). We propose new members, enlarging it. There is ambiguity for about half of the proposed members between ChaA and LCC, but the solutions show a consistent separation in UVW space. One of the proposed members is PDS66. The distance found by us indicates it is in front of the Cha complex.
3.0.5 LCC
This association has UVW near those of ChaA and GAYA2 and the age seems between both. The LCC found in SACY is very similar to that found by Sartori et al. (2003) for early-type stars. In our solution TWA19 belongs to LCC.
3.0.6 US
The Upper Sco (US) has UVW near those of LCC and YSSA. US can easily be separated from LCC in real space, but many stars may be assigned both to US and YSSA. Since we have almost no observations in Upper Cen-Lupus we can not say if they would be separated in SACY.
3.0.7 YSSA
This is a group of young stars, spread from Oph to R Cra, with very similar properties, that we are now calling the Young Sco-Sgr Association. The western border engulfs the stars mentioned in Quast et al. (2001) and Neuhäuser et al. (2000). The split in space distribution can be explained by the incompleteness in the RASS coverage. Anyway, the convergence process gives some superposition with US association. The distance is near the assumed one for the R CrA cloud.
3.0.8 PicA
As described by Zuckerman et al.(2001), this association is very close to the Sun. We propose new members, some of then as far as 80 pc, but the distribution in space seems very consistent. Among the new proposed members is V4046 Sgr, a notorious object, classified before as an isolated SB classical TTS (de la Reza et al., 1986; Quast, 1998; Quast et al. 2000). WW PsA and TX PsA could be members (Song et al. 2002), but their parallaxes should be 49.5 mas, closer than HIPPARCOS ones, about 2 of the HIPPARCOS errors.
3.0.9 OctA
This is a very homogeneous small group of almost aligned stars (all young G stars) near the South Celestial Pole. Since this region belongs to a completely surveyed area of the SACY, new members have to be found by other means.
3.0.10 ArgusA
Although not very well defined, it has a special position in UVW. Since many stars are in Car, Vel and Pup we tentatively propose to call it as Argus A.
3.0.11 AnA
Like ArgusA, the main reason to claim for this possible association are the very special UVW. The majority of the proposed members have parallaxes and, therefore, this is one of the concentrations in the HIPPARCOS sample.
GAYA1, GAYA2, LCC, US and YSSA form a decreasing sequence in age, going from west to east, and they seem to form a kind of continuum in UVW space. All the associations but the last three in the tables can represent local aspects of a global star forming process.
Acknowledgements.
This work was partially supported by a CNPq - Brazil grant to C. A. O. Torres (pr. 200356/02-0).1
References
- [1] Covino, E., Alcalá, J.M., Allain, S., Bouvier, J., Terranegra, L., & Krautter, J. 1997, A&A, 328, 187
- [2] de la Reza, J. R., da Silva, L., Jilinski, E., Torres, C. A. O., & Quast, G. R. 2001, in ASP Conf. Ser. Vol. 244, Young stars near earth: progress and prospects, ed. R. Jayawardhana & T. P. Greene (San Francisco: ASP), 37
- [3] de la Reza, R., Quast, G. R., Torres, C. A. O., Mayor & M. Vieira, G.V. 1986, in Symp.NASA-ESA. New Insights in Astrophysics, ESA S-263, 107
- [4] de la Reza, R., Torres, C. A. O., Quast, G. R., Castilho, B.V., & Vieira, G.L. 1989, ApJL, 343, L61
- [5] Gregorio-Hetem, J., Lépine, J. R. D., Quast, G. R., Torres, C. A. O., & de la Reza, R. 1992, AJ, 103, 549
- [6] Jablonski, F., Baptista, R., Barroso, J., Jr., Gneiding, C. D., Rodrigues, F., & Campos, R. P. 1994, PASP, 106, 1172
- [7] Jeffries, R. D. 1995, MNRAS, 273, 559
- [8] Kaufer, A., Stahl, S., Tubbesing, S., Norregaard, P., Avila, G., Francois, P., Pasquini, L., & Pizzella, A. 1999, Messenger, 95, 8
- [9] Mamajek, E. E., Lawson, W. A., & Feigelson, E. D. 2000, ApJ, 544, 356
- [10] Neuhäuser, R. 1997, Science, 276, 1363
- [11] Neuhäuser, R., Walter, F. M., Covino, E., Alcalá, J. M., Wolk, S. J., Frink, S., Guillout, P., Sterzik, M. F., & Comerón, F. 2000, A&AS, 146, 323
- [12] Quast, G.R. 1998, thesis ON-Rio de Janeiro
- [13] Quast, G. R., Torres, C. A. O., de la Reza, J. R., da Silva, L., & Drake, N. 2001, in ASP Conf. Ser. Vol. 244, Young stars near earth: progress and prospects, ed. R. Jayawardhana & T. P. Greene (San Francisco: ASP), 49
- [14] Quast, G.R.; Torres, C. A. O.; de la Reza, R., da Silva, L., & Mayor, M. 2000, IAU Symposium No. 200 “Birth and Evolution of Binary Stars”, Potsdam, Germany, 28
- [15] Queloz, D., Mayor, M., Naef, D., Santos, N., Udry, S., Burnet, M., & Confino, B. 2000, in VLT Opening Symposium From Extrasolar Planets to Brown Dwarfs, ESO Astrophys. Symp., Springer Verlag, Heidelberg, 548
- [16] Sartori, M. J., Lépine, J. R. D., & Dias, W. S. 2003, A&A, 404, 913
- [17] Siess, L., Forestini, M., & Dougados, C. 1997, A&A, 324, 556
- [18] Song, I., Bessel, M. S., & Zuckerman, B. 2002 ApJL, 581, L434
- [19] Torres, C. A. O., Quast, G., de la Reza, R., Gregorio-Hetem, J., & Lépine, J. R. D. 1995, AJ, 109, 2146
- [20] Torres, C. A. O. 1998, Publicação Especial do Observatório Nacional, 10/99
- [21] Torres, C. A. O., da Silva, L., Quast, G., de la Reza, R., & Jilinski, E. 2000, AJ, 120, 1410
- [Torres et al., 2001] Torres, C. A. O., Quast, G. R., de la Reza, J. R., da Silva, L., Melo, & C. H. F. 2001, in ASP Conf. Ser. Vol. 244, Young stars near earth: progress and prospects, ed. R. Jayawardhana & T. P. Greene (San Francisco: ASP), 43
- [22] Torres, G., Guenther, E. W., Marschall, L. A., Neuhäuser, R., Latham, D. W., & Stefanik, R. P. 2003, AJ 125, 825
- [23] Zuckerman, B., Sing, I., Bessell, M. S., & Webb, R. A 2001, ApJL, 562, L87
- [24] Zuckerman, B., & Webb, R. A. 2000, ApJ, 535, 959