email: olivier.lefevre@oamp.fr 22institutetext: Institut d’Astrophysique de Paris, UMR 7095, 98 bis Bvd Arago, 75014 Paris, France 33institutetext: Observatoire de Paris, LERMA, UMR 8112, 61 Av. de l’Observatoire, 75014 Paris, France 44institutetext: Osservatorio Astronomico di Bologna, via Ranzani 1, 40127 Bologna, Italy 55institutetext: Osservatorio di Capodimonte, via Moiariello 16, 80131 Napoli, Italy 66institutetext: Canada-France Telescope Corporation, 65-1238 Mamalahoa Hwy, Kamuela, Hawaii 96743, USA 77institutetext: Service d’Astrophysique, CE Saclay, L’Orme des Meurisiers, 91191 Gif sur Yevette Cedex , France
The VIRMOS deep imaging survey: I. overview and survey strategy
This paper presents the CFH12K-VIRMOS survey: a deep B, V, R and I imaging survey in four fields totalling more than 17 deg2, conducted with the arcmin2 field CFH-12K camera. The survey is intended to be a multi-purpose survey used for a variety of science goals, including surveys of very high redshift galaxies and weak lensing studies.
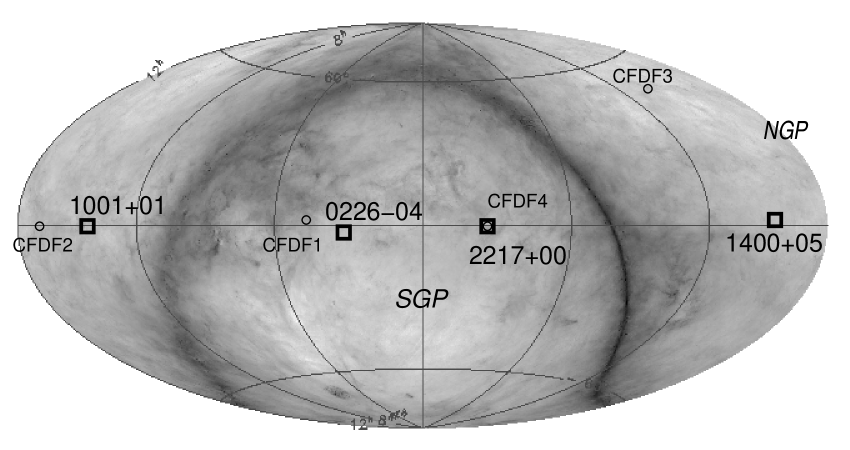
Four high galactic latitude fields, each deg2, have been selected along the celestial equator: 0226-04, 1003+01, 1400+05, and 2217+00. The 16 deg2 of the ”wide” survey are covered with exposure times of 2h, 1.5h, 1h, 1h , while the deg2 area of the ”deep” survey at the center of the 0226-04 field is covered with exposure times of 7h, 4.5h, 3h, 3h, in B,V,R and I respectively. An additional area deg2 has been imaged in the 0226-04 field corresponding to the area surveyed by the XMM-LSS program (Pierre et al., 2003).
The data is pipeline processed at the Terapix facility at the Institut d’Astrophysique de Paris to produce large mosaic images. The catalogs produced contain the positions, shape, total and aperture magnitudes for the 2.175 million objects measured in the 4 areas The depth measured as a measurement in a 3 arc-second aperture is in the “Wide” areas, and in the deep area. Careful quality control has been applied on the data to ensure internal consistency and assess the photometric and astrometric accuracy as described in joint papers (McCracken et al, 2003).
These catalogs are used to select targets for the VIRMOS-VLT Deep Survey, a large spectroscopic survey of the distant universe (Le Fèvre et al., 2003). First results from the CFH12K-VIRMOS survey have been published on weak lensing (e.g. van Waerbeke & Mellier 2003).
Catalogs and images are available through the VIRMOS database environment under Oracle (http://www.oamp.fr/virmos). They will be open for general use on July 1st, 2003.
Key Words.:
Cosmology: observations – Galaxies: evolution – Cosmology: gravitational lensing – Cosmology: large scale structure of universe1 Introduction
Deep imaging over large areas is required for many fields of astronomy, to survey large numbers of objects or to search for rare, low projected density objects. It is a key tool to our understanding of the universe, from solar system studies to the most distant galaxies. The measurement of positions, magnitudes, colors, and shape are key observable to all astronomical investigations. From astrometric and photometric measurements, a census of the number and positions of various classes of objects can be conducted as a function of magnitude, color, or shape.
Progress in detector area have allowed to design and build large CCD mosaics covering a significant fraction of the field available on wide field telescopes see Groom 2000 for a review . These mosaics have enabled survey work on large areas which had only been possible previously with photographic plates at the focus of Schmidt and prime foci of major telescopes. Probing scales larger than 0.5 degree in one single exposure with the sensitivity of CCDs has become possible at a few facilities in the past few years (Cuillandre et al, 2000; Boulade et al, 2000; Miyazaki et al, 2002; Kuijken et al, 2002), enabling a wealth of new deep survey initiatives (Postman et al, 1998; Nonino et al, 1999; McCracken et al, 2001; McMahon et al, 2001; Wilson, 2003)
This paper is the first of a serie that describes the deep survey we have undertaken starting when the CFH12K camera became available at CFHT prime focus in 1999. The main survey covers a total of 16 deg2 in 4 areas, each deg2, which have been imaged in B,V,R and I bands, at a depth equivalent to for a detection in a 3 arc-second circular aperture for all the area, with a deeper area imaged to . We focus here on the survey goals and strategy, and the observations performed, together with an overview of the pipeline processing and the content of the photometric catalogs. Other papers in this series (McCracken et al, 2003); (Gwyn et al., 2003 in preparation) describe in details the procedures followed to build the astrometry and photometry of the large image mosaics, and the quality control applied. The VIRMOS survey has been used already for cosmic shear studies and 8 refereed papers have been published so far from this data set by the virmos-descart project (see van Waerbeke & Mellier 2003 for a review, ).
2 Survey Goals
The survey has been designed to address a broad range of astrophysical questions in one single observing strategy. Several main science drivers have been identified:
-
•
study the evolution of galaxies from redshifts ,
-
•
study the evolution of large scale structures over 100 Mpc from redshifts ,
-
•
measure weak lensing signature of large scale structures,
-
•
measure the properties of galaxy biasing using together the dark matter (from weak lensing) and the galaxy distribution,
-
•
identify new high redshift clusters of galaxies,
-
•
identify faint AGN and study their evolution,
-
•
identify new Kuiper belt objects to give new insights into the formation of the solar system,
-
•
identify very faint halo white dwarfs,
-
•
study high redshift Lyman-break galaxies with . using the multi-color data set of the optical and U-band survey
The data is also being used with time series to search for high redshift supernovae.
This imaging survey is being used to select the targets of the VLT-VIRMOS deep redshift survey of more than 100000 galaxies with (Le Fèvre et al, 2003), to obtain large catalogues of galaxy shapes for cosmic shear studies and as the optical counterpart to the XMM medium deep survey (http://vela.astro.ulg.ac.be/themes/spatial/xmm/LSS/) being carried out with XMM Pierre et al. (2003). The deep VIRMOS field is also completed by a U-band follow up done at ESO, with the WFI camera (Radovich et al 2003), as well as in radio wavelength with the VLA Bondi et al (2003). A tiny area of the deep field has also been observed in K-band, with SOFI at the ESO/NTT (Iovino et al 2003).
3 Survey Strategy
3.1 Field Selection
Survey fields have been selected with the following criteria:
-
•
along the celestial equator to allow for visibility from northern and southern hemispheres observatories,
-
•
galactic latitude higher than deg.,
-
•
low cirrus absorption as seen from the DIRBE maps available when the survey started in 1998,
-
•
visibility of any 2 fields at any time of the year to fill observing nights.
The four fields selected are listed in Table 1 and their position in the dust sky map shown in figure 1.
3.2 Survey depth
The survey has been designed to reach a limiting magnitude (at in a 3 arcsec diameter aperture) in all of the area surveyed, with a smaller 1.3 area in the 0226-04 field observed to . The depth of this imaging survey is then at least one magnitude deeper than the limiting magnitude(s) of the VIRMOS-VLT Deep Survey (VVDS), set to be for the wide areas and for the deep area (Le Fèvre et al., 2003), and ensure that the imaging survey will not introduce any bias in galaxy samples selected for the spectroscopic survey.
The actual measured completeness limits are presented in section 6.2
3.3 The CFH12K camera
Observations have been carried out with the CFHT-12K camera build by CFHT and the University of Hawaii (Cuillandre et al, 2000). The CFH12K camera (http://www.cfht.hawaii.edu/Instruments/Imaging/CFH12K/) is a particularly powerful system. It is based on a mosaic of 12 3-edge buttable MIT/Lincoln-Labs. CCID20 thinned backside illuminated CCDs, each pixels for a total array size of pixels (18.4 cm 12.3 cm in physical size). The pixel size (15 microns) corresponds to a scale of 0.205 arcsec/pixel at CFHT prime focus, well adapted to the mean seeing at the CFHT prime focus (). It covers a field of view arcmin2. The camera is composed of two different types of CCDs. Three are high resisitivity chips and nine are epitaxial silicon devices. The high resistivity CCDs have better efficiency than the epitaxial beyond 500 nm, but are less efficient in the blue (see figure 2). This difference is corrected during the pre-processing step that rescales each CCD with respect to a reference device of the camera.
None of the CCDs has a readout noise higher than 6 electrons nor shows dark current signal over 1 hour time scale, which is largely sufficient for deep imaging surveys with sky background noise dominated images. The readout time is about one minute, which permits to easily split long exposures into short ones without increasing significantly the overheads. In addition to facilitate the construction of master flat fields and fringe patterns and to simplify the cosmic ray rejection process, the image splitting also permits a better control of the camera focus and to reject bad seeing exposures. The autonomy of the LN2 reservoir is much longer than a full single night observation process and we never detected any temperature drift during the 45 nights dedicated to the VIRMOS survey.
BVRI broad band filters are available on CFH12K. VRI are rather standard Mould filters, but B is special (see figure 2). They have been designed in order to cover the whole optical spectral range in a continuous manner. The photometric informations have therefore no gaps from one band to the other allowing to probe the whole redshift range from to continuously. This advantage is however obtained at the expense of photometric redshift accuracy for high- galaxies.

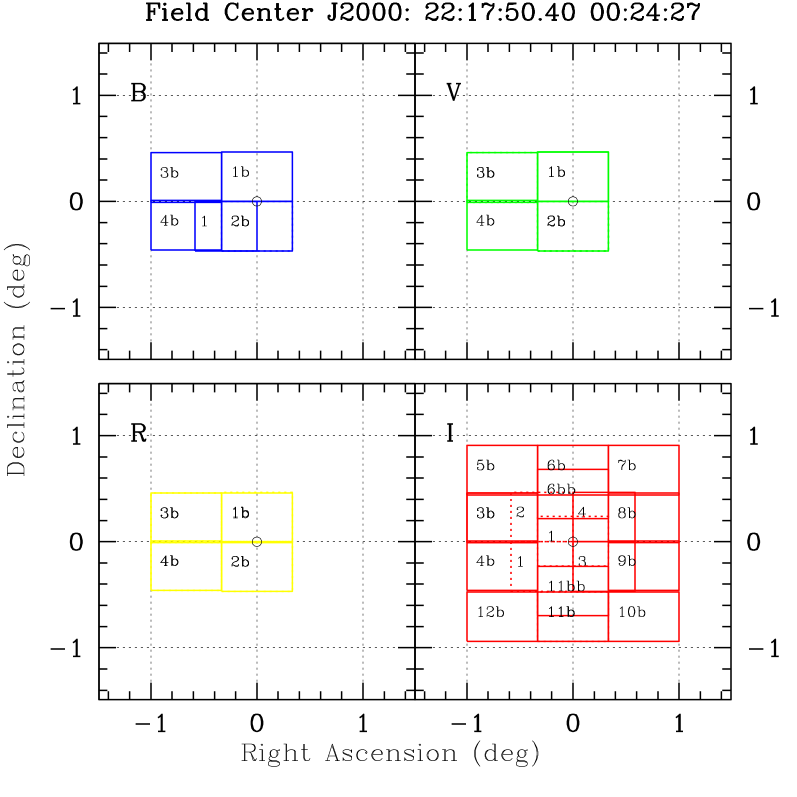
3.4 Observing strategy
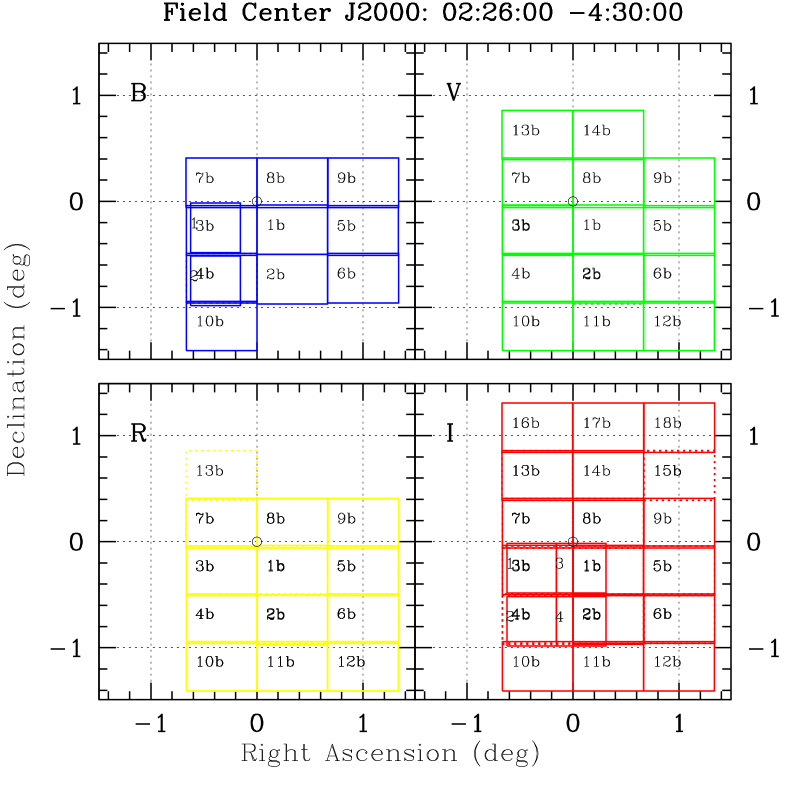
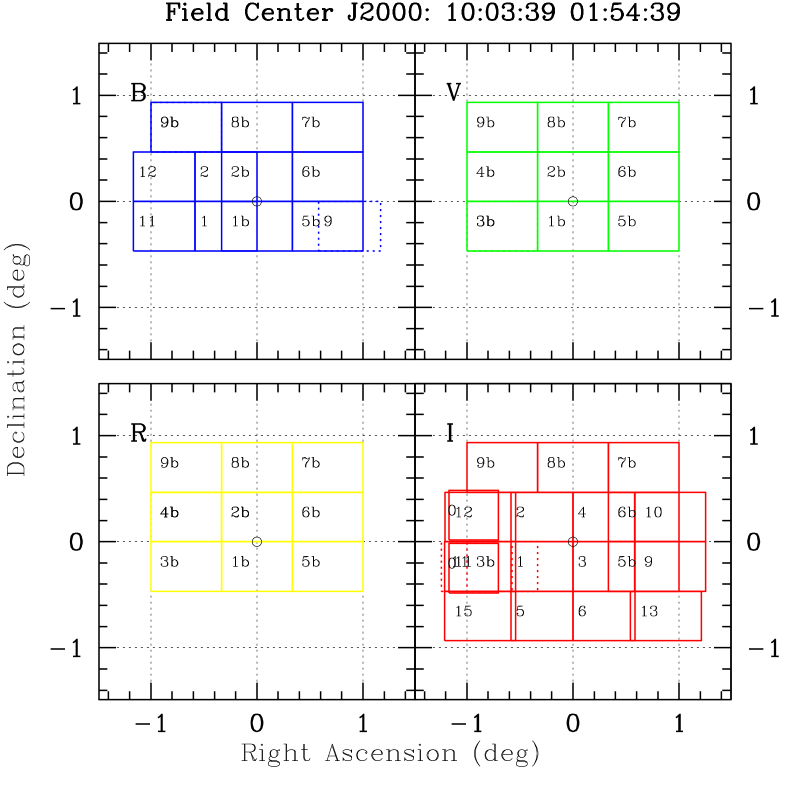
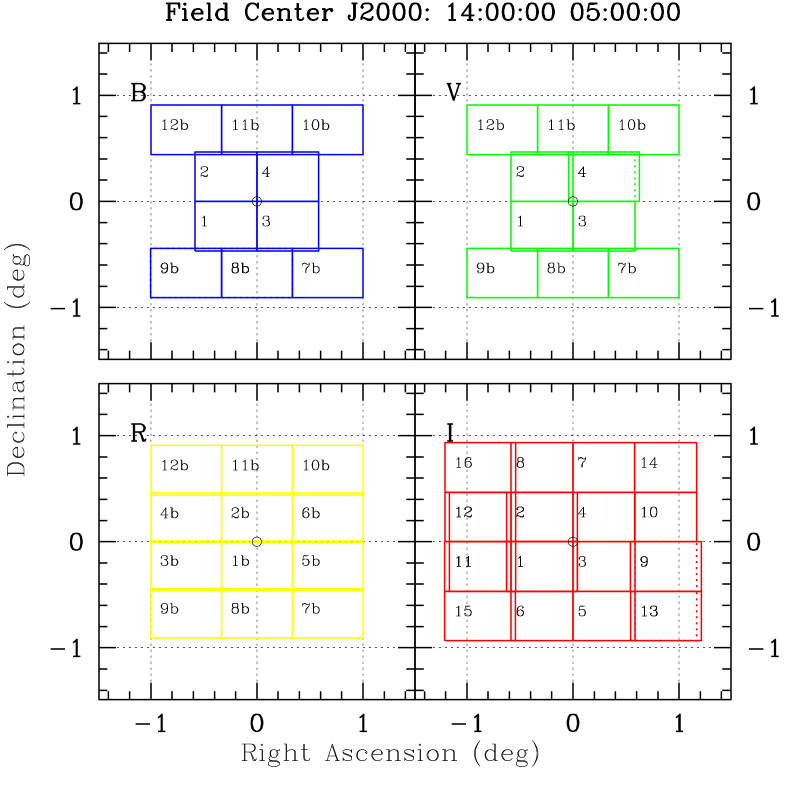
Each deg2 field has been divided in a series of CFH12K pointings covering the full area, with a slight overlap of arcsec between each pointing. A classical shift-and-add observing strategy has been adopted, each pointing being observed between 5 and 12 times depending on the filters and depth. Because during our first 2 observing runs 2 of the 12 CCDs were of poor quality, the grid of pointings has had to be adjusted to the available pixels for these runs. We started operating with arcmin2 fields, switching to the full arcmin2 field when new CCDs were installed in the first observing period of 2000. The field geometry is therefore non rectangular in some of the bandpasses.
5by several arcseconds (typically arcsec) between each exposure.
We aimed to bring first the I-band coverage to deg2 in each of the fields to ensure that reference catalogs would be available for the magnitude selected VIRMOS-VLT Deep redshift Survey. We have then completed the coverage in other bands in a uniform way, proportional to the actual number of clear nights.
During the acquisition of a sequence of exposures, the aperture flux of control stars was monitored for changes in photometric conditions. The exposure times were extended in case a loss of flux was detected during sub-exposures.
4 Observations
4.1 Observed pointings
The individual pointings observed are listed in http://www.oamp.fr/virmos, with the date of observations, the FWHM measured on point sources images on the detectors, and the corresponding CFHT archive files.
The final CFH12K mosaics resulting from the combination of these individual pointings are listed in Table.2 for each of the 4 fields and 4 bands, together with the resulting exposure times and limiting magnitudes ( in a 3 arcsec circular aperture).
| Field | Filter | Total Area | Exp. time |
|---|---|---|---|
| () | (mn) | ||
| 0230-04 | B | 3.9 | 120 |
| “Wide” | V | 4.17 | 90 |
| R | 3.6 | 60 | |
| I | 5.4 | 60 | |
| 0230-04 | B | 1.45 | 420 |
| “Deep” | V | 1.45 | 270 |
| R | 1.45 | 180 | |
| I | 1.45 | 120 | |
| 1003+01 | B | 3.0 | 120 |
| V | 2.94 | 90 | |
| R | 2.94 | 60 | |
| I | 4.14 | 60 | |
| 1400+05 | B | 2.85 | 120 |
| V | 2.85 | 90 | |
| R | 3.6 | 60 | |
| I | 4.32 | 60 | |
| 2217+00 | B | 1.14 | 120 |
| V | 1.14 | 90 | |
| R | 1.14 | 60 | |
| I | 3.6 | 60 |
4.2 calibrations
Standard photometric fields from Landolt (1992) have been acquired each night survey observations have been obtained. The fields SA92, SA101 and SA110, have been observed several times over the period 1999-2002 in order to check the reliability of the photometric calibration and the stability of the CFH12K performances. The detailed process of photometric calibration, relative from exposure to exposure within a set of exposures of a pointing in each bandpass, as well as the absolute flux calibration from the observed standards is described in details in (McCracken et al, 2003).
4.3 Image quality
The image quality of each exposure acquired for the survey is presented in Figure 3 for each of the bands. The median seeing is FWHM=0.75 arcsec in the I band but increases to 0.88 arcsec in V and R, and 0.97 arcsec in B. Moreover, the V and R seeing distributions are significantly broader than the I and B data sets. This trend reflects that atmospheric dispersion is negligible in I-band and increases towards the B-band. However, it mostly results from our observing strategy since we preferentially did I-band observations during good seeing periods in order to get high quality I-band selected catalogues for the VMOS spectroscopic sample as well as for the cosmic shear studies.

5 Data Processing
5.1 Pre-processing
All data are pre-processed using the FLIPS software package (Cuillandre et al., 2002). FLIPS (http://www.cfht.hawaii.edu/jcc/Flips/flips.html) is composed of C-language programs and Cshell commands that automatically generate master bias, dark and flat images, build a model of the fringe pattern and subtract the master bias, dark files and fringe pattern as well as the overscan to raw CFH12K images. Each pixel and each image is then rescaled to account for intrinsic efficiency. A binary mask image provided by CFHT at each observing run identifies all bad and hot pixels over each CCD of the camera. They are taken into account during the master file generation process. The final data products are pre-calibrated images that includes the description of the pre-processing history in the FITS header and the value of the CCD to CCD rescaling coefficient, according to the different gains of each CCD output and the quantum efficiency difference between epitaxial and high resisitivty CCDs. At this stage, all CCDs are therefore in the same ADU scaling units and arbitrarily normalised to the CCD#04 efficiency.
The FLIPS package has been installed at the Terapix center described below in order to handle the pre-processing locally.
5.2 The Terapix facility
The Terapix facility (http://terapix.iap.fr) has been set up as a French national center to handle the processing of large imaging cameras. The facility includes the hardware and software environment required to process data on a Terabyte scale. Three COMPACQ XP1000 workstations with up to 2 GB of RAM memory and connected to 4 Terabytes of hard discs installed in a secured raid-5 configuration have been devoted to the VIRMOS image processing (Mellier et al, 2002). Over the past four years, Terapix has processed more than 10,000 CFH12K images for the VIRMOS survey, totalling about 2.5 TB of input data. A database environment allows to streamline data access and storage.
5.3 Pipeline processing
Pipeline processing allows efficient data processing with excellent quality control. The stable behavior of the CFH-12K camera allows for very accurate bias, flat field, and fringing correction.
The pipeline software has been developped within the Terapix environment. The main steps are described in (McCracken et al, 2003) as well as in the Terapix progress reports (Mellier et al, 2002). The software tools developped for the object detection, image astrometry, photometry, pixel weighting and flaging, image resampling and stacking, object classification and catalogue construction are described at http://terapix.iap.fr/soft/ and can be downloaded freely from this site. The http://terapix.iap.fr/soft/releases.html also provides a documentation for all software tools.
The astrometric projection of all images into a common system used to build the large mosaic images has been developed to ensure an overall absolute calibration to the USNO reference catalogue (Monet et al, 98) accurate to better than 0.3 arcsecond, while the relative position accuracy within the catalogs is better than 0.1 arcsec r.m.s. The photometric calibration ensures that all individual images are calibrated on the same reference. Photometric zero point uncertainties are better than 0.1 magnitudes across the final mosaics. A detailled description and application of the pipeline, with a comprehensive description of quality assessments are described in (McCracken et al, 2003). Similar procedures applied to the wide VIRMOS survey and the deep U-band survey have been used by Gwyn et al (2003, in preparation) and Radovich et al (2003), respectively.
6 Results: survey images and catalogs
6.1 Field coverage
6.2 Catalog content
The catalogs are built using the SExtractor (Bertin & Arnouts, 1996). Particular care has been taken to ensure uniform source detection, using a matched xi-squared image (see Fig. 8) produced from the individual band images, or a local threshold algorithm. The difference between these two methods has been demonstrated to be marginal, with no effect in the magnitude range to the completness limit (McCracken et al, 2003).
Because of the large area covered, bright stars are present in the mosaics, creating increased background around them. In addition, there are areas in the images not useable for accurate photometry. These can be areas for which the signal to noise is too low like e.g. areas of overlap between individual CCDs, areas affected by internal reflexions or ghosts from bright stars around the field, or even areas affected by transient effects like satellite trails. Masks are therefore computed for each mosaic.
The catalogs contain the following information for each object extracted from the SExtractor V.2.3 used with the generic configuration files given in the Appendix and which were used as templates for all optical data from the CFH12K part of the survey:
-
•
Identifier
-
•
Positions:
-
–
X-IMAGE (pixel) , Y-IMAGE (pixel), and
-
–
ALPHA_J2000 (decimal degrees) and DELTA_J2000 (decimal degrees)
-
–
-
•
Flux and Magnitudes in the AB photometric system, defined as -2.5log(flux in ADU)+ZP (mag. zero point), including the associated errors:
-
–
the total flux and magnitude FLUX_AUTO (ADU), MAG_AUTO,
-
–
the isophotal flux and magnitude, FLUX_ISO (ADU), MAG_ISO,
-
–
the corrected isophotal flux and magnitude FLUX_ISOCOR (ADU), MAG_ISOCOR,
-
–
the best of mag_auto and mag_isocor, FLUX_BEST (ADU), MAG_BEST,
-
–
the aperture flux and magnitude FLUX_APER(2) (ADU), MAG_APER(2),
Colors can then be derived directly using the aperture magnitudes computed within the same aperture for all bands.
-
–
-
•
Shapes:
-
–
image size, KRON_RADIUS (pixel) and ISOAREA_IMAGE (pixel2),
-
–
major axis A_IMAGE (pixel) , A_WORLD (decimal degrees),
-
–
minor axis B_IMAGE (pixel), B_WORLD (decimal degrees) ,
-
–
position angle of main axes (all angles are measured counter-clockwise from the east. theta denotes the position angle between the major axis, ”a”, and the naxis1 (east-west) image axis), THETA_IMAGE (decimal degrees), THETA_J2000 (decimal degrees),
-
–
the values of the values of the weighted second moment matrix coefficients, X2_IMAGE (pixel2), Y2_IMAGE (pixel2), XY_IMAGE (pixel2),
-
–
X2_WORLD (decimal degees2), Y2_WORLD (decimal degees2), XY_WORLD (decimal degees2),
-
–
peak surface brightness MU_MAX (mag/arcsec2),
-
–
detection threshold above the background MU_THRESHOLD (mag/arcsec2).
-
–
-
•
Flags: several flags (FLAGS) are stored for each object. they indicate:
-
–
saturated pixels,
-
–
pixel located inside a masked area, as defined above.
-
–
Star-Galaxy classification: A star / galaxy classifier defined from the half-light radius vs. magnitude diagram (see (McCracken et al, 2003)). Stars are selected along the vertical branch at fixed radius corresponding to seeing disk size. This method initally described in (Fahlman et al, 1994) turns out to be more reliable than the initial CLASS_STAR of SExtractor,
-
–
The photometry and astrometry quality have been assessed through many quality checks. The positional accuracy has been checked against the USNO catalog. The photometry accuracy has been first assessed through the Elixir queue observing program part of the queue observations at CFHT, which monitors the photometric zero points accross nights. The magnitudes of objects common to adjacent CCDs have been compared and showed differences in the range 0.05–0.1 magnitudes. The comparison of colors for the bright stellar objects in the fields with the observed and predicted locus of stars has shown color errors less than 0.1 magnitudes. Counts of galaxies are in full agreement with the litterature. Finally, the angular correlation function shows similar shape and amplitude as from other imaging surveys. All these quality checks are extensively described in (McCracken et al, 2003). They ensure that the data are free of systematics before science analysis can be conducted.
In the I band, a total of 2.175 million objects have been detected. Among these, 1.15 million objects have , in the range of the VIRMOS-VLT Deep Survey.
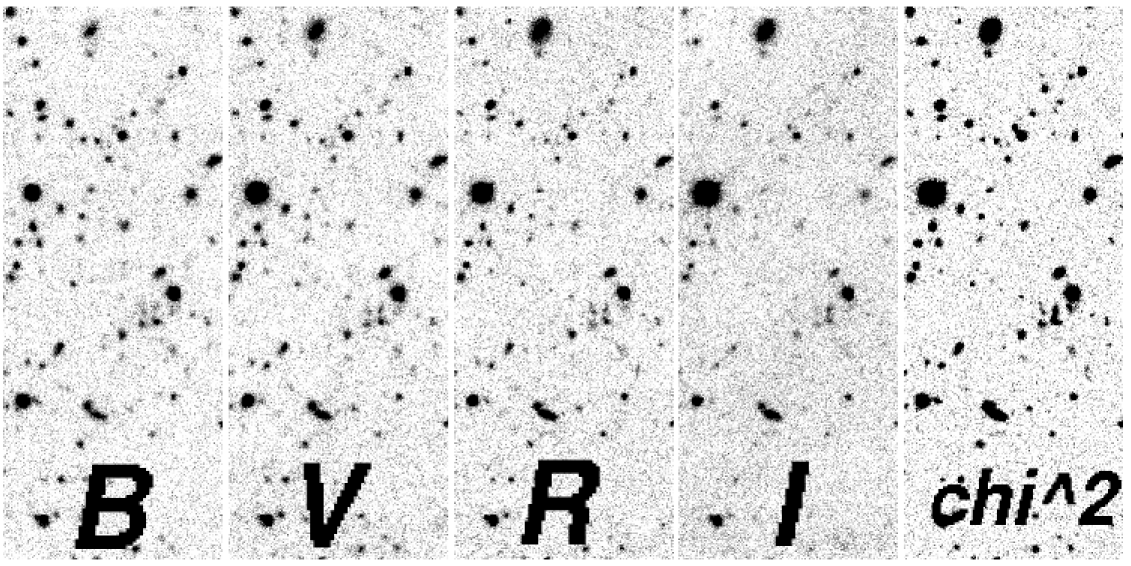
An example of a multi-color set is given in Figure 9.
6.3 Database access
All catalogs and mosaic images are stored in an interactive database implemented under the Oracle-8 environment. Specific database development have been conducted to allow for easy database query and data retrieval.
The catalogs are now in direct access to the CFHT-VIRMOS consortium. They will be released for general use for CFHT users starting July 1st, 2003 (http://www.oamp.fr/virmos). To access the database, first a password should be requested sending an email to virmos.database@oamp.fr.
The database allows to query the photometric catalog and to retrieve image sections. Any parameter listed in the photometric catalog can be used to define a user selection, e.g. magnitudes, colors, and/or positions. A user catalog is then produced with entries as selected by the user from the list of catalog parameters.
7 Conclusions
A deep imaging survey has been conducted in 4 high galacitic latitude areas with the CFH-12K camera. A total area of more than deg2 has been imaged in I band, and significant coverage of the survey area has been performed also in B, V and R.
Pipeline processing has been conducted at the Terapix facility at IAP to produce large mosaic images calibrated in astrometry and photometry.
Photometric catalogs containing positions, magnitudes, colors, shapes of more than 2 million objects have been produced for more than 17deg2 and quality control has been applied as described in joint papers. These catalogs and mosaic images will be released for general use starting July 1st, 2003, at http://www.oamp.fr/virmos.
While many scientific programs are under way, the survey has already been used for cosmic shear. The virmos-descart cfht survey (http://www.terapix.iap.fr/Descart/cfhtsurvey.html) primarily focusses on the I-band sample to measure galaxy shape with high accuracy and probe the dark matter properties and cosmological parameters. Because these cosmic shear results provide also an estimate of systematics on galaxy shapes and can be cross-checked with independent cosmic shear results from other teams, they also provide quality assessments on the VIRMOS data set. In addition to the detection of cosmic shear signal (van Waerbeke et al, 2000), constraints on , (van Waerbeke et al, 2002), the biasing properties of the dark matter (Hoekstra et al, 2002; Pen et al 2003a, ) as well is its non-Gaussian properties (Bernardeau et al, 2002; Pen et al 2003b, ) and the 3-dimension power spectrum of the dark matter (Pen et al 2003a, ) have already been provided using the VIRMOS survey for cosmic shear.
The VIMOS spectroscopic survey is now started at the ESO/VLT and more than 20,000 spectra have been collected (Le Fèvre et al, 2003). The joint U-band, optical, near infrared and spectroscopic informations are now under process to probe the star formation history, the clustering history of galaxies up to redshift 5 and the properties of the light and dark matter relations.
Acknowledgements.
We thank the CFHT time allocation committee for continuous support of this long term program, the CFHT staff for the execution of the observations performed in queue scheduling mode, the Terapix staff for its continuous help during the VIRMOS image processing period, the CNRS-INSU, CEA/DAPNIA and the Programme National de Cosmologie for support of the Terapix facility and IAP and OAMP for funding of this program.References
- Bernardeau et al (2002) Bernardeau, F., Mellier, Y., van Waerbeke, L., 2002, A&A 389, 28
- Bertin & Arnouts (1996) Bertin, E., Arnouts, S., 1996, A&AS 117, 393.
- Bondi et al (2003) Bondi, M., Ciliegi, P., Zamorani, G., Gregorini, L., Vettolani, P., Parma, P. et al. 2003, astro-ph/03030364
- Boulade et al (2000) Boulade, O., Charlot, X., Abbon, P., et al, 2000. Proc. SPIE 4008, 657
- Cuillandre et al (2000) Cuillandre, J.-C., Luppino, G.A., Starr, B.M., & Isani, S., 2000, in Proc. SPIE “Optical and IR telescope instrumentation and detectors”, Vol. 4008, 1010
- Fahlman et al (1994) Fahlman, G., Kaiser, N., Squires, G., Woods, D., 1994, ApJ 437, 56
- (7) Groom, D.E., in Proc. SPIE “Optical and IR telescope instrumentation and detectors”, Vol. 4008, 634
- Hoekstra et al (2002) Hoekstra, H., van Waerbeke, L., Gladders, D., Mellier, Y., 2002, ApJ 577, 604
- Kuijken et al (2002) Kuijken, K., Bender, R., Cappellaro, E., Muschielok, B., Baruffolo, A., et al, 2002. The Messenger 110, 15
- (10) Landolt, A.U., 1992, A.J., 104, 340
- Le Fèvre et al (2003) Le Fèvre, O. et al, 2003, The Messenger 111, 18.
- McMahon et al (2001) McMahon, R.G., Walton, N.A., Irwin, M.J., Lewis, J.R., Bunclark, P.S., Jones, D.H., 2001, NewAR 45, 97
- McCracken et al (2001) McCracken, H.J., Le Fèvre, O., Brodwin, M., Foucaud, S., Lilly, S.J., Crampton, D., & Mellier, Y., 2001, A&A, 376, 756
- McCracken et al (2003) McCracken, H.J., Radovich, M., Bertin, E., Mellier, Y., Dantel-Fort, M., Le Fèvre, O., Cuillandre, J.-C., Gwyn, S., Foucaud, S., Zamorani, G., 2003, A&A in press. astro-ph/03….
- Mellier et al (2002) Mellier, Y., Bertin, E., Bonnarel, F., de Coussemaker, N., Dantel-Fort, Didelon, P., Domisse, L., L’Hermitte, J., Magnard, F., McCracken, H., Missonnier, G., Morin, B., Radovich, M., Tissier, G., 2002, Terapix Progress Report : http://terapix.iap.fr/doc/doc.html
- Monet et al (98) Monet, D., et al, 1998. A Catalog of Astrometric Standards. US Naval Observatory.
- Miyazaki et al (2002) Miyazaki, S., Komiyama, Y., Sekigushi, M. et al, 2002, astro-ph/0211006
- Nonino et al (1999) Nonino, M.; Bertin, E.; da Costa, L.; Deul, E.; Erben, T.; Olsen, L.; Prandoni, I.; Scodeggio, M.; Wicenec, A.; Wichmann, R.; et al., 1999, A&AS 137, 51.
- (19) Pen, U.L., Zhang, T., van Waerbeke, L., Mellier, Y., Zhang, P., Dubinski, J., 2003b, ApJ in press. astro-ph/0302031
- (20) Pen, U.L., Lu, T., van Waerbeke, L., Mellier, Y., 2003a. MNRAS submitted. astro-ph/0304512.
- Pierre et al. (2003) Pierre, M., Valtchanov, I., Dos Santos, S., Altieri, B., Andreon, S., Bolzonella, M. et al., 2003, astro-ph/0305191
- Postman et al (1998) Postman, M., Lauer, T.R., Szapudi, I. & Oegerle, W., 1998, ApJ 506, 33
- Schlegel et al (1998) Schlegel, D.H., Finkbeiner, D.P., Davis, M., 1998, ApJ 500, 525.
- van Waerbeke et al (2000) van Waerbeke, L., Mellier, Y., Erben, T., et al., 2000, A&A 358, 30
- van Waerbeke et al (2002) van Waerbeke, L., Mellier, Y., Pello, R., Pen, U.L., McCracken, H., Jain, B., 2002, A&A 393, 369
- (26) van Waerbeke, L. & Mellier, Y., 2003, astro-ph/0305089
- Wilson (2003) Wilson, G., 2003, ApJ 585, 191
A1: SExtractor configuration files
Tables 3 and 4 list the parameters used for all -images and all wide field analysis of VIRMOS optical obervations with the CFH12K.
|
||||||||||||||||||||||||||||||||||||||||||||||||||||||||||||||||||||||||||||||||||||||||||||||||||||||||||||||||||||||||||||||||||||||||||||||||||||||||||||||||||||||||||
|
|||||||||||||||||||||||||||||||||||||||||||||||||||||||||||||||||||||||||||||||||||||||||||||||||||||||||||||||||||||||||||||||||||||||||||||||||||||||||||||||||||||||||||||||||||