Subaru High-Dispersion Spectroscopy of Narrow-Line Region
in the Seyfert Galaxy NGC 4151111
Based on data collected at Subaru Telescope, which is operated
by the National Astronomical Observatory of Japan.
Abstract
We report on a study of forbidden emission-line spectrum of nearby Seyfert 1.5 galaxy NGC 4151 based on the high-resolution () optical spectrum obtained by using the High Dispersion Spectrograph boarded on the Subaru Telescope. The profile parameters such as the emission-line widths, the velocity shifts from the recession velocity of the host galaxy, and the asymmetry indices, for emission lines including very faint ones such as [Ar iv]4712,4740 and [Fe vi]5631,5677, are investigated. Statistically significant correlations between the measured profile parameters and the critical densities of transitions are found while there are no meaningful correlations between the profile parameters and the ionization potentials of ions. By comparing the results with photoionization model calculations, we remark that a simple power-law distribution of the gas density which is independent of the radius from the nucleus cannot explain the observed correlation between the emission-line widths and the critical densities of the transitions. Taking the additional dense gas component expected to exist at the innermost of the narrow-line region into account, the observed correlations between the emission-line width and the critical density of the transitions can be understood since high-critical-density emission lines can arise at such relatively inner regions even if their ionization potentials are low. The observed correlation between the blueshift amounts of emission lines and the critical densities of the ions is also explained if such dense gas clouds located closer to the nucleus have larger outflowing velocities.
Subject headings:
galaxies: active - galaxies: individual (NGC 4151) - galaxies: ISM - galaxies: nuclei - galaxies: Seyfert1. INTRODUCTION
The narrow-line region (NLR) is one of fundamental ingredients of active galactic nuclei (AGNs), and many efforts have been made up to now to understand its physical, chemical, geometrical, and kinematic properties (see, e.g., Osterbrock & Mathews 1986). High spatial-resolution imaging observations have shown that NLRs consist of inhomogeneous and discrete gas clouds which are sometimes confined in a biconical structure (e.g., Tadhunter & Tsvetanov 1989; Evans et al. 1993; Macchetto et al. 1994; Boksenberg et al. 1995; Capetti, Axon, & Macchetto 1997; Ferruit et al. 1999). Some spectroscopic observations, on the other hand, have suggested that there is a density and/or ionization stratification in NLRs, which has been clarified mainly by correlations between emission-line widths and their ionization potential and/or critical density (e.g., Filippenko & Halpern 1984; De Robertis & Osterbrock 1984, 1986; Filippenko 1985; Veilleux 1991a; Alloin et al. 1992; see also Barth et al. 1999; Tran, Cohen, & Villar-Martin 2000). Thus it is now recognized that there are many discrete gas clouds with various properties, which are stratified in NLRs (see, e.g., Ferguson et al. 1997a; Ferguson, Korista, & Ferland 1997b).
This naturally leads to the following question; how does the density and/or ionization stratification exist in NLRs? In order to investigate this issue, high spatial-resolution spectroscopic observations have been performed recently (e.g., Kraemer et al. 2000; Kraemer & Crenshaw 2000). However, there are two drawbacks in this approach. First, this method is applicable only to very nearby AGNs. Each gas cloud in NLRs of rather distant AGNs is hard to be resolved spatially even by using HST. And second, even as for very nearby AGNs, the innermost region of NLRs (i.e., 1 pc) cannot be resolved spatially by the current ultraviolet/optical/infrared facilities. Since highly ionized gas clouds may be located in such an innermost region (e.g., Murayama & Taniguchi 1998a, 1998b; Nagao, Taniguchi, & Murayama 2000; Nagao, Murayama, & Taniguchi 2001b, 2001c; see also Barth et al. 1999; Tran et al. 2000), this drawback seems to be a very serious problem for studies of the structure of ionization and physical properties of NLRs.
One of complementary approaches for the high spatial-resolution observations is high spectral-resolution observations. By using high-dispersion spectra, we can investigate emission-line flux ratios as a function of a recession velocity, which contains information about the kinematic configuration of ionized gas clouds with various physical properties. Although high-dispersion spectra of only some very strong emission lines such as [O iii]5007 were taken to investigate kinematics of NLR clouds (e.g., Glaspey et al. 1976; Pelat & Alloin 1980; Pelat, Alloin, & Fosbury 1981; Pelat & Alloin 1982; Alloin et al. 1983; Vrtilek & Carleton 1985), it is difficult to explore the whole physical properties of NLR clouds solely from the [O iii]5007 line. In order to explore the nature of NLRs from the kinematical viewpoint, medium-resolution spectra of multi emission lines have been also investigated (e.g., De Robertis & Osterbrock 1984, 1986). However, Veilleux (1991c) reported that such medium-resolution spectroscopy tends to overestimate the emission-line widths while to underestimate the line asymmetries, owing to the instrumental broadening effect. Multi emission-line spectra with both high spectral resolution and high S/N are thus crucially necessary to understand the NLR clouds.
Appenzeller & Östreicher (1988) examined profiles of forbidden emission lines including some high-ionization emission lines by using high-resolution spectra ( km s-1). However, the signal-to-noise ratios of their data are not high enough to study the velocity profiles of weak lines in detail. Veilleux (1991b) presented multi emission-line spectra with both high spectral resolution ( 10 km s-1) and high S/N for 16 bright Seyfert galaxies (see also Veilleux 1991a, 1991c). However, the main concern of this work was to explore the statistical properties of NLR kinematics in general and thus the profiles of weak but important emission lines should be investigated further. Thus we have started a program in which optical spectra with a very high spectral resolution ( km s-1) and a very high signal-to-noise ratio for some nearby Seyfert galaxies are collected by using high-dispersion spectrograph (HDS; Noguchi et al. 2002) boarded on the 8.2m Subaru telescope (Kaifu 1998). In this paper, we report the first result of this program on the nearby Seyfert 1.5 galaxy NGC 4151222 Adopting a distance to NGC 4151 of 13.3 Mpc, 01 corresponds to a linear scale of 6.4 pc in the plane of the sky. (see Ulrich 2000 for a summary of the past observations for NGC 4151; see also Kaiser et al. 2000, Nelson et al. 2000 and Kraemer et al. 2000 for the recent results of a high spatial resolution spectroscopy of this object).
2. OBSERVATION AND DATA REDUCTION
| Emission Line | aaTaken from Bowen (1960). | Critical Density | Ionization Potential |
|---|---|---|---|
| () | (cm-3) | (eV) | |
| [O iii] | 4363.21 | 35.1 | |
| [Ar iv] | 4711.34 | 40.7 | |
| [Ar iv] | 4740.20 | 40.7 | |
| [O iii] | 4958.92 | 35.1 | |
| [O iii] | 5006.85 | 35.1 | |
| [Fe vi] | 5630.82 | 75.0 | |
| [Fe vi] | 5676.96 | 75.0 | |
| [Fe vii] | 5721.11 | 99.1 | |
| [N ii] | 5754.57 | 14.5 | |
| [Fe vii] | 6086.92 | 99.1 | |
| [O i] | 6300.32 | 0.0 |
2.1. Observation
We carried out spectroscopic observation of the Seyfert galaxy NGC 4151 by using HDS boarded on the Subaru telescope, on the 4th February 2002 (UT). The detector of HDS is a mosaic of two 4k 2k EEV CCD’s with 13.5 m pixels. We used the grating for the red spectra, whose central wavelength is set to 5600 . By this setting, one CCD covers a wavelength range of (from the 108th order to the 141st order) and the other CCD covers a range of (from the 86th order to the 106th order). A short-wavelength-cutoff filter of KV389 was used to obtain the whole wavelength range written above. We adopted 2 pixel binning for both wavelength and spatial directions on the chips. As a result of this binning, the spatial sampling rate was 0.24 arcsec/binnedpixel. By adopting a 0.80 arcsec (0.40 mm) slit width, we got spectra with a wavelength resolution of 45,000. The atmospheric dispersion compensator (ADC) was used in order to avoid photon losses caused by the atmospheric dispersion effect. The image rotator was also used by adopting the red setup. Note that the ADC and the image rotator do not degrade the spatial resolution. See Noguchi et al. (2002) for the wavelength dependences of the throughput of the ADC and the image rotator.
We carried out four 900 sec exposures for NGC 4151 with the position angle of 77 The typical seeing size was during the observation. We also obtained the spectrum of a spectroscopic standard star, BD+26 2606 (Oke & Gunn 1983), for flux calibration. The spectra of a halogen lamp and a thorium-argon lamp were also obtained for the flat field and the wavelength calibration, respectively.
2.2. Data Reduction
The data were reduced with the IRAF333 IRAF (Image Reduction and Analysis Facility) is distributed by the National Optical Astronomy Observatories, which is operated by the Association of Universities for Research in Astronomy, Inc. under corporative agreement with the National Science Foundation. package in the standard manner. Since the expected dark current of the CCD’s is 1 ADU/pixel for an hour (see Noguchi et al. 2002), we neglected the contribution of the dark current in this study. Although the data frames obtained by HDS include over-scan regions to be used for the bias subtraction, we did not use the over-scan data for the bias subtraction because the time variation of the bias level estimated by using the over-scan data was negligibly small. Instead of using the over-scan data, we simply subtracted the bias frame taken as the calibration data from the object frames. The cosmic-ray noise was removed by running the IRAF task “lineclean” for the object frames divided by the median-filtered object frames. The flat fielding was performed by dividing the object frames by the halogen lamp frame directly. By this process, the blaze profiles of the object frames were corrected very roughly (see Section 2.4 and Appendix A). The background subtraction was done by the “apscatter” routine of IRAF. This background component is thought to be attributed to reflections of the object light at the surface of the CCD’s and the field flattener lens just before the CCD’s (see Noguchi et al. 2002 for details). The wavelength calibration was carried out by using the thorium-argon spectra obtained before and after the observations of the objects. The measured rms wavelength error of the thorium-argon lines is less than 0.005 , which corresponds to 0.2 pixels at the bluest region in the spectra. By measuring the FWHM of thorium-argon lines in the wavelength-calibrated thorium-argon spectra, we confirmed the spectral resolution to be .
We extracted the nuclear spectra of the objects adopting the aperture size of 1.44 arcsec (i.e., 6 binned pixels), by using the IRAF task “apall”. Here we should mention that the resultant aperture for the extraction of the nuclear spectrum is , which is rather smaller than the spatial extension of the ionized gas clouds around the nucleus of NGC 4151 (e.g., Heckman & Balick 1983; Unger et al. 1987; Hutchings et al. 1998, 1999; Winge et al. 1999; see also Kaiser et al. 2000; Nelson et al. 2000; Kraemer et al. 2000). Although a large part of the NLR emission of NGC 4151 is covered by this adopted aperture since the position angle of the slit is along to the direction of the NLR extension (77 deg), some ionized gas clouds are missed in our analysis. We will see how the possible aperture effects can affect our discussion when necessary (in Section 4).


2.3. Flux Calibration
We performed the flux calibration by using the spectrum of a spectroscopic standard star, BD+26 2606, in order to correct the wavelength dependence of the sensitivity. Note that the absolute flux scale is not so accurate since the seeing size was so large that the slit loss of the photons is not negligible. This ambiguity of the flux scale does not affect the following analysis and discussion, because we do not refer any absolute fluxes of the emission lines and the continuum emission in this study.
In order to estimate the sensitivity function for each echelle order, the data of the absolute spectral energy distribution (SED) of BD+26 2606, sampled by a few , are necessary. We made the SED data by performing a 3rd polynomial fitting for the data presented by Oke & Gunn (1983). Since BD+26 2606 is a typical A-type star (), we can estimate the absolute SED by this fitting, except for the wavelength regions where the absorption feature is significant (e.g., the wavelength regions around H and H). We then determined the sensitivity function for each echelle order by comparing the observed spectra (in ADU) with the estimated absolute SED. As for the wavelength regions where the absolute SED cannot be estimated due to absorption features, we estimated the sensitivity functions by interpolating those of the neighboring echelle orders. The flux calibration of the spectra of NGC 4151 was then performed by using the estimated sensitivity functions. Note that the terrestrial absorption features are not corrected in this flux calibration manner. Such absorption features do not affect the analysis and the discussion.
2.4. Correction for the Blaze Profile
In general, spectra taken by echelle spectrographs have a blaze profile similar to a sinc function, which should be corrected in order to investigate some spectral features. The blaze profile can be in principle corrected by dividing the object frames by the flat frame, if the blaze profile would not change at all. However, the blaze profile of HDS is currently unstable with no systematic trend, i.e., the blaze profiles are different among the object frames, the standard-star frames, and the flat frames (see Aoki 2002). Due to this unstability of the blaze profile, significant artificial periodic features appear on the flux-calibrated order-combined spectrum. Since the amplitude of such features reaches up to % of the spectrum itself, it should be corrected in order to analyze the profiles of emission lines appropriately. Therefore we have carried out the blaze profile correction by adopting a method described at Appendix A in detail. As a result of the correction, the amplitude of the remaining artificial features is % of the continuum level.
3. RESULTS
| Emission Line | aaAsymmetry parameter, . See Heckman et al. (1981). | ||||||
|---|---|---|---|---|---|---|---|
| (km/s) | (km/s) | (km/s) | (km/s) | (km/s) | (km/s) | ||
| [O iii]4363 | 115 | 240 | 690 | –49 | –54 | –62 | +0.04 |
| [Ar iv]4712 | 87 | 223 | 430 | –24 | –9 | 0 | –0.11 |
| [Ar iv]4740 | 64 | 177 | 365 | –27 | –26 | –8 | –0.11 |
| [O iii]4959 | 94 | 211 | 504 | –37 | –40 | –74 | +0.15 |
| [O iii]5007 | 94 | 210 | 513 | –36 | –40 | –80 | +0.17 |
| [Fe vi]5631 | 72 | 191 | 354 | –15 | –23 | –28 | +0.08 |
| [Fe vi]5677 | 82 | 278 | 574 | –32 | –60 | –106 | +0.26 |
| [Fe vii]5721 | 128 | 250 | 522 | –38 | –41 | –61 | +0.09 |
| [N ii]5755 | 109 | 258 | bbNot measured since the blue wing of the [N ii]5755 emission is significantly affected by the red tail of the [Fe vii]5721 emission. | –40 | –42 | bbNot measured since the blue wing of the [N ii]5755 emission is significantly affected by the red tail of the [Fe vii]5721 emission. | bbNot measured since the blue wing of the [N ii]5755 emission is significantly affected by the red tail of the [Fe vii]5721 emission. |
| [Fe vii]6087 | 132 | 254 | 497 | –45 | –55 | –75 | +0.12 |
| [O i]6300 | 106 | 206 | 565 | –36 | –29 | –34 | –0.01 |
We present the flux-calibrated, blaze-profile-corrected spectrum of NGC 4151 in Figure 1. Note that the sky emission is not subtracted and thus the terrestrial [O i]6300,6363 airglow emission lines are also seen in this spectrum. These sky emission lines can be used to check the accuracy of the wavelength calibration. The measured wavelengths of these two emission lines are 6300.30 and 6363.78 , which are consistent with the theoretical wavelengths within 0.01 .
We show the profiles of the continuum-subtracted forbidden emission lines, i.e., [O iii]4363, [Ar iv]4712, [Ar iv]4740, [O iii]4959, [O iii]5007, [Fe vi]5631, [Fe vi]5677, [Fe vii]5721, [N ii]5755, [Fe vii]6087, and [O i]6300, in Figures 2a – 2k. The presented profiles are not corrected for the instrumental broadening since the effects of the instrumental broadening are evidently negligible. Indeed the [O i]6300 airglow emission seen in Figure 2k is much significantly narrower than the velocity features of the observed forbidden emission lines of NGC 4151. The origin of the horizontal axis coincides with the recession velocity of the peak of the [O iii]5007 emission, which is located at 5022.82 in the obtained spectrum. See Table 1 for the rest wavelengths we adopted for the forbidden lines, which are taken from Bowen (1960). The critical density of the transition and the ionization potential of the corresponding ion for each emission line are also given in this table. The spectral profile in the relative recession-velocity range of –1200 km s km s-1 is shown for each emission line. The continuum level for each emission line is estimated by interpolating the neighbor wavelength regions of the emission line linearly, except for [O iii]4363. Since this emission line is located on the broad wing of the H emission, we extract the profile of [O iii]4363 by interpolating the neighbor wavelength regions adopting the cubic spline fitting. In this figure, the flux level of each emission line is normalized by the flux density at the peak of the line, which is measured after performing a 5 pixels smoothing for the spectra. Note that we do not make attempts to extract the velocity profiles of blending forbidden lines, e.g., [O i]6363, [Fe x]6374, [N ii]6548,6583, and [S ii]6717,6731. This is because we cannot deblend the blended lines without some assumptions whose validity is hard to be examined. Because of the same reason, we do not investigate velocity profiles of the narrow component of permitted lines.
Here we should mention the contributions of other weak emission lines to the spectra presented in Figure 2. The emission line seen both at the red side of [Ar iv]4712 and at the blue side of [Ar iv]4740 is the blend of the [Ne iv]4724,4726 doublet (Figures 2b and 2c). This feature may contribute to the red-side tail of the [Ar iv]4712 emission. The emission-line feature seen at the blue side of [Fe vi]5631 is identified as [Ca vii]5616. Since the wavelengths of the [Fe vii]5721 and the [N ii]5755 emission are close in each other on the spectrum, the red-side tail of the [Fe vii]5721 emission and the blue-side tail of the [N ii]5755 are affected by their neighbor lines (particularly, the latter one is). To show how the [Fe vii]5721 emission affects the [N ii]5755 profile, we give a larger portion of the spectral region around the [N ii]5755 emission in Figure 3. The weak emission feature seen at the km s-1 of the [O i]6300 emission is [S iii]6312. We do not investigate these faint emission lines since the S/N of the data is not enough high to discuss their kinematic properties. Note that a possible contribution of [Ca v]6087 to [Fe vii]6087 has been sometimes suspected for spectra of Seyfert nuclei (e.g., Koski 1978; see also Appenzeller & Östreicher 1988). However, simple photoionization models predict that the flux ratio of [Ca v]6087/[Fe vii]6087 is always 0.1 for reasonable parameter ranges, which is confirmed by our calculations444 In the performed models, one-zone, dust-free gas clouds with the elemental abundances of the solar ones are assumed. The parameter ranges we examined are cm-3 and where and are the hydrogen density and the ionization parameter, respectively. by using the publicly available code version 94.00 (Ferland 1997, 2000). We thus neglect the possible contamination of the [Ca v]6087 emission to the [Fe vii]6087 emission in the following discussion.

We quantify the observed profiles of the emission lines presented in Figure 2, basically by adopting the manner of Heckman et al. (1981). For each emission line, we measure the full line widths at levels of 80%, 50%, and 20% of the peak intensity above the continuum (, , and , respectively). Note again that the effects of the instrumental broadening are not corrected owing to the high wavelength resolution of our observation. We also measure the velocities of the line centers at the three respective levels (, , and ). To quantify the asymmetries of each emission line, we measure the widths between and the edges of emission line of both side ( and for the left- and the right-side width from ; see Figure 2 of Heckman et al. 1981). And following to the manner of Heckman et al. (1981), we calculate an asymmetry index . Positive figures of this parameter denote the existence of pronounced excess at the blue side of the emission line, and vice versa. The measured parameters, i.e., , , , , , , and , for each emission line, are presented in Table 2. The measured recession velocities (, , and ) have once converted into the heliocentric ones, and the presented velocities are relative values to the (heliocentric) systemic recession velocity of NGC 4151 determined by the H i 21 cm emission ( km s-1; Heckman, Balick, & Sullivan 1978). We do not measure , , and for [N ii]5755, since the blue wing of this line appears to be significantly affected by the red tail of the [Fe vii]5721 emission (see Figure 3).
It is apparently shown that the observed forbidden lines are generally blueshifted relative to the systemic recession velocity of the host galaxy, NGC 4151. This has been frequently reported for many Seyfert galaxies (e.g., Heckman et al. 1981; Penston et al. 1984; Whittle 1985a; Schulz 1987; Veilleux 1991c). The observed value of for [O iii] of NGC 4151 is consistent with the previous high-dispersion spectroscopies (–45 km s-1, Vrtilek & Carleton 1985; –40 km s-1, Schulz 1987). The tendency that the asymmetry indices of most of emission lines suggest the blue-wing excess has been also seen for many Seyfert galaxies (e.g., Heckman et al. 1981; De Robertis & Osterbrock 1984; Vrtilek & Carleton 1985; Whittle 1985a; Veilleux 1991c; Moore et al. 1996). The measured emission-line widths tend to be narrower than the ones reported based on medium-dispersion (i.e., km s-1) spectroscopic observations of NGC 4151 (e.g., Heckman et al. 1981; De Robertis & Osterbrock 1984; Bochkarev, Shapovalova, & Zhekov 1991). This is thought to be the effect of the instrumental broadening. As described by Veilleux (1991c), the effect of the instrumental broadening on medium velocity-resolution spectra cannot be corrected completely by the classical quadratic subtraction method. Since the wavelength resolution of our observation is high enough, our results on the emission-line widths are much more reliable than those derived by the previous medium-dispersion spectroscopic observations.

We then investigate how the measured profile parameters of each line depend on or independent of the critical density and the ionization potential of the corresponding transitions. The full width and the central recession velocity of each level are plotted as a function of the critical density (Figures 4, 5) and of the ionization potential (Figures 6,7). In Figure 8, the asymmetry index is plotted as functions of the critical density and the ionization potential. As shown these figures apparently, clear correlations are seen between the measured profile parameters and the critical density while such correlations are not seen between the profile parameters and the ionization potential. To be more concrete, emission lines with a higher critical density show broader widths and bluer central recession velocities at any intensity level. In order to investigate the statistical significance of these tendencies, we apply Spearman’s rank-order correlation statistical test on the data. The null hypothesis is that each measured profile parameter is not correlated with the critical density or the ionization potential of the corresponding emission line. The resultant probabilities are given in Table 3. It is now statistically confirmed that any of the measured profile parameters are not correlated with the ionization potential of the corresponding ions while the parameters tend to correlate with the critical density of the transitions. The statistical significances of the correlations concerning the critical density are high for the core properties (i.e., and ) while those are statistically not significant for the wing properties (i.e., , , and ). The difference between the core and the wing may be intrinsic, but we cannot exclude the possibility that the measured base properties are affected by the blaze profile of the spectrum described in Section 2.4 and Appendix A. There is no statistically significant correlations between the asymmetry index and the critical density, and between and the ionization potential.

4. DISCUSSION
As described in the last section, the emission-line spectrum of NGC 4151 has the following two remarkable aspects. (1) The widths of the forbidden emission lines are well correlated with the critical density of the transitions while they are not correlated with the ionization potential of the corresponding ions. (2) The blueshift amounts of the forbidden emission lines are also well correlated with the critical density while there is no significant correlation between the blueshift amount and the ionization potential. We interpret these observational results and accordingly discuss the geometrical and kinematical nature of the NLR in NGC 4151. However, prior to discuss them, we have to mention the effects of a possible aperture effect on these results. Since the lower-ionization and the lower-critical-density lines tend to arise at the further distant places from the nucleus in general, we may miss the narrow, symmetric components for low-ionization and/or low-critical-density lines. Nevertheless the significant correlations between the critical density and the emission-line profiles are found. Since the possible aperture effect should work in an opposite trend, we can conclude that the observed correlations between the critical density and the emission-line profiles are real.
4.1. Emission-Line Width
Not only NGC 4151, many Seyfert galaxies also show similar tendencies about the emission-line widths; i.e., line widths are correlated with the critical density and/or the ionization potential (e.g., Filippenko & Halpern 1984; De Robertis & Osterbrock 1984, 1986; Veilleux 1991a; Alloin et al. 1992). The most simple interpretation for this is that the gas clouds are stratified in NLRs. In this scheme, the gas clouds with larger gas densities and with higher ionization degrees are located closer to the nucleus, where the gravitational potential is deeper than the outer part of NLRs and thus the velocity dispersion of gas clouds becomes relatively large. However, this simple scheme may be difficult to explain the cases that the emission-line widths are correlated only with the critical density or the ionization potential.
As for the case of NGC 4151, one of the high-critical-density forbidden emission lines, [N ii]5755, has a broader velocity width than the other low-critical-density emission lines despite its low-ionization potential, as shown in Figures 2, 3, and 4. A velocity width is thought to be closely related with a depth of the gravitational potential at the effective emitting region of the corresponding emission line. Thus the broadness of the [N ii]5755 emission suggests that emission lines with low-ionization potentials can arise at inner NLRs, at least in the nucleus of NGC 4151. How situation enables to realize such a condition? To investigate this issue, one of the most powerful approaches would be the locally optimally emitting cloud (LOC) photoionization model, which was originally constructed to explore the nature of broad-line regions in AGNs by Baldwin et al. (1995) and which was applied to NLRs later (Ferguson et al. 1997a, 1997b). In this model, gas clouds with a wide range of physical conditions are present at a wide range in the radial direction, and thus the net emission-line spectra can be calculated by integrating in the parameter space of the gas density and the radius, assuming some distribution functions. Therefore we can know the emissivity distribution of each emission line in the radial direction by integrating the results of this LOC models only for the gas density which can be used to discuss the difference of emission-line widths of various forbidden emission lines, assuming that the velocity dispersion of gas clouds is determined by the gravitational potential caused by the central supermassive black hole (see Ferguson et al. 1997a). Here we should mention that this assumption is rather inappropriate when gas clouds at outer NLRs are considered, because the gravitational potential caused by the host galaxy is not negligible at such an outer NLR. However, it seems very difficult to take the contribution of the host galaxy on the kinematics of NLR clouds into account adequately. This is because the gas motion of NLR clouds tends to be independent of the galactic rotation (e.g., Heckman et al. 1989), except for clouds at an outer part of very extended NLRs (see Pedlar et al. 1992 for the outer NLR in NGC 4151). The widths of forbidden lines tend to be correlated with the velocity dispersion of the bulge of host galaxies (e.g., Nelson & Whittle 1996; Boroson 2003), although such an effect is hard to be quantified for each point in NLRs. Thus, as for the gas clouds at outer NLRs, the moving velocities inferred by the LOC model tend to be smaller than the actual situation where the host galaxy contributes to the gravitational potential. We should be aware of these matters in the following discussion, although we do not take the effects of the host galaxy on the gas kinematics into account in this paper.

As shown in Figure 1 of Ferguson et al. (1997a), the emission-line strength of each transition reaches its peak where the gas density is comparable to the critical density of the transition and the ionization parameter (i.e., the radius) is preferred by the ionization degree of the corresponding ion. Therefore the radius of peak emissivity is in proportion to the square root of the critical density for a given ionization potential, which is apparent when the line-strength distributions of pairs of [O iii]4363,5007, [S ii]6717,6731, or [O ii]3727,7325 are compared in each other (see Figure 1 of Ferguson et al. 1997a). The radius is also in proportion to the square root of the ionization parameter for a given gas density by the definition. Here we focus on the behavior of the emission-line strengths of transitions with a high critical density but with a low ionization potential, such as [N ii]5755 and [O i]6300, on the density-radius planes in Figure 1 of Ferguson et al. (1997a). Such emission lines can arise from a cloud with a high density and at far from the nucleus. However, the ionization parameter of such a cloud becomes very low, and thus highly ionized ions cannot exist in such circumstances. Affected by the existence of such high-density and low-ionization-parameter gas clouds, the peak radius of emission lines with a high critical density and a low ionization potential tends to shift outward. That is, the radius of emissivity peaks depends more strongly on the ionization potential of the ions than on the critical density of the transition. See Appendix B where this issue is investigated more quantitatively.
De Robertis & Osterbrock (1986) also discussed this issue; i.e., the emission-line widths would be mainly dependent with the ionization potential of the ions if the density distributions are completely independent of the radius from the nucleus. They discussed the effects of the radial distance dependences of the gas density as follows. If the radial distance dependence of the density can be simply described by a power-law form, , then the ionization parameter of a cloud is written as
| (1) |
Therefore, for the case of , the ionization parameter depends on the radius as and thus the emission-line widths are expected to correlate only with the ionization potential but not to correlate with the critical density. On the contrary, for the case of , the ionization parameter becomes to be independent of the radius and thus the the emission-line widths are expected not to correlate with the ionization potential but to correlate with the critical density. Therefore, to explain the observed properties of emission-line profiles of NGC 4151, we should consider the radial distance dependences of the gas density.

Here one important concern is that NGC 4151 is a type 1.5 Seyfert galaxy and thus the inner regions of the dusty torus are not obscured. It is known that type 1 AGNs exhibit statistically stronger high-ionization forbidden emission lines in their spectra than type 2 AGNs (e.g., Cohen 1983; Murayama & Taniguchi 1998a; Nagao et al. 2000, 2001c). This suggests that the high-ionization lines emitting regions (hereafter “high-ionization nuclear emission-line regions (HINERs)”; Binette 1985; Murayama, Taniguchi, & Iwasawa 1998) are located very close to the nuclei (i.e., inner regions of dusty tori) and thus can be hidden when we see the nucleus from an edge-on view toward the dusty tori (e.g., Murayama & Taniguchi 1998a; Barth et al. 1999; Nagao et al. 2000; Tran et al. 2000; Nagao et al. 2001c) like broad-line regions. Murayama & Taniguchi (1998b) showed that this HINER component significantly contributes to the observed emission-line spectra of NLRs in type 1 AGNs (see also Nagao et al. 2001b). Therefore it seems natural to add this HINER component into the LOC model. If the gas clouds in HINER consist of preferentially high-dense ones, only high-critical-density emission lines are enhanced by introducing the HINER component. This assumption is consistent with the result of Nagao et al. (2001c) that the gas density of this HINER component should be very dense (i.e., cm-3) to explain the observed emission-line flux ratios of high-ionization forbidden lines. Taking this HINER component into account, the observed correlation between the emission-line width and the critical density of the transitions can be understood. See Appendix B where the effects of adding the HINER component into the LOC model are investigated.
4.2. Emission-Line Shifts
We then discuss the origin of the observed correlation between the blueshift amounts of the emission-line center and the critical densities of the transition shown in Figure 5. It has been often reported that the observed forbidden lines in Seyfert galaxies are blueshifted relative to the systemic recession velocity of the host galaxies (e.g., Heckman et al. 1981; Penston et al. 1984; Whittle 1985a; Schulz 1987; Veilleux 1991c). This has been interpreted that the gas clouds flow radially with some opacity sources, probably dust grains (e.g., Heckman et al. 1981). That is, if gas clouds flow outward in the medium with dust grains, outflowing clouds in the far side (i.e., in the receding hemisphere) suffer heavier extinction and thus the net blueward shift of emission lines can occur. Alternatively, infalling gas motions may be the origin of the blueshift if the gas clouds contain plenty of internal dust grains, because such gas clouds are ionized only on the side facing the ionizing continuum source and thus we can see only the receding gas clouds in the far side from an observer. Then, which situation is the case for NGC 4151? We investigate this problem by focusing on the observed correlation between blueshift amounts of the emission-line center and the critical densities of the transitions.
| Profile Parameter | Critical Density | Ionization Potential |
|---|---|---|
| 4.4 | 9.5 | |
| 4.7 | 4.9 | |
| 1.3 | 3.9 | |
| 2.6 | 6.9 | |
| 1.8 | 6.0 | |
| 2.4 | 8.7 | |
| 3.3 | 5.8 |
De Robertis & Shaw (1990) examined the behaviors of emission-line profiles for both the outflowing and infalling cases by performing kinematical model calculations. They showed the following two important results. (1) As for the outflowing case, a concentration of the dust distribution near the nucleus is required in order to generate more blueward shifts of the lines arising at inner NLRs than those arising at outer NLRs. (2) As for the infalling case, on the other hand, more blueward shifts of the lines arising at inner NLRs can be caused if high-dense gas clouds at such an inner NLR contains much internal dust grains. However, neither the former nor the latter situation seems unrealistic, because Nagao et al. (2003) recently reported that iron is not depleted in gas clouds in HINERs and thus the innermost part of NLRs is thought to be a dust-free circumstance. Here we it should be mentioned that De Robertis & Shaw (1990) pointed out that the existence of a dusty torus around the nucleus may play an important role when the profiles of high-ionization emission lines are discussed since they arise at the innermost part of NLRs, whose spatial extension may comparable to the scale of dusty tori. Taking this point into account, we propose the following situation to explain the observation. That is, in HINERs, the gas clouds without dust grains flow outward in the dust-free circumstance. However, due to the existence of the dusty torus, the receding gas clouds are obscured from an observer. The observed correlation between the blueshift amounts of the emission lines and the critical densities is then explained if the gas clouds located closer to the nucleus have higher gas densities and larger outflowing velocities. The schematic view of this idea is shown in Figure 9. Note that Erkens, Appenzeller, & Wagner (1997) also mentioned that the high-ionization-line emitting clouds flow outward radially, which causes relatively broad widths and blueward velocity shifts of high-ionization forbidden emission lines.
It should be noted that the above model shown in Figure 9 requires a special viewing angle from the observer toward the nucleus, since the receding HINER component is hard to be obscured by the torus when seen from a pole-on view toward the torus. The receding clouds are hidden effectively when our line of sight is near the edge of the torus. Indeed, there are a number of evidence which suggests that the viewing angle toward the nucleus of NGC 4151 is just to be such a special one. One of them is the type-switching phenomenon seen in NGC 4151 (e.g., Ayani & Maehara 1991); i.e., the broad component of Balmer lines has been disappeared from the optical spectrum of NGC 4151 (see also Antonucci & Cohen 1983; Penston & Perez 1984). This AGN-type switching phenomenon has been sometimes thought to be caused by a time variation of the optical thickness of patchy tori (e.g., Goodrich 1989; Tran, Osterbrock, & Martel 1992; Loska, Czerny, & Szczerba 1993; Aretxega et al. 1999). It has been pointed out that this variation results from the special viewing angle (i.e., through near the edge of the torus), which is consistent with the model proposed here (see, e.g., Kriss et al. 1995; Weymann et al. 1997). The column density of the neutral hydrogen in the line of sight toward the nucleus of NGC 4151 is also remarkable since it is significantly large among type 1 and type 1.5 Seyfert galaxies ( cm; e.g., Maisack & Yaqoob 1991; Yaqoob & Warwick 1991; Zdziarski, Johnson, & Magdziarz 1996; Warwick et al. 1996; George et al. 1998; Yang, Wilson, & Ferruit 2001). It is remarkable that the X-ray spectra taken by should consist of both absorbed and non-attenuated radiation (George et al. 1998). This implies that the absorbing material in the line of sight toward the nucleus has patchy structure and thus only a part of the nuclear emission can reach up to us without the attenuation. It should be also noted that the column density of the neutral hydrogen toward the nucleus of NGC 4151 is temporarily variable significantly (Yaqoob, Warwick, & Pounds 1989; Warwick et al. 1989; Fiore, Perola, & Romano 1990; Yaqoob & Warwick 1991). Recent high-spatial resolution optical spectroscopic observations have also suggested that the nucleus of NGC 4151 is viewed from the viewing angle near the edge of the torus (see, e.g., Figure 7 of Hutchings et al. 1998). All of the above facts suggests that we see the nucleus of NGC 4151 from the special viewing angle near the edge of the torus and thus the receding gas clouds in HINERs is effectively obscured by the torus, which is completely consistent with the model proposed for NGC 4151 in this paper.

5. SUMMARY
We carried out high-dispersion spectroscopy () of the NLR in NGC 4151 by using Subaru/HDS. The main findings by examining the obtained emission-line spectrum are as follows.
-
•
The emission-line centers are generally blueshifted relative to the systemic recession velocity of the host galaxy.
-
•
The widths and the blueshift amounts of emission lines are well correlated with the critical densities of the transitions.
-
•
The widths and the blueshift amounts of emission lines show no significant correlations with the ionization potentials of the ions.
To interpret the origin of these properties, we refer the results of the photoionization model calculations performed by Ferguson et al. (1997a), i.e., the LOC model. It is suggested that simple power-law distribution of gas density which is independent of the radius from the nucleus cannot explain the observed correlation between the emission-line widths and the critical densities of the transitions. However, taking the dense gas clouds expected to exist in HINERs into account, high-critical-density emission lines can arise at relatively inner regions of NLRs even if their ionization potential is low. We note that the observed correlation between the blueshift amounts of emission lines is also explained if such dense gas clouds located closer to the nucleus have larger outflowing velocities.
| Emission Line | Density | Radius aaFor the case of ergs s-1. This scales with the luminosity as . |
|---|---|---|
| (cm-3) | (cm) | |
| [O i]6300 | 108.0 bbThis is a lower limited value since our calculations examine the line emissivities only in the range of cm-3. See text for this issue. | 1021.2 |
| [Ar iv]4712 | 103.5 | 1019.7 |
| [Ar iv]4740 | 105.0 | 1018.7 |
| [O iii]5007 | 104.7 | 1019.2 |
| [O iii]4363 | 106.8 | 1018.3 |
| [N ii]5755 | 106.3 | 1019.7 |
| [Fe vii]6087 | 106.1 | 1018.7 |
Appendix A A. BLAZE PROFILE CORRECTION

In this Appendix, we describe our method of the blaze profile correction in detail (see also Section 2.4). In Figure 10, we give the spectra of the standard star BD+26 2606 which are not flux-calibrated and are not corrected for the blaze profile. The atmospheric absorption features and intrinsic metallic absorption lines are removed from the spectra, and a 15-pixel smoothing is performed. In this figure, the spectra have a curvature in some level, though they are expected to be intrinsically linear except for the region around a Balmer absorption feature (recall that BD+26 2606 is a typical A-type star). This is just the effect of the unstability of the blaze profile pattern, because the blaze profile pattern should be canceled when the standard-star frame has been divided by the flat flame, if the blaze profile pattern does not change. Although the blaze profile patterns are different among the orders, the difference is very gradual as a function of the echelle order. Since we know the intrinsic SED of BD+26 2606, we can estimate the correction function for the remaining blaze profile patterns and can perform the blaze profile correction, only as for BD+26 2606 itself. However, the estimated correction function about this standard star cannot be used to carry out the blaze profile correction for NGC 4151, because the blaze profile is not the same between the standard-star frame and the object frame. Therefore we should make the blaze profile correction for NGC 4151 by using the spectrum of NGC 4151 itself.
Being different from A-type stars, spectra of AGNs are far from featureless; i.e., various emission and absorption features are exhibited. However, as a first-order approximation, the power-law continuum emission component can be regarded to be linear in the wavelength range covered by one echelle order (). Therefore, in the same way as for BD+26 2606, the blaze profile of the spectrum of NGC 4151 can be corrected by using the power-law component of NGC 4151 itself, in principle. However unfortunately, the emission-line widths in the spectra of AGNs are so broad that we cannot extract the power-law component of NGC 4151 easily, except for some spectral regions without strong emission/absorption features. There are some roughly featureless wavelength regions in the spectrum of NGC 4151 — around 4600, 5400, and 6000, where the correction function for the blaze profile patterns can be estimated. Since the blaze profile pattern depends on the echelle order very smoothly (see Figure 10), we can perform the blaze profile correction for the whole range of the spectrum of NGC 4151 by using the three estimated correction functions. Note that there are weak emission/absorption features in the above three spectral regions. Such features should be removed carefully by comparing the neighboring echelle orders, when the correction functions are estimated.
As for the spectrum covered by the red CCD (i.e., from the 86th order to the 106th order), we used the correction function estimated at (the 99th and the 100th order). As for the spectrum covered by the blue CCD (i.e., from the 108th to the 141st order), we used the two correction functions, estimated at (from the 128th to the 134th order) and at (from the 108th to the 114 th order). The former correction function is adopted for correcting the blaze profile of the echelle orders from the 108th to the 114th, while the latter one is adopted for the orders from the 128th to the 141st. As for the orders from the 115th to the 127th, the interpolated correction functions, which are made by using the above two correction functions, are used. The resultant blaze-profile-corrected spectrum of NGC 4151 are shown in Figure 1.
Appendix B B. PHOTOIONIZATION MODEL CALCULATIONS
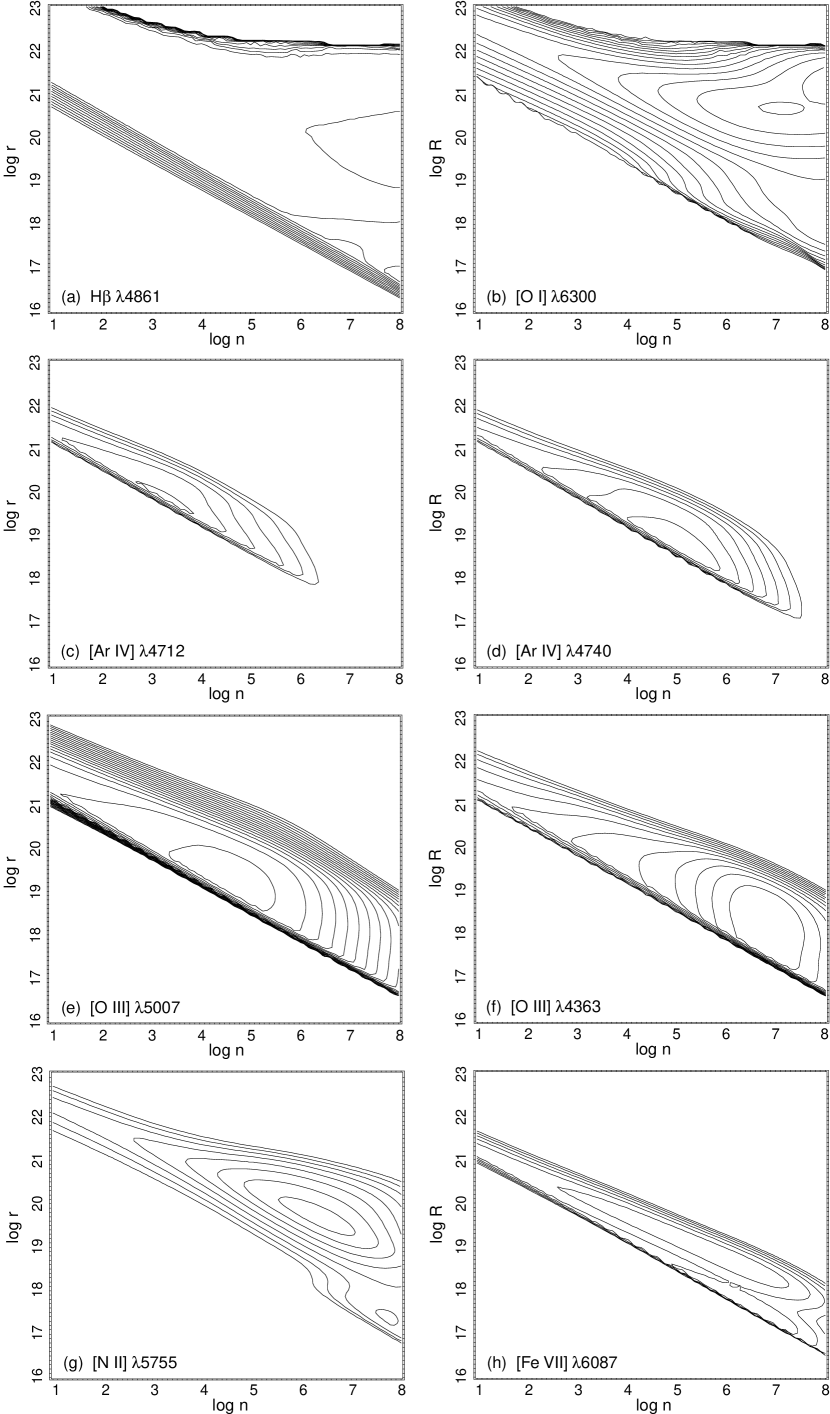
Here we present the results of our calculations of the LOC photoionization model. This presentation mainly aims to show the behaviors of emissivities of weak forbidden transitions such as [Ar iv]4712,4740 and [N ii]5755 on the LOC model which were not presented by Ferguson et al. (1997a), and to visualize the effect of taking the contribution of the additional HINER component into account.
For simplification, we assume dust-free, plane-parallel, and constant density gas clouds with the chemical abundances of the solar ones, which are taken from Grevesse & Anders (1989) with extensions by Grevesse & Noels (1993). As for the spectral energy distribution (SED) of the input ionizing continuum, we adopt the empirically constructed SED for typical Seyfert galaxies (Nagao, Murayama, & Taniguchi 2001a). This SED is described by the following function;
| (B1) |
(see Ferland 1997; Nagao et al. 2001a). Here the following parameter set is adopted (Nagao et al. 2001a): (i) the infrared cutoff of the big blue bump component, = 0.01 Ryd, (ii) the slope of the low-energy side of the big blue bump, = –0.5, (iii) the UV–to–X-ray spectral index, = –1.35, (iv) the slope of the X-ray power-law continuum, = –0.85, and (v) the characteristic temperature of the big blue bump, = 490,000 K. Note that the parameter in the equation (1) is determined from the adopted value of . The last term in equation (1) is not extrapolated below 1.36 eV or above 100 keV. Below 1.36 eV the last term is simply set to zero. Above 100 keV the continuum is assumed to fall off as . The luminosity of the ionizing continuum radiation is set to ergs s-1, which is a typical value for Seyfert galaxies. We investigate the output emission-line spectra from a gas cloud with a hydrogen density of cm-3 and a distance from the ionizing radiation of cm. The ionization parameters of gas clouds are determined when a pair of hydrogen density and distance from the nucleus is given. Note that this distance range scales with the luminosity as and thus does not mean an absolute one. The calculation are stopped when one of the following three conditions are met. First is when the electron temperature falls to 3000 K, below which the gas does not contribute significantly to the observed optical emission-line spectra. Second is when the cloud thickness exceeds 10% of its distance from the central source in order to keep gas clouds on the plane-parallel condition. And third is when the column density of gas clouds exceeds 1024 cm-2, beyond which the gas cloud becomes Thomson thick. See Ferguson et al. (1997a, 1997b) for details of the stopping criteria.
We show the results of photoionization model calculations in Figure 11, in which the contour maps of logarithm equivalent widths referred to the incident continuum at 4860 are presented. The contours of calculated equivalent widths of the lines appear to be roughly parallel to lines with a slope of log / log = –0.5, which corresponds to the condition of a constant ionization parameter. Our results are almost the same as those of Ferguson et al. (1997a) with small differences, which do not affect the following discussion significantly. Those differences are thought to be due to the difference in the adopted shape of the input SED and in the version of the code.
In Table 4, we give the pair of a hydrogen density and a radius from the nucleus which produces maximum equivalent width of each emission line. Here we do not take the radial distribution function of gas clouds into account, i.e., the values given in Table 4 mean the peak loci in the contour maps in Figure 11. Note that the density condition for the maximum equivalent width of [O i]6300, cm-3, is a lower limit value, since our calculations examine the line emissivities only in the range of cm-3. By the calculations of Ferguson et al. (1997a), it is shown that the hydrogen density which produces the maximum equivalent width of [O i]6300 is cm-1 (see Figure 1 of Ferguson et al. 1997a). As clearly presented in Figure 11 and Table 4, the radius which produces the maximum equivalent width of each emission line does not correspond to the critical density of each transition. For instance, the radii of the maximum equivalent widths of [O i]6300 and [N ii]5755 are larger than those of [Ar iv]4740 and [O iii]5007. However, this does not necessarily suggest that the effective line-emitting radius for emission lines is independent of the critical density of the transitions. This is because the effective line-emitting radius for each emission line is determined by how the gas clouds distribute in the density.
In order to examine the radial distribution of the strengths of the forbidden emission lines, the calculated emission-line fluxes should be integrated taking the distribution function of the gas clouds in density into account. The radial distribution of emission-line strength is thus given by
| (B2) |
where is the emission-line flux of a single cloud with a radius and a density , and is the adopted distribution function of gas clouds on the density.
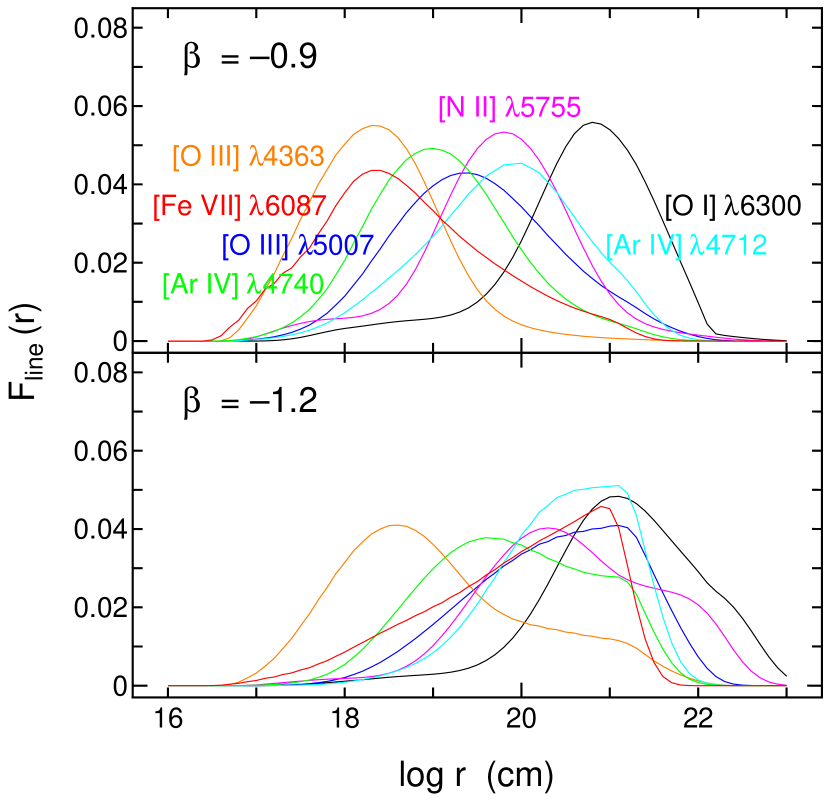
First, for the most simplified case, we adopt a simple power-law form as the distribution function of gas clouds on the density, i.e., . This is the assumption adopted by Ferguson et al. (1997a) (see also Baldwin et al. 1995; Ferguson et al. 1997b). The density range of the integration is from cm-3 to cm-3. Note that Ferguson et al. (1997a) reported that there is no significant difference on the results of integrations if gas clouds with cm-3 are included. In Figure 12, we show the results of the density integrations of the emission-line fluxes in the cases of = –0.9 and –1.2. In both cases, the effectively line-emitting radius of the emission lines is mainly dependent with the ionization potential of the ions but is not well dependent with the critical density of the transitions; e.g., the effectively line-emitting radii of the [O i]6300 emission and the [N ii]5755 emission is relatively large comparing to other emission lines. That is, the resultant radial dependences of emission lines are not to be expected for NGC 4151.
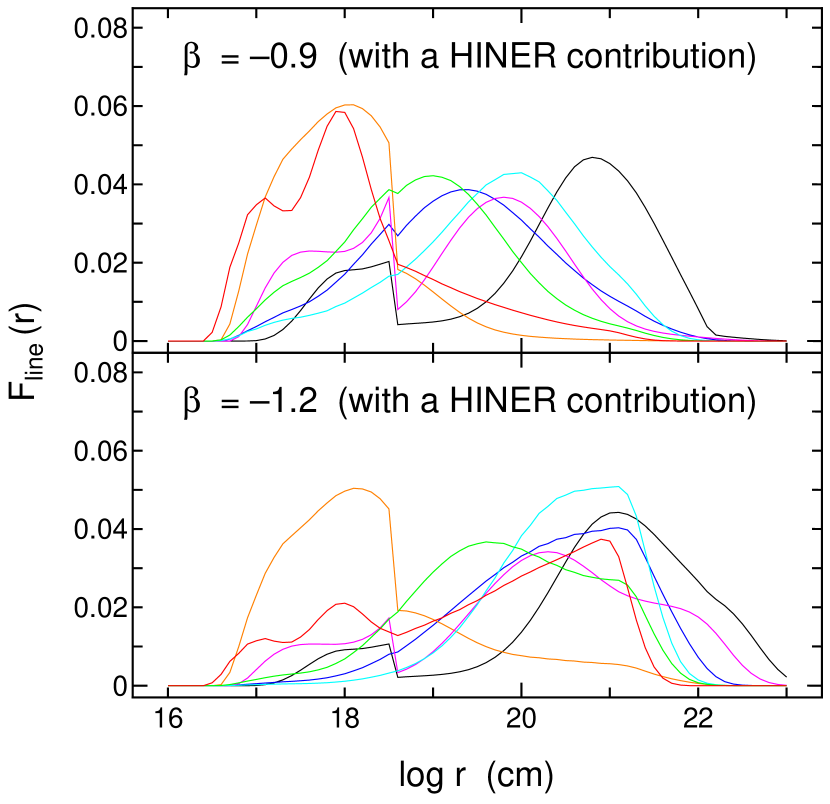
Then, we consider the density integration taking the contribution of the HINER component into account. We adopt the following function as a density distribution;
| (B3) |
where is an arbitrary constant, and the two parameters, and , characterize the HINER component in the LOC model. Again the density range for the integration is from cm-3 to cm-3. We perform the density integration by equation (2) assuming cm and cm-3. In Figure 13, we show the results of the density integrations of the emission-line fluxes in the cases of = –0.9 and –1.2. As shown in this figure clearly, emission lines with high critical densities are enhanced in the HINERs while emission lines with low critical densities are scarcely affected by introducing the HINER component. In other words, the dependences of emission-line widths on the critical density of the transitions can be explained by introducing the HINER component.
References
- (1)
- (2) Alloin, D., Bica, E., Bonatto, C., & Prugniel, P. 1992, A&A, 266, 117
- (3) Alloin, D., Pelat, D., Boksenberg, A., & Sargent, W. L. W. 1983, ApJ, 275, 493
- (4) Antonucci, R. R. J., & Cohen, R. D. 1983, ApJ, 271, 564
- (5) Aoki, W. 2002, Subaru Telescope High Dispersion Spectrograph User Manual ver. 1.1.1 (National Astronomical Observatory of Japan)
- (6) Appenzeller, I., & Östreicher, R. 1988, AJ, 95, 45
- (7) Aretxaga, I., Joguet, B., Kunth, D., Melnick, J., & Terlevich, R. J. 1999, ApJ, 519, L123
- (8) Ayani, K., & Maehara, H. 1991, PASJ, 43, L1
- (9) Baldwin, J. A., Ferland, G. J., Korista, K. T., & Verner, D. A. 1995, ApJ, 455, L119
- (10) Barth, A. J., Tran, H. D., Brotherton, M. S., Filippenko, A. V., Ho, L. C., van Breugel, W., Antonucci, R., & Goodrich, R. W. 1999, AJ, 118, 1609
- (11) Binette, L. 1985, A&A, 143, 334
- (12) Bochkarev, N. G., Shapovalova, A. I., & Zhekov, S. A. 1991, AJ, 102, 1278
- (13) Boksenberg, A., et al. 1995, ApJ, 440, 151
- (14) Bowen, I. S. 1960, ApJ, 132, 1
- (15) Capetti, A., Axon, D. J., & Macchetto, F. D. 1997, ApJ, 487, 560
- (16) Cohen, R. D. 1983, ApJ, 273, 489
- (17) De Robertis, M. M., & Osterbrock, D. E. 1984, ApJ, 286, 171
- (18) De Robertis, M. M., & Osterbrock, D. E. 1986, ApJ, 301, 727
- (19) De Robertis, M. M., & Shaw, R. A. 1990, ApJ, 348, 421
- (20) Erkens, U., Appenzeller, I., & Wagner, S. 1997, A&A, 323, 707
- (21) Evans, I. N., Tsvetanov, Z., Kriss, G. A., Ford, H. C., Caganoff, S., & Koratkar, A. P. 1993, ApJ, 417, 82
- (22) Ferguson, J. W., Korista, K. T., Baldwin, J. A., & Ferland, G. J. 1997a, ApJ, 487, 122
- (23) Ferguson, J. W., Korista, K. T., & Ferland, G. J. 1997b, ApJS, 110, 287
- (24) Ferland, G. J. 1997, Hazy: A Brief Introduction to 94.00 (Lexington: Univ. Kentucky Dept. Phys. Astron.)
- (25) Ferland, G. J. 2000, Revista Mexicana de Astronomia y Astrofisica, 9, 153
- (26) Ferruit, P., Wilson, A. S., Falcke, H., Simpson, C., Pcontal, E., & Durret, F. 1999, MNRAS, 309, 1
- (27) Filippenko, A. V. 1985, ApJ, 289, 475
- (28) Filippenko, A. V., & Halpern, J. P. 1984, ApJ, 285, 458
- (29) Fiore, F., Perola, G. C., & Romano, M. 1990, MNRAS, 243, 522
- (30) George, I. M., Turner, T. J., Netzer, H., Nandra, K., Mushotzky, R. F., & Yaqoob, T. 1998, ApJS, 114, 73
- (31) Glaspey, J. W., Eilek, J. A., Fahlman, G. G., & Auman, J. R. 1976, ApJ, 203, 335
- (32) Goodrich, R. W. 1989, ApJ, 340. 190
- (33) Grevesse, N., & Anders, E. 1989, in AIP Conf. Proc. 183, Cosmic Abundance of Matter, ed. C. J. Waddington (New York: AIP), 1
- (34) Grevesse, N., & Noels, A. 1993, in Origin and Evolution of the Elements, eds. N. Prantzos, E. Vangioni-Flam, & M. Casse (Cambridge Univ. Press), 15
- (35) Heckman, T. M., & Balick, B. 1983, ApJ, 268, 102
- (36) Heckman, T. M., Balick, B., & Sullivan, W. T. 1978, ApJ, 224, 745
- (37) Heckman, T. M., Blitz, L., Wilson, A. S., Armus, L., & Miley, G. K. 1989, ApJ, 342, 735
- (38) Heckman, T. M., Miley, G. K., van Breugel, W. J. M., & Butcher, H. R. 1981, ApJ, 247, 403
- (39) Hutchings, J. B., et al. 1998, ApJ, 492, L115
- (40) Hutchings, J. B., et al. 1999, AJ, 118, 2101
- (41) Kaifu, N. 1998, SPIE, 3352, 14
- (42) Kaiser, M. E., et al. 2000, ApJ, 528, 260
- (43) Koski, A. T. 1978, ApJ, 223, 56
- (44) Kraemer, S. B., & Crenshaw, D. M. 2000, ApJ, 544, 763
- (45) Kraemer, S. B., Crenshaw, D. M., Hutchings, J. B., Gull, T. R., Kaiser, M. E., Nelson, C. H., & Weistrop, D. 2000, ApJ, 531, 278
- (46) Kriss, G. A., Davidson, A. F., Zheng, W., Kruk, J. W., & Espey, B. R. 1995, ApJ, 454, L7
- (47) Loska, Z., Czerny, B., & Szczerba, R. 1993, MNRAS, 262, L31
- (48) Macchetto, F., Capetti, A., Sparke, W. B., Axon, D. J., & Boksenberg, A. 1994, ApJ, 435, L15
- (49) Maisack, M., & Yaqoob, T. 1991, A&A, 249, 25
- (50) Moore, D., Cohen, R. D., & Marcy, G. W. 1996, ApJ, 470, 280
- (51) Murayama, T., & Taniguchi, Y. 1998a, ApJ, 497, L9
- (52) Murayama, T., & Taniguchi, Y. 1998b, ApJ, 503, L115
- (53) Murayama, T., Taniguchi, Y., & Iwasawa, K. 1998, AJ, 115, 460
- (54) Nagao, T., Murayama, T., Shioya, Y., & Taniguchi, Y. 2003, AJ, 125, 1729
- (55) Nagao, T., Murayama, T., & Taniguchi, Y. 2001a, ApJ, 546, 744
- (56) Nagao, T., Murayama, T., & Taniguchi, Y. 2001b, ApJ, 549, 155
- (57) Nagao, T., Murayama, T., & Taniguchi, Y. 2001c, PASJ, 53, 629
- (58) Nagao, T., Taniguchi, Y., & Murayama, T. 2000, AJ, 119, 2605
- (59) Nelson, C. H., Weistrop, D., Hutchings, J. B., Crenshaw, D. M., Gull, T. R., Kaiser, M. E., Kraemer, S. B., & Lindler, D. 2000, ApJ, 531, 257
- (60) Nelson, C. H., & Whittle, M. 1996, ApJ, 465, 96
- (61) Noguchi, K., et al. 2002, PASJ, 54, 855
- (62) Oke, J. B., & Gunn, J. E. 1983, ApJ, 266, 713
- (63) Osterbrock, D. E., & Mathews, W. G. 1986, ARA&A, 24, 171
- (64) Pedlar, A., Howley, P., Axon, D. J., & Unger, S. W. 1992, MNRAS, 259, 369
- (65) Pelat, D., & Alloin, D. 1980, A&A, 81, 172
- (66) Pelat, D., & Alloin, D. 1982, A&A, 105, 335
- (67) Pelat, D., Alloin, D., & Fosbury, R. A. E. 1981, MNRAS, 195, 787
- (68) Penston, M. V., Fosbury, R. A. E., Boksenberg, A., Ward, M. J., & Wilson, A. S. 1984, MNRAS, 208, 347
- (69) Penston, M. V., & Pérez, E. 1984, MNRAS, 211, L33
- (70) Schulz, H. 1987, A&A, 178, 7
- (71) Tadhunter, C., & Tsvetanov, Z. 1989, Nature, 341, 422
- (72) Tran, H. D., Cohen, M. H., & Villar-Martin, M. 2000, AJ, 120, 562
- (73) Tran, H. D., Osterbrock, D. E., & Martel, A. 1992, AJ, 104, 2072
- (74) Ulrich, M. -H. 2000, A&A Rev., 10, 135
- (75) Unger, S. W., Pedlar, A., Axon, D. J., Whittle, M., Meurs, E. J. A., & Ward, M. J. 1987, MNRAS, 228, 671
- (76) Veilleux, S. 1991a, ApJ, 369, 331
- (77) Veilleux, S. 1991b, ApJS, 75, 357
- (78) Veilleux, S. 1991c, ApJS, 75, 383
- (79) Vrtilek, J. M., & Carleton, N. P. 1985, ApJ, 294, 106
- (80) Warwick, R. S., et al. 1996, ApJ, 470, 349
- (81) Warwick, R. S., Yaqoob, T., Pounds, K. A., Matsuoka, M., & Yamauchi, M. 1989, PASJ, 41, 721
- (82) Weymann, R. J., Morris, S. L., Gray, M. E., & Hutchings, J. B. 1997, ApJ, 483, 717
- (83) Whittle, M. 1985, MNRAS, 213, 1
- (84) Winge, C., Axon, D. J., Macchetto, F. D., Capetti, A., & Marconi, A. 1999, ApJ, 519, 134
- (85) Yang, Y., Wilson, A. S., & Ferruit, P. 2001, ApJ, 563, 124
- (86) Yaqoob, T., & Warwick, R. S. 1991, MNRAS, 248, 773
- (87) Yaqoob, T., Warwick, R. S., & Pounds, K. A. 1989, MNRAS, 236, 153
- (88) Zdziarski, A. A., Johnson, W. N., & Magdziarz, P. 1996, MNRAS, 283, 193
- (89)