Star Formation at z6: -dropouts in the ACS GTO fields11affiliation: Based on observations made with the NASA/ESA Hubble Space Telescope, which is operated by the Association of Universities for Research in Astronomy, Inc., under NASA contract NAS 5-26555. These observations are associated with programs #7817,9290,9301,9583. 22affiliation: Based on observations collected at the European Southern Observatory, Paranal, Chile (LP166.A-0701)
Abstract
Using an dropout criterion, we determine the space density of galaxies from two deep ACS GTO fields with deep optical-IR imaging. A total of 23 objects are found over 46 arcmin2, or 0.50.1 objects arcmin-2 down to (6), or a completeness-corrected 0.50.2 objects arcmin-2 down to (including one probable AGN). Combining deep ISAAC data for our RDCS1252-2927 field ( and (5 )) and NICMOS data for the HDF North ( and 27.3 (5 )), we verify that these dropouts have relatively flat spectral slopes as one would expect for star-forming objects at . Compared to the average-color () -dropout in the Steidel et al. (1999) sample, -dropouts in our sample range in luminosity from 1.5 () to 0.3 () with the exception of one very bright candidate at . The half-light radii vary from 0.09′′ to 0.29′′, or 0.5 kpc to 1.7 kpc. We derive the rest-frame UV luminosity density (or star formation rate density) using three different procedures. All three procedures make use of simulations based on a slightly lower redshift () -dropout sample from CDF South ACS images. First, we make a direct comparison of our findings with a no-evolution projection of this -dropout sample, allowing us to automatically correct for the light lost at faint magnitudes or lower surface brightnesses. We find 2325% more -dropouts than we predict, consistent with no strong evolution over this redshift range. Adopting previous results to (Bouwens, Broadhurst, & Illingworth 2003; Thompson et al. 2001), this works out to a mere % drop in the luminosity density from to . Second, we use the same -dropout simulations to derive a detailed selection function for our -dropout sample and compute the -luminosity density ( down to ). We find a % drop over the same redshift range (), consistent with the first estimate. This is our preferred value and suggests a star formation rate of to , or extrapolating the luminosity function to the faint limit. Third, we follow a very similar procedure, except that we assume no incompleteness, finding a rest-frame continuum luminosity density which is lower than our other two determinations. This final estimate is to be taken as a lower limit, and is important in the event that there are modest changes in the colors or surface brightnesses from to (the other estimates assume no large changes in the intrinsic selectability of objects). We note that all three estimates are well within the canonical range of luminosity densities (e.g., Madau, Haardt, & Rees 1999) necessary for reionization of the universe at this epoch by star-forming galaxies.
1 Introduction
The Hubble Deep Field (HDF) campaign has been highly influential in shaping our understanding of star formation in the high-redshift universe (Williams et al. 1996; Casertano et al. 2000; Ferguson, Dickinson, & Williams 2000). Early results demonstrated that the star formation rate density–as measured from the rest-frame continuum UV–increased from to an apparent peak around (Lilly et al. 1996; Madau et al. 1996; Connolly et al. 1997; Cowie et al. 1999). While these results were largely solidified by Steidel et al. (1999) with his wide-area -dropout survey, the addition of NICMOS data to the HDF North demonstrated that this trend continued to (Thompson et al. 1999; Deltorn et al. 2003; Bouwens, Broadhurst, & Illingworth 2003, hereafter denoted BBI).
Unfortunately, these studies were limited enough in area to raise doubts about how representative they really were of the high-redshift universe. They also suffered from a lack of deep high-resolution imaging at wavelengths intermediate between the optical regime and the near infrared, necessary for obtaining a more detailed look at the universe. Deep NICMOS observations have been useful in addressing this latter shortcoming, but only partially due to its small field of view. Fortunately, the installation of the Advanced Camera for Surveys (ACS) (Ford et al. 1998) on the Hubble Space Telescope has helped to redress several of these issues, including crucially for the first time imaging in the -band, permitting a more secure detection of objects at high redshift (). Moreover, its 10 improvement over WFPC2 in surveying capability allows large areas to be surveyed to nearly HDF depths (Ford et al. 2003), the Great Observatories Origins Deep Survey (GOODS) being a notable example (Dickinson & Giavalisco 2002).
Here, we describe some early work done using deep ACS data to extend these searches to , to establish the prevalence of galaxies in this era. Interest in star formation at has been particularly intense as of late because of recent absorption line studies on 3 QSOs at , suggesting that reionization may have happened at about this epoch (Fan et al. 2001; Becker et al. 2001; Fan et al. 2002). In this work, we consider two fields from the ACS GTO program, RDCS1252-2927 and the HDF North, in our search for objects. Both fields have deep ACS and data, and infrared observations, important for securely identifying objects. Relative to other work (Yan et al. 2003; Stanway, Bunker, & McMahon 2003), the present search is slightly deeper, with better IR data to confirm the redshift identifications. In fact, our use of the HDF North field is especially propitious, given the exceptionally deep WFPC2 and NICMOS images available to examine faint candidates. We put this new population in context by comparing them with lower-redshift expectations, projecting galaxy samples from CDF South GOODS to using our cloning formalism previously used in work on the HDFs (Bouwens, Broadhurst, & Silk 1998a,b; BBI).
We begin by presenting our data sets, describing our procedure for doing object detection and photometry, and finally discussing our -dropout selection criterion (§2). In §3, we present our results. In §4, we describe a comparison against the wide-area GOODS sample and then use these simulations to make three different estimates of the rest-frame continuum luminosity density (§5). Finally, in and , we discuss and summarize our findings. Note that we denote the , , , and bands as , , , and , respectively, and we assume [,,] = [0.3,0.7,0.7] in accordance with the recent Wilkinson Microwave Anisotropy Probe (WMAP) results (Bennett et al. 2003).
2 Observations
2.1 Data
There are two different fields from our ACS GTO program which are particularly useful for -dropout searches. The first involves deep ACS WFC and images of RDCS1252-2927, a cluster. RDCS1252-2927 was selected from the ROSAT Deep Cluster Survey (Rosati et al. 1998; Rosati et al. 2003). Three orbits in and five orbits in were obtained at four overlapping pointings, arranged in a 2x2 grid with an overlap of 1 arcmin so that the overlapping regions (10 arcmin2) were covered to a depth of six orbits in /ten orbits in with a small central region (1 arcmin2) being covered to a depth of twelve orbits in /twenty orbits in . The ACS images were aligned, cosmic-ray rejected, and drizzled together using the ACS GTO pipeline (Blakeslee et al. 2003a).
Very deep integrations were obtained on ISAAC over 4 overlapping regions on RDCS1252-2927 (covering 4x4 arcmin, or 44% of our 36 arcmin2 ACS mosaic). A total of 24.1 and 22.7 hours were invested in the and integrations, respectively (6 hrs and 5.8 hrs at each of the 4 offset positions). These observations reached () and () in the shallower, non-overlapping regions and () and () in the small () central region, with a FWHM for the PSF which was almost uniformly ′′ across the entire IR mosaic. These data were then aligned with our optical data and resampled onto the same 0.05′′-pixel grid.
The second field utilizes deep ACS observations of the HDF North, taken as part of our GTO program, 2.5 orbits in and 4.5 orbits in . This data is supplemented with 1.5 orbits in and three orbits in from the GOODS program in this field (representing three epochs of the GOODS program) to yield a total depth of 4 orbits in and 7.5 orbits in over an effective area of 10 arcmin2. To complement the ACS and data, both the HDF North optical data (Williams et al. 1996) and infrared data from the Dickinson (1999) campaign were aligned and registered onto the same 0.05′′-pixel scale as our ACS fields, leaving the WFPC2 data with a FWHM of ′′ for the PSF and the NICMOS data with a FWHM of ′′ . The NICMOS images reached () and (5).
The and CALACS (02/20/03) zeropoints (Siranni et al. 2003) are assumed throughout, along with a galactic absorption of =0.075 and 0.012 for the two fields (from the Schlegel, Finkbeiner, & Davis 1998 extinction maps), resulting in a correction of -0.11m and -0.02m to the zeropoint for RDCS1252-2927 and the HDF North, respectively (and a correction of -0.15m and -0.024m for the filter).
2.2 Detection and Photometry
Briefly, object detection is performed on the basis of our deep WFC images after smoothing the images with a 0.09′′-FWHM Gaussian kernel and looking for peaks. Photometry is obtained for all detected objects with SExtractor (Bertin & Arnouts 1996) using two scalable apertures, the inner one to measure colors and the outer aperture to estimate the total flux. For both sets of IR data, similarly-scaled apertures are used to measure colors, but a correction is applied based on the image to estimate how much flux is lost in the IR due to PSF smoothing. Due to correlation in the noise, a concerted attempt was made to model the noise so that a relatively realistic treatment of uncertainties could be applied throughout the analysis (Appendix A). A more comprehensive description of our techniques for object selection and photometry is given in BBI.111Note that our procedure for object detection and photometry is different from that used by the GTO team (Blakeslee et al. 2003a; Benítez et al. 2003).
In total, 4632 and 1261 objects were recovered in the RDCS1252-2927 and HDF North fields, respectively. Most spurious detections were eliminated by demanding that each object be a 6 detection within one Kron-radius (Kron 1980) (typically ′′). Areas contaminated by optical ghosts or satellite trails were not included in the analysis (the excluded area was %). A number of spurious detections were found around bright stars or ellipticals, a problem exacerbated by the rather extended wings on the PSF. After some preliminary cleaning, all point-sources were removed from our catalogs ( and ), the rationale being to eliminate very red stars which might otherwise masquerade as high-redshift objects. We found that the SExtractor stellarity parameter adequately identified stellar objects. While such a cut might eliminate genuine star-forming objects, all of the very red () point-like objects () were found to have much redder colors () than most of the probable objects, and therefore a stellar identification seemed reasonable (see the systematic color differences between point-like and extended objects presented in Figure 1). We note that an examination of red point-like objects in our fields revealed one probable AGN (Appendix B).
2.3 Dropout Selection
The Lyman-break technique takes advantage of the increasingly strong deficit of flux at high redshift caused by the intervening Lyman-alpha forest eating into the spectrum shortward of 1216 Å (Madau 1995). Combining this with flux information redward of the break permits one to determine the spectral slope redward of the break and therefore relatively robustly distinguish the objects of interest from intrinsically red galaxies at lower redshift, as demonstrated by extensive spectroscopic work done on a variety of different dropout samples (Steidel et al. 1996a,b; Steidel et al. 1999; Weymann et al. 1998; Fan et al. 2001).
For our filter set, the color measures the spectral break and the color defines the spectral slope redward of this break. In Figures 1-2, we illustrate how a starburst spectrum ( Myr continuous star formation) attenuated with various opacities of dust () would move through this color-color space as a function of redshift. In both plots, it is clear that beyond , the template colors become very red () while the colors remain very blue (). For reference, we also include the colors of possible lower redshift interlopers using the Coleman, Wu, & Weedman (1976) spectral templates.
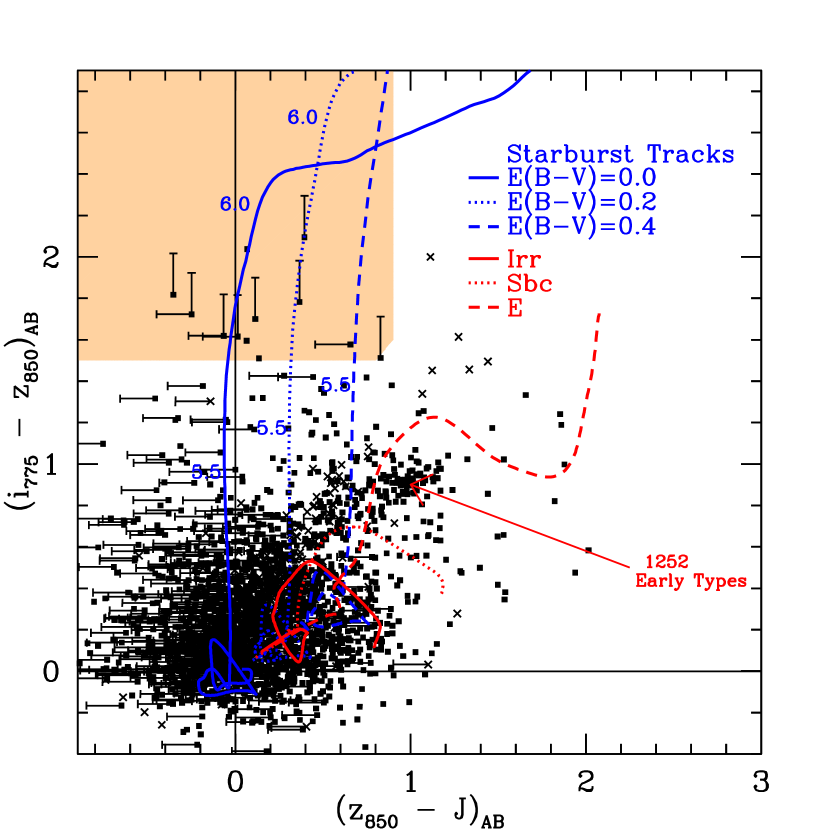
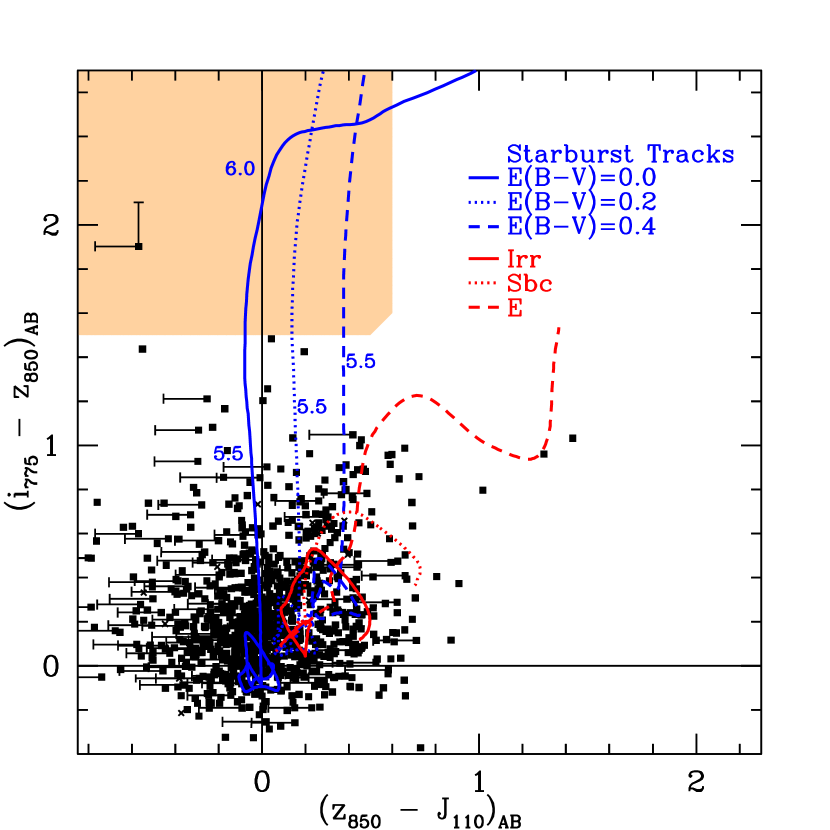
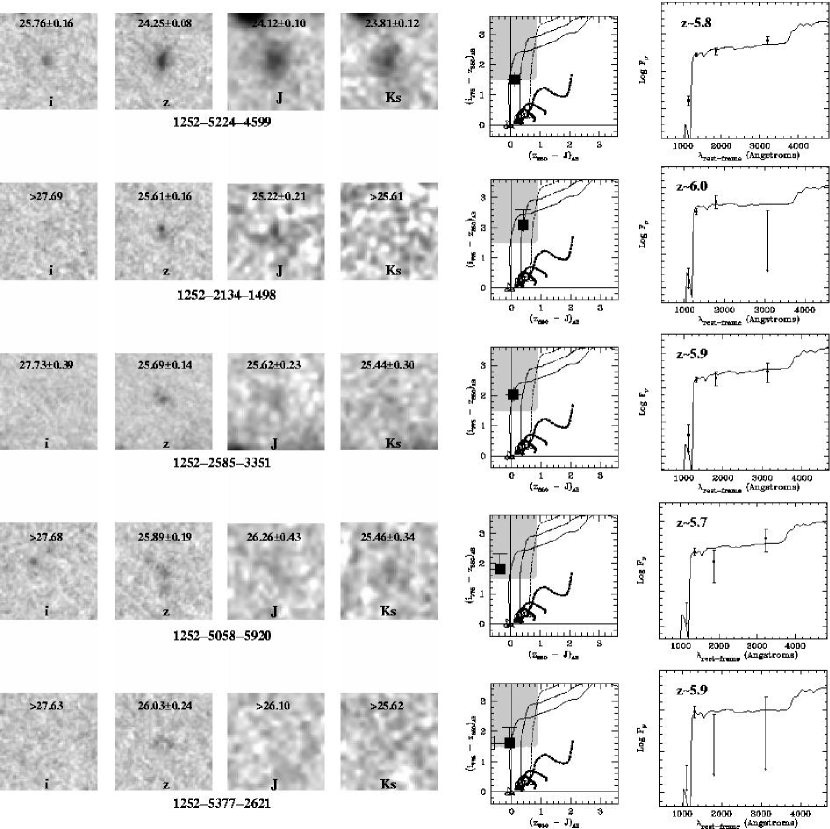
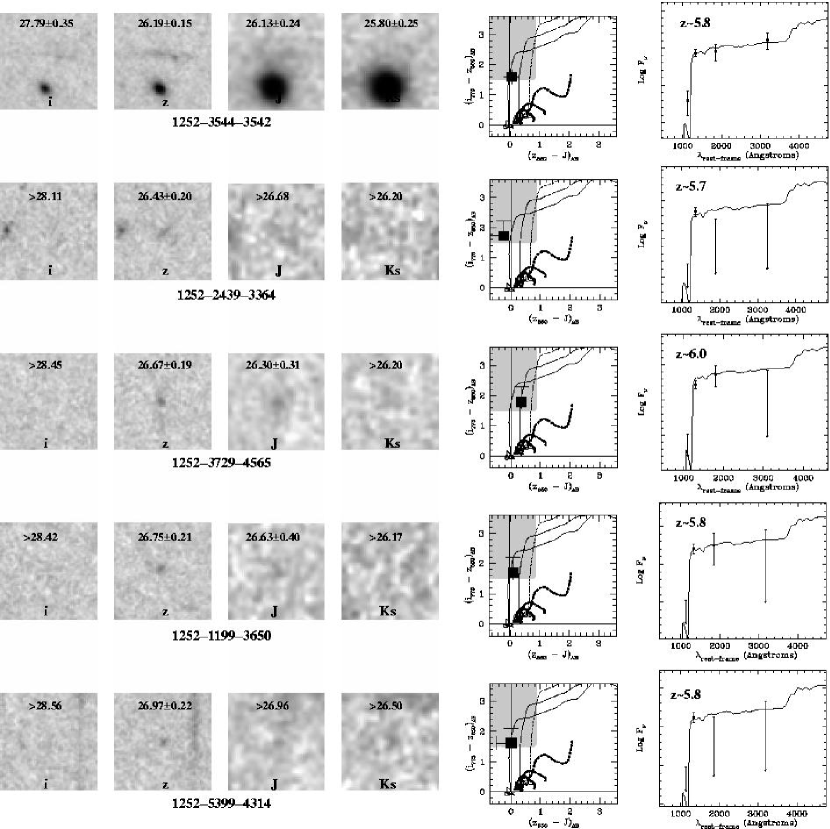
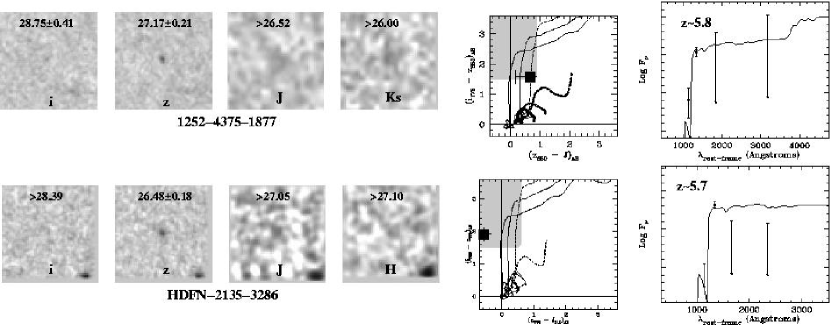
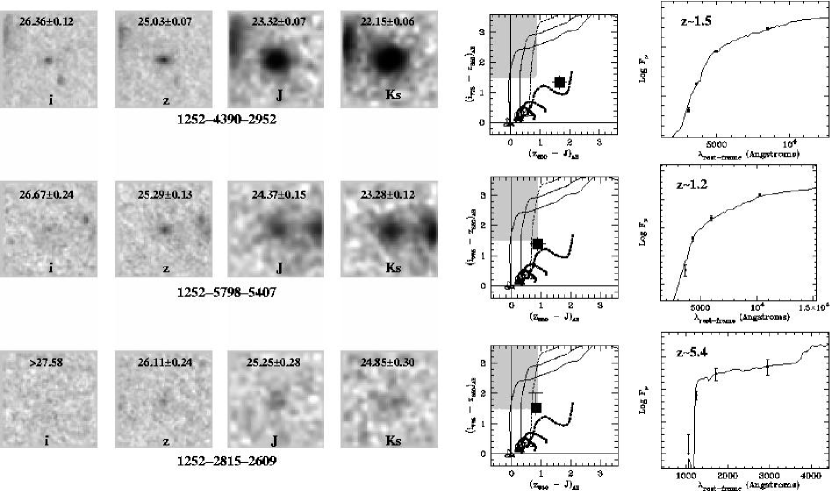
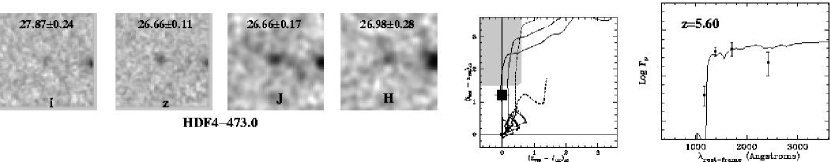
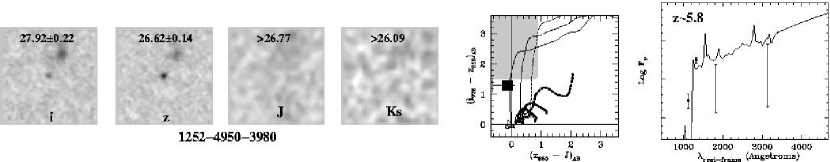
After considerable experimentation, we adopted a simple cut throughout in our selection of -dropouts. This color cut is motivated by evaluating object selection in regions where we have both ACS and infrared data. We present such data in Figures 1-2 from our RDCS1252-2927 and HDF North fields, providing 2 upper-limits for objects without significant infrared flux. We have also lightly shaded those regions in , color space where -dropouts are expected to lie: , , , for RDCS1252-2927 and , , , for the HDF North. A quick glance shows that objects with very red () colors also have blue colors and lie exclusively in this region, thereby validating our basic selection criteria. Over the 21 arcmin2 where we have infrared coverage, we find 11 objects in RDCS1252-2927 and 1 object in the HDF North which satisfy our cut. and images for these objects are shown in Figure 3, along with plots showing their position in color-color space, fits of plausible SEDs to the broadband fluxes, and an estimated redshift. The photometric redshifts are estimated using a bayesian formalism similar to that outlined in Benítez (2000), using a prior which matches the observed distribution of spectral slopes (Steidel et al. 1999). Our typical -dropout has a S/N of in the infrared, more than adequate to put good constraints on the spectral slope redward of the break. To illustrate this and to indicate how different the -dropouts really are from possible low redshift contaminants, we show three objects with red colors in Figure 4. For reference, we also include a figure with the Weymann et al. (1998) object from the HDF North to show the position of a spectroscopically-confirmed object on these diagrams (Figure 5).
Having presented our entire sample of -dropouts with infrared coverage, we now move onto quantifying the contamination rate due to low redshift interlopers. The most obvious way of doing this is simply to count the fraction of objects with which satisfy the two-color criteria we specified above versus those that do not. Unfortunately, for many objects we only have limits and not precise measures of the IR colors, leaving us with cases where we are not sure if an object lies in our sample or not. Therefore, following Pozzetti et al. (1998) in their analysis of dropouts in the HDF North, we resort to the use of Kaplan-Meier estimators with censoring (Lavalley, Isobe, & Feigelson 1992), where the implicit assumption is that censoring is random, e.g., that objects with and without limits are drawn from the same parent distribution. Given the narrow range of magnitudes and sizes in our sample we believe this assumption to be approximately satisfied. Performing this analysis on all objects in our fields with (46 objects), we find the following contamination fraction as a function of color: 0% , 13% , and 21% . (Note that this estimate is for samples from which the point sources (stars or AGNs) have already been removed.) While our data set contains two objects which are apparently ellipticals or Extremely Red Objects (EROs) at 25.3, and (Figure 4), all the objects with have infrared colors consistent with their being at high redshift.
This small contamination fraction (13%) allows us to substantially increase the size of our sample by including objects without IR coverage. A total of 11 such objects satisfy these criteria: 10 from RDCS1252-2927 and 1 from the HDF North.
3 Results
In summary, we find 21 objects over 36 arcmin2 in our RDCS1252-2927 field and 2 objects over 10 arcmin2 in our HDF North field which satisfy the -dropout criterion () we defined in the previous section. There is deep IR coverage for 12 of these objects over both fields. Except for one bright object which met our -dropout selection cut, -dropouts in our sample range in magnitude from 25.6 down to our completeness limit . For reference, an average-color (UV power-law index ) object from Steidel et al. (1999)’s sample would have , suggesting a population of objects with typical luminosities ranging from 0.3 to 1.5 .222Our object (1252-5224-4599) would therefore be a rather bright and suspiciously rare object. Even if this object is a low-redshift contaminant (and we have no reason to believe that it is), it does not appear to represent a very large source of contamination, given the lack of similarly bright objects to and relative homogeneity of objects faintward of that. Binning these objects into 0.5 magnitude intervals, we illustrate in Figure 6 how the surface density of -dropouts varies as a function of magnitude. Our typical -dropout has a half-light radius of 0.15′′ or 0.9 kpc, though we find them at all sizes ranging from the limit of the PSF (0.09′′) to 0.29′′, above which our sample starts to become incomplete. We list all objects which lie in our -dropout sample in Table 1, providing positions, magnitudes, colors, half-light radii, and the SExtractor stellarity parameter. Only 13% ( objects) of the objects without IR magnitudes are likely to be low-redshift contaminants (§2.3).
4 Predictions
Before getting into a detailed discussion of the luminosity density at high redshift, perhaps the simplest way to begin interpreting what we see at is to compare it with the -dropout sample we previously selected from the HDF North and South (BBI). In that work, we used our cloning machinery (Bouwens, Broadhurst & Silk 1998a,b; BBI) to project the -dropout population to for comparison with our and -dropout samples. We found an overall drop in the rest-frame continuum UV luminosity density (46% decrease to ) as well as a modest decrease in the physical size of objects at higher redshifts relative to the population.
We would now like to move this comparison out to higher redshift, using our HDF -dropout sample to make an estimate for the surface density of -dropouts on the sky. Unfortunately, the HDF North -dropout sample we derived in that work (, , , and ) only contains 1 object brighter than and hence is not extremely useful in this regard. (The fainter -dropouts would not be detectable at to the current depths.) We therefore resort to use of a much larger-area -dropout sample from the CDF South GOODS fields (see Bouwens et al. 2003, in preparation). The virtue of this sample is both its size (130 objects) and its ACS (PSF FWHM 0.08′′) resolution. Our selection criteria for this sample were , , , , where the SExtractor stellarity was less than 0.85 in the image (non-stellar with high confidence). We selected this sample from essentially the entire area of the CDF South, i.e., 150 arcmin2 (30 the area of the HDF), so it should be moderately representative of the universe at . Compared to our HDF sample, this -dropout sample has a similar distribution of redshifts and luminosities. The methodology for the generation of this sample remains that of BBI.
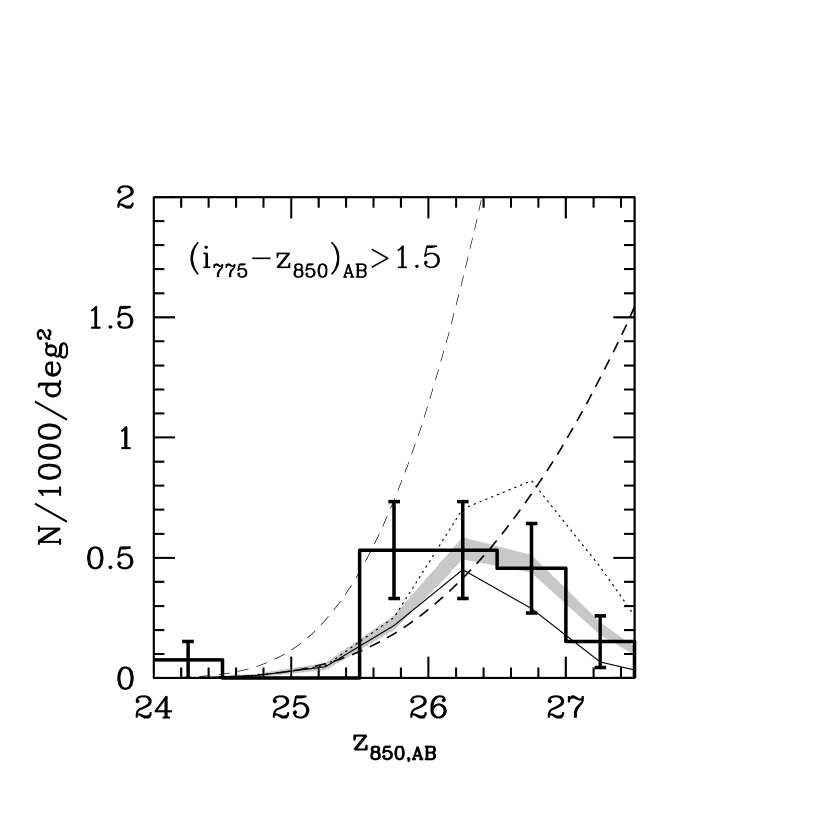
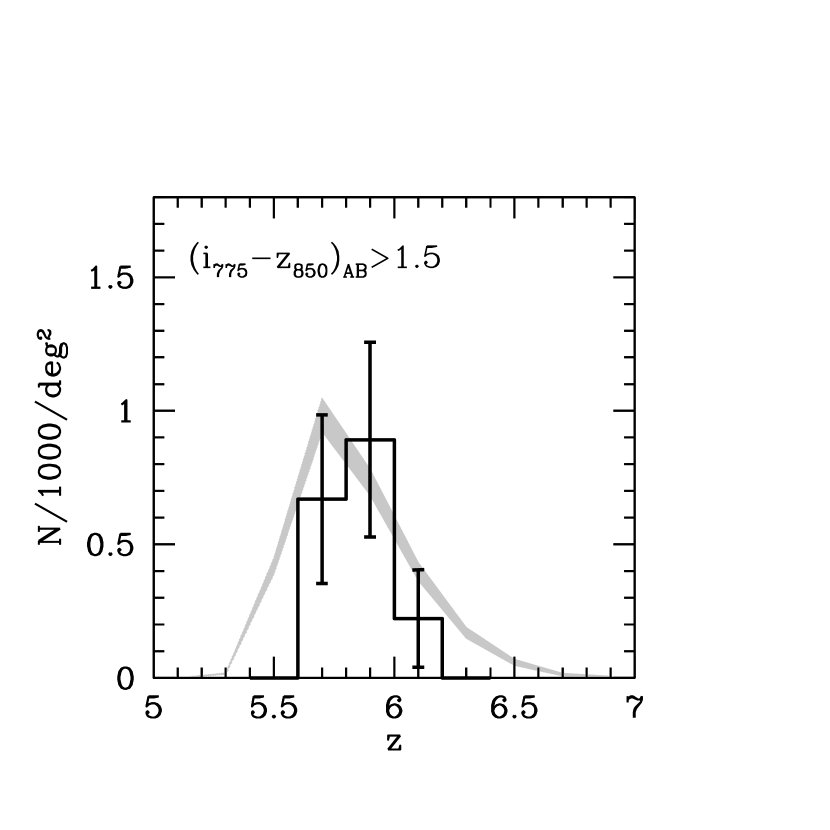
With our cloning machinery, we project objects from our -dropout sample to higher redshift using the product of the volume density, and the cosmological volume. We explicitly include pixel-by-pixel k-corrections, cosmic surface brightness dimming, and PSF variations in calculating the appearance of these objects to and beyond. Assuming no-evolution in the properties of these samples, we ran Monte-Carlo simulations to predict the number of -dropouts that would be observed in our RDCS1252-2927 field and HDF North fields. We explored searches at two different depths: three orbits in , five orbits in versus six orbits in , ten orbits in . We then weighted these predictions by the fractional area observed to these two different depths (65% at the shallower depth, 35% at the deeper). The result is that we predict finding 12.11.0 and 4.70.4 -dropouts in our RDCS1252-2927 and HDF North fields, respectively. The quoted uncertainties reflect the finite size of the input -dropout sample (see Bouwens et al. 1998a,b). Adding sample variance (simple Poissonian statistics), this works out to 12.13.6 -dropouts in our RDCS1252-2927 field versus the 20 observed (18.7 after the 13% correction for the low-redshift contamination) and 4.72.2 -dropouts in our HDF North field versus the 2 observed (1.9 after correction for contamination), indicating a slight reduction in the numbers from to , but more realistically consistent with no evolution (see Table 2). We combine the two fields to derive -dropout number counts and again compare with the no-evolution predictions (Figure 6), finding 2325% more -dropouts than are predicted using our no-evolution model. (Assuming that the luminosity density at is proportional to the light in the integrated counts , we infer that the luminosity density is 5129% higher at than it is at . Removing the bright object lowers the luminosity increase to 1823%.) We include on this figure the predictions for the two depths described above (solid and dotted lines), showing the effect the assumed depth can have on the predicted numbers.333We observe a similarly strong dependence in the data, finding 65% more -dropouts arcmin-2 in the deeper overlap regions of our RDCS1252-2927 field than in regions at just half that depth (0.4m deeper to the same S/N). This illustrates how important a consideration incompleteness can be in the magnitude range we are considering. Taking the apparent completeness into account (see also Figure 8 and the discussion in §5), we quote an approximate surface density of 0.50.2 -dropouts arcmin-2 down to . For reference, we also include a comparison of the predicted and observed redshift distributions (Figure 7).
5 Estimated Luminosity Density
In the previous section, we compared the -dropouts we observe with a no-evolution projection of a wide-area -dropout sample. Not only do these simulations give us some gauge of the evolution across this redshift interval, but they provide an approximate estimate for the -dropout selection function (assuming no-evolution in the size, shape, or color distribution). It is now relatively straightforward to make three different estimates of the luminosity density.
Our first and most direct estimate comes directly from the comparisons presented in §4, where marginal evolution is observed from to . Linking this with the result from BBI (46% drop from to ) yields a % decrease in the luminosity density from to (a 37% decrease ignoring the bright object). This relative decrease can then, in turn, be expressed as an absolute luminosity density integrating the Steidel et al. (2000) LF down to or , where our -dropouts counts are clearly becoming incomplete. The result is .
Our second estimate closely follows the more standard approach pioneered by Steidel et al. (1999) in deriving the luminosity density at . With this approach, one derives a -continuum luminosity function as follows:
| (1) |
where is the absolute magnitude at 1600 corresponding to some magnitude assuming a fixed redshift of 5.9 (the average redshift for an -dropout, see Figure 7). The effective volume then is calculated as a function of magnitude , where is the probability that an object of magnitude and redshift falls in our -dropout sample and is the cosmological volume at redshift . The factor contains a whole range of different selection effects which affect the inclusion of an object in our sample from the intrinsic distribution of colors to photometric scatter to the effect of the inherent surface brightnesses on the completeness of the sample. Assuming a similar distribution of surface brightnesses, shapes, and colors to that seen at , we can use the Monte-Carlo cloning simulations presented in §4 to determine this function. (Due to the lack of dropouts to probe the selection function at bright magnitudes, we require that be a strictly decreasing function of magnitude.) We present our result in Figure 8.
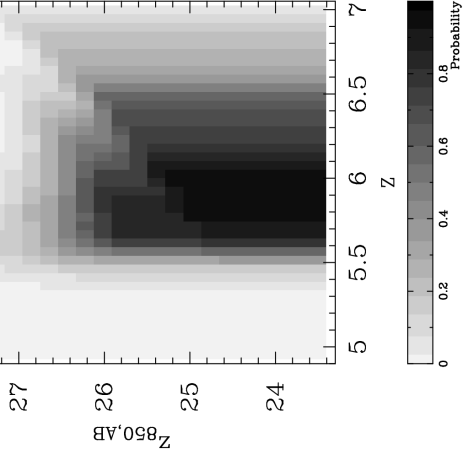
For this approach to be effective, the absolute magnitude has to be a very tight function of apparent magnitude . This occurs when the selection function is a very narrow function of redshift. Since this is not the case, we rewrite the above expressions as where the absolute magnitude is a function of the apparent magnitude and the redshift .444In order to convert the apparent magnitudes we measure to absolute magnitudes, it was necessary for us to take into consideration possible biases in the measurement of the magnitudes. We can make an estimate for this bias using the simulations presented in §4. Comparing the magnitudes we recover to those expected based upon an extrapolation of the original -dropout photometry to , we find an average 0.2m faintward offset in the magnitudes. Approximating and as a series of step functions, we are able to invert Eq. (3) to solve for (see Figure 9 for a comparison of the derived LF with the Steidel et al. 1999 determination). Integrating this LF down to (), we find ( ignoring the bright object). This represents a % drop relative to what Steidel et al. (1999) report at to a similar limiting luminosity. Note that for -type objects, the effective survey volume is approximately Mpc.

In the first two approaches presented, there is the implicit assumption that the selectability of objects is similar to that found at , both in their colors and their surface brightnesses, and to a large extent, this is probably true. The distribution of colors (while perhaps a little bluer) are not that different from the low-redshift expectations (Steidel et al. 1999; BBI) and similarly for the distribution of surface brightnesses (as similarities between the predicted and observed number counts in Figure 6 effectively illustrates).555Determining both distributions observationally would require the sort of deep optical and infrared images promised by the HST Ultra Deep Field. Lacking such, one is forced to assume a certain similarity to lower redshift dropout populations (as we have done here). This being said, given the expectation that higher redshift objects are denser and therefore of higher surface brightness, it is useful to consider a third approach where no completeness correction is made.
This enables us to put a lower bound on the space density in the event that these changes have a substantial effect on the completeness of the -dropout population. As with the previous two approaches, we make use of the simulations from §4. The difference is that we only consider objects which actually make it into our -dropout sample when computing , not every object from our simulations. The effective volume, , is hence computed as an ensemble average over all inputs observed at magnitude and selected as -dropouts. Putting in our observed surface densities for these same magnitude intervals (Figure 6), we derive a UV-continuum luminosity density of . We emphasize that relative to our previous estimates, this final estimate represents a strict lower limit on the luminosity density.
We converted these UV luminosity densities to star formation rate densities using the relation
| (2) |
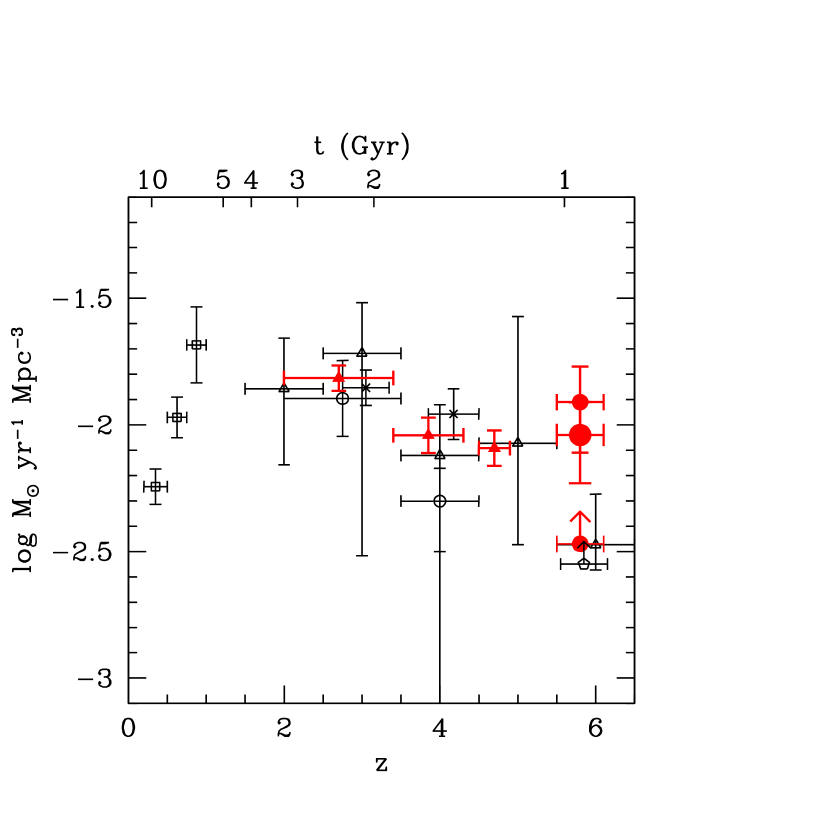
where const = at 1500 for a Salpeter IMF (Madau et al. 1998). The result is , , and , respectively, for the three approaches just presented. Assuming a Schechter luminosity function with faint end slope and extrapolating this to the faint end limit yields a SFR density which is larger. This works out to an integrated star formation rate of , , and , respectively, for these three approaches. To put these estimates in context, we make a comparison with several previous determinations (Steidel et al. 1999; Madau et al. 1998; Thompson et al. 2001; Lilly et al. 1996; Stanway et al. 2003; BBI) in Figure 10, truncating the observationally-derived LFs at similar faint-end luminosities.
6 Discussion
In this work, the luminosity density at is evaluated using three different procedures. The first is strictly differential in nature. -dropouts from the wide-area GOODS survey are projected to for comparison with the observed -dropouts. Adopting previous results to (BBI; Thompson et al. 2001) then implies a 40% drop in the luminosity density from to . The second and third procedures, by contrast, are more direct, relying on a derived selection function to convert the observed -dropouts into a luminosity density at . Relative to the luminosity density reported at by Steidel et al. (1999), the resulting drop is a factor of and , depending upon the two different assumptions these two procedures make about the completeness levels (and therefore the presence of low surface brightness objects at high redshift). Similarities between our first two estimates of the luminosity density point to a general consistency between those methodologies.
Our three estimates have different strengths and weaknesses. Our first estimate, for example, depends on the relatively small area BBI result (HDF-N and HDF-S) and therefore could be quite sensitive to cosmic variance. Our second estimate, by contrast, relies upon the much larger area -dropout population (CDFS) to derive the selection function. Unfortunately, this same sample could be subject to similar selection effects and therefore missing light, possibly biasing the numbers low. Our first two estimates provide accurate estimates of the luminosity density in lieu of large amounts of size or color evolution. Our final estimate, on the other hand, is probably much too low except in cases where there has been dramatic amounts of evolution in the sizes of galaxies. It therefore serves as a useful lower limit. On balance, we prefer our estimate based on a generalized version of the Steidel et al. (1999) formalism, given the effect of cosmic variance on our first estimate and the extreme assumptions present in the third (e.g., given the small increase in the universal scale factor from to , the change in surface brightnesses should be at most modest). We will use it throughout the remainder of the discussion.666Ideally speaking, we would estimate the luminosity density using a completely differential procedure, scaling the sizes and colors to match the evolution observed. Such an analysis is being performed in a future paper on the dropouts in the GOODS fields where the samples are substantially larger (Bouwens et al. 2003).
Before getting into a comparison against previous work, we should take a more detailed look at the validity of the sample itself, particularly, with regard to our use of a cluster field. Two concerns immediately arise. The first regards the effect of lensing by the cluster on sources. We can make a simple estimate of this effect using the Broadhurst, Taylor, & Peacock (1995) equation for the magnification bias, , where is the slope of the number counts . For a faint end slope (a simple consequence of a LF where ) and an average magnification of 1.03, this works out to an expected 1% drop in the surface density of -dropouts relative to the unlensed case. The second concern involves the possibility that cluster ellipticals might get mixed up in our -dropout sample. After all, we decided to observe RDCS1252-2927 with the and filters because they straddled the 4000 break. Fortunately, the mean color for bright ellipticals in this cluster is (one can see the cluster as a small overdensity in Figure 1 at =0.9 and =1.1) and this colour decreases quite markedly towards faint luminosities (Postman et al. 2002; Blakeslee et al. 2003b). There is no indication that lower luminosity cluster members are being scattered into the -dropout sample.
It is interesting to compare the present results with other early work on the surface density of -dropouts. Stanway et al. (2003), for example, report finding 8 objects over 146 arcmin2, e.g., 0.05 -dropouts arcmin-2 to . We only find one object (-dropouts arcmin-2) to that same depth, a result which may not be surprising given the numbers and relative areas. In a deeper but smaller area search, Yan et al. (2003) report finding 2.3 objects arcmin-2 (27 objects) to , subtracting at most 4 objects from this estimate due to contamination by stars. Since the median magnitude of their sources is and their brightest reported source has , this works out to objects arcmin-2 to our quoted magnitude limit, somewhat larger than the 0.50.1 objects arcmin-2 we find. We are somewhat uncertain about the reliability of their identifying -dropouts to (7 ) in a 5-orbit (9540 s) -band exposure, given the difficulty we had in identifying -dropouts to a much brighter limit of () in the deeper (10-20 orbit) overlapping regions. For typical -dropout sizes (), our analysis would tend to suggest a S/N closer to 3 at their stated magnitude limit.
Compared to Stanway et al. (1995), who estimate a 25% contamination fraction due to ellipticals or EROs in an sample, we estimate a smaller contamination fraction, 13%, based upon the measured colors for our sample. Though hardly significant given the number of objects involved, such a difference clearly follows the trend toward lower early-type fractions at fainter magnitudes. We noted similarly small contamination fractions in our analysis of the -dropouts from the HDF North (BBI).
Down to our magnitude limit , we find a star formation rate density at of , 2 lower than similar estimates at from Steidel et al. (2003) and Madau et al. (1998). This estimate is nearly Stanway et al. (2003)’s quoted result (). While a portion of this difference can be attributed to the different depths of our searches (the present census going 1.4 magnitudes further down the luminosity function), there are significant differences in the effective volumes we assume, the present study correcting for the significant incompleteness at resulting from surface brightness dimming while Stanway et al. (2003) do not make such a correction. For both this reason and our greater overall depth, the present study represents a clear improvement over the Stanway et al. (2003) estimate. From to , we find minimal evidence for dramatic evolution, consistent with the small amount of cosmic time available across this interval (0.2 Gyr from to and 1 Gyr from to ). In general, the trends we find are consistent with the gradual decline in star formation density previously reported from to (Madau et al. 1996; Steidel et al. 1999; Thompson et al. 2001; Lehnert et al. 2003; Deltorn et al. 2003; BBI) or as found in recent work on Lyman-alpha emitters, where a deficit is claimed at relative to the population (Maier et al. 2003).
Since recent work from absorption line studies on QSOs indicates that the universe may have been reionized near a redshift of (Fan et al. 2001; Becker et al. 2001; Fan et al. 2002), it is relevant to compare the star formation rate we determine here with that needed to reionize the universe at . For the latter, we use the following relation from Madau, Haardt, & Rees (1999), correcting it for the baryon density () derived from the recent WMAP results (Bennett et al. 2003) and shifting it to :
| (3) |
where is the star formation rate density, is the H concentration factor , and is the fraction of ionizing radiation escaping into the intergalactic medium. Given the large observational and theoretical uncertainties in the exact values of and , the star formation rate densities inferred here at (0.0090 observed, 0.036 extrapolating the LF to the faint limit) are well within the range of that needed to reionize the universe at (30% lower than the fiducial value given in Eq. (3)). Whether or not the objects we observe at are sufficient to reionize the universe or this ionizing radiation is provided by a completely different population of objects (e.g., Madau 1998), it seems clear that this ionizing radiation does not come from AGNs (Haiman, Madau, & Loeb 1998).
7 Summary
We use deep ACS WFC + observations of RDCS1252-2927 and the HDF North to search for candidates by looking for a strong Lyman break across the passbands in fields with deep IR imaging. We augment this with deep infrared imaging to derive colors for the candidates to help distinguish them from lower redshift interlopers where possible. We compare our findings with a no-evolution projection of a wide-area -dropout sample to and then use these simulations to make three different estimates of the rest-frame continuum -luminosity density at .
-
•
To , we find 21 -dropouts (; detections) over 36 arcmin2 in our RDCS1252-2927 field (one object is lensed) and 2 -dropouts over 10 arcmin2 in our HDF North field. This is equivalent to object arcmin-2 down to our magnitude limit , or object arcmin-2 down to corrected for completeness.
-
•
Compared to an average-color (UV power-law index ) -dropout in the Steidel et al. (1999) sample, the -dropouts we find range in luminosity from 0.3 to 1.5 (with the exception of one very bright () object which also meets our selection criterion). Our typical -dropout has a half-light radius ranging from 0.09′′ to 0.29′′, or 0.5 kpc to 1.7 kpc, for a , , cosmology.
-
•
Using our deep infrared data to constrain the spectral slopes redward of the break, we find that all 12 of our -dropout candidates (), for which we have IR data, have blue () colors. Using the Kaplan-Maier estimator on all extended sources, we estimate that only 13% of such sources are low-redshift interlopers. Assuming spectroscopic confirmation of the two-color dropout technique to (e.g., Fan et al. 2001; Bunker et al. 2003), this demonstrates that an selection can be an effective way of uncovering a population of high redshift objects (see also Stanway et al. 2003).
-
•
Over the 21 arcmin2 where we had infrared coverage, we identified only one red () point-like object with colors consistent with being a AGN. Since in total we identify 7 point-like objects with and and only one out of four objects (25%) with IR coverage has colors less than 0.8, this works out to an estimated surface density of 0.040.03 AGNs arcmin-2 down to our magnitude limit of .
-
•
Comparing the number of -dropouts with a no-evolution projection of our -dropout sample from CDF South GOODS, we estimate the evolution in rest-frame continuum UV luminosity density from to . We find 2325% more -dropouts (21) than are predicted (17) once a correction for the contamination rate is made, consistent with no strong evolution over this redshift interval. Redoing this increase in terms of integrated luminosity, this increase amounts to 5129% (or % removing the one very bright object). Adopting previous results to (BBI; Thompson et al. 2001), this works out to a mere 2029% drop in the luminosity density from to .
-
•
Using simulations based on a set of CDF South -dropouts, we estimate the selection function for our -dropout sample. Then, via a generalized version of Steidel et al. (1999)’s formalism, we calculate the -luminosity function for this sample, and integrate it down to (). The rest-frame -luminosity density we derive () is % lower than Steidel et al. (1999) found to a similar limiting luminosity, consistent with the above estimate. This is our preferred estimate.
-
•
The previous two approaches assume no large change in the selectability (color or surface brightness distribution) of dropouts from to . Given the expectations (observational and theoretical) that dropouts may have higher surface brightnesses at than , it is useful to make a third estimate for the luminosity density from the simulations, but this time assuming no incompleteness. Running through the numbers, we find for the observed -dropouts, 5 lower than the value reported by Steidel et al. (1999) to a similar luminosity. This third approach provides a reliable lower limit to the luminosity density.
-
•
Converting the luminosities densities we infer into star formation rate densities using standard assumptions (e.g., Madau et al. 1998), we find an integrated star formation rate density of , , and , respectively, for the three approaches just presented (or , , and extrapolating the observations to low luminosities using a Schechter function with faint-end slope ).
-
•
Our preferred estimate for the rest-frame continuum UV luminosity density and star formation rate density at are and ( extrapolating the luminosity function to the faint limit), respectively. This represents a 3921% drop from to .
-
•
The rest-frame continuum -luminosity densities we infer are well within the expected range needed for reionization, for canonical assumptions about the H clumping factor and the fraction of UV radiation escaping into the intergalactic medium.
The combination of deep ACS and ground-based IR imaging have been shown to be a very effective means of isolating high redshift objects and studying their properties. We will be following up this analysis with an investigation of the shallower, but larger area, data in the CDF South and HDF North from the GOODS program (Bouwens et al. 2003).
References
- Becker et al. (2001) Becker, R. H. et al. 2001, AJ, 122, 2850.
- Benítez (2000) Benítez, N. 2000, ApJ, 536, 571.
- Benítez et al. (2003) Benítez, N. & ACS Investigation Definition Team. 2003, in preparation.
- Bennett et al. (2003) Bennett, C.L., et al. 2003, ApJ, submitted.
- Bertin and Arnouts (1996) Bertin, E. and Arnouts, S. 1996, A&AS, 117, 393.
- Blakeslee et al. (2003) Blakeslee, J. P., Anderson, K. R., Meurer, G. R., Benítez, N., & Magee, D. 2003a, ASP Conf. Ser. 295: Astronomical Data Analysis Software and Systems XII, 12, 257
- (7) Blakeslee, J. 2003b, in preparation.
- Bouwens, Broadhurst and Silk (1998) Bouwens, R., Broadhurst, T. and Silk, J. 1998a, ApJ, 506, 557.
- Bouwens, Broadhurst and Silk (1998) Bouwens, R., Broadhurst, T. and Silk, J. 1998b, ApJ, 506, 579.
- Bouwens, Broadhurst and Illingworth (2003) Bouwens, R., Broadhurst, T. and Illingworth, G. 2003, ApJ, in press.
- (11) Bouwens, R.J, et al. 2003, in preparation.
- Broadhurst, Taylor, & Peacock (1995) Broadhurst, T. J., Taylor, A. N., & Peacock, J. A. 1995, ApJ, 438, 49
- Bruzual A. & Charlot (1993) Bruzual A., G. & Charlot, S. 1993, ApJ, 405, 538.
- Bunker et al. (2003) Bunker, A.J., Stanway, E.R., Ellis, R.S., McMahon, R.G., McCarthy, P.J. 2003, MNRAS, submitted, astro-ph/0302401.
- Calzetti, Kinney, & Storchi-Bergmann (1994) Calzetti, D., Kinney, A. L., & Storchi-Bergmann, T. 1994, ApJ, 429, 582.
- Casertano et al. (2000) Casertano, S., et al. 2000, AJ, 120, 2747.
- Coleman, Wu, & Weedman (1980) Coleman, G. D., Wu, C. -., & Weedman, D. W. 1980, ApJS, 43, 393.
- Connolly et al. (1997) Connolly, A. J., Szalay, A. S., Dickinson, M., Subbarao, M. U., & Brunner, R. J. 1997, ApJ, 486, L11.
- Cowie et al. (1999) Cowie, L.L., Songaila, A., & Barger, A.J. 1999, AJ, 118, 603.
- Deltorn et al. (2001) Deltorn, J.-M. et al. in preparation.
- Dickinson (1999) Dickinson, M. 1999, After the Dark Ages: When Galaxies were Young (the Universe at ). 9th Annual October Astrophysics Conference in Maryland held 12-14 October, 1998. College Park, Maryland. Edited by S. Holt and E. Smith. American Institute of Physics Press, 1999, p. 122.
- Dickinson & Giavalisco (2002) Dickinson, M. & Giavalisco, M. 2002, astro-ph/0204213.
- Fan et al. (2001) Fan, X. et al. 2001, AJ, 122, 2833
- Fan et al. (2002) Fan, X., Narayanan, V. K., Strauss, M. A., White, R. L., Becker, R. H., Pentericci, L., & Rix, H. 2002, AJ, 123, 1247
- Ferguson, Dickinson, & Williams (2000) Ferguson, H. C., Dickinson, M., & Williams, R. 2000, ARA&A, 38, 667.
- Ford et al. (1998) Ford, H. C. et al. 1998, Proc. SPIE, 3356, 234.
- Ford et al. (2003) Ford, H. C. et al. 2003, Proc. SPIE, 4854, 81.
- Guhathakurta, Tyson, & Majewski (1990) Guhathakurta, P., Tyson, J. A., & Majewski, S. R. 1990, ApJ, 357, L9.
- Haiman, Madau, & Loeb (1999) Haiman, Z., Madau, P., & Loeb, A. 1999, ApJ, 514, 535.
- Kron (1980) Kron, R. G. 1980, ApJS, 43, 305.
- Lavalley, Isobe, & Feigelson (1992) Lavalley, M., Isobe, T., & Feigelson, E. 1992, ASP Conf. Ser. 25: Astronomical Data Analysis Software and Systems I, 1, 245.
- Lehnert et al. (1996) Lehnert, M.D. & Bremer, M. 2003, ApJ, submitted, astro-ph/0212431.
- Lilly et al. (1996) Lilly, S.J., Le Fevre, O., Hammer, F., & Crampton, D. 1996, ApJ, 460, L1.
- Madau (1995) Madau, P. 1995, ApJ, 441, 18.
- Madau et al. (1996) Madau, P., Ferguson, H.C., Dickinson, M.E., Giavalisco, M., Steidel, C.C., & Fruchter, A. 1996, MNRAS, 283, 1388.
- Madau et al. (1998) Madau, P., Pozzetti, L. & Dickinson, M. 1998, ApJ, 498, 106.
- Madau (1998) Madau, P. 1998, astro-ph/9807200.
- Madau, Haardt, & Rees (1999) Madau, P., Haardt, F., & Rees, M. J. 1999, ApJ, 514, 648
- Maier et al. (2003) Maier, C., Meisenheimer, K., Thommes, E., Hippelein, H., Roeser, H.J., Fried, J., von Kuhlmann, B., Phleps, S., & Wolf, C. 2003, A&A, in press, astro-ph/0302113.
- Postman et al. (2002) Postman, M. et al. 2002, American Astronomical Society Meeting, 200.
- Rosati, della Ceca, Norman, & Giacconi (1998) Rosati, P., della Ceca, R., Norman, C., & Giacconi, R. 1998, ApJ, 492, L21
- (42) Rosati, P., et al. 2003, in preparation.
- Salpeter (1955) Salpeter, E. E. 1955, ApJ, 121, 161.
- Schlegel, Finkbeiner, & Davis (1998) Schlegel, D. J., Finkbeiner, D. P., & Davis, M. 1998, ApJ, 500, 525
- Stanway et al. (2003) Stanway, E.R., Bunker, A.J., & McMahon, R.G. 2003, MNRAS, in press, astro-ph/0302212.
- Steidel, Giavalisco, Dickinson, & Adelberger (1996) Steidel, C. C., Giavalisco, M., Dickinson, M., & Adelberger, K. L. 1996a, AJ, 112, 352
- Steidel et al. (1996) Steidel, C. C., Giavalisco, M., Pettini, M., Dickinson, M., & Adelberger, K. L. 1996b, ApJ, 462, L17
- Steidel et al. (1999) Steidel, C. C., Adelberger, K. L., Giavalisco, M., Dickinson, M. and Pettini, M. 1999, ApJ, 519, 1.
- Thompson, Weymann, & Storrie-Lombardi (2001) Thompson, R. I., Weymann, R. J., & Storrie-Lombardi, L. J. 2001, ApJ, 546, 694.
- Weymann et al. (1998) Weymann, R. J., Stern, D., Bunker, A., Spinrad, H., Chaffee, F. H., Thompson, R. I., & Storrie-Lombardi, L. J. 1998, ApJ, 505, L95
- Williams, R.E, et al. (1996) Williams, R.E., et al. 1996, AJ, 112, 1335.
- Yan, Windhorst, & Cohen (2003) Yan, H., Windhorst, R. A., & Cohen, S. H. 2003, ApJ, 585, L93.
Appendix
Appendix A Noise
The drizzling and resampling procedure we employ (and generally employed with HST data sets) to produce our fully coaligned optical and infrared data set naturally introduces a certain correlation into the noise of this data set. To estimate the true amplitude of the noise–distinct from the single pixel RMS–as well as the effective noise kernel, RMS fluctuations within apertures of increasing sizes are measured, after masking out detections, up to a scale where there is no obvious additional power. A noise model (amplitude and kernel) is then constructed which provides a plausible fit to the observations. This model is used throughout to estimate errors in the photometry.
Appendix B AGN
We found one , stellar object consistent with a AGN-identification over the area where we had infrared coverage (21 arcmin2) (Figure 11). Since in total we identify 7 point-like objects with and and only one out of the four objects with IR coverage (25%) had colors less than 0.8, this works out to an estimated surface density of 0.040.03 objects arcmin-2 down to our magnitude limit of .
| Object ID | Right Ascension | Declination | aaAB Magnitudes | bbAll limits are 2. | ccHere the band alternatively refers to the ISAAC band and the NICMOS filter depending upon which field the object is found. | S/GddSExtractor stellarity parameter, for which 0 = extended object and 1 = point source | (′′) | ||
|---|---|---|---|---|---|---|---|---|---|
| 1252-5224-4599eeThe “1252-” prefix denotes an object from RDCS1252-2927. | 12:52:56.8880 | -29:25:55.503 | 24.20.1 | 1.5 | 0.1 | – | – | 0 | 0.29 |
| 1252-2134-1498 | 12:52:45.3816 | -29:28:27.105 | 25.60.2 | 2.1 | 0.4 | – | – | 0.01 | 0.18 |
| 1252-2585-3351 | 12:52:52.2832 | -29:28:04.743 | 25.70.1 | 2.0 | 0.1 | – | – | 0 | 0.20 |
| 1252-6031-966 | 12:52:43.3793 | -29:25:17.474 | 25.70.1 | 2.0 | – | – | – | 0.30 | 0.11 |
| 1252-562-2836 | 12:52:50.2971 | -29:29:43.226 | 25.80.1 | 2.0 | – | – | – | 0.06 | 0.14 |
| 1252-6798-302 | 12:52:40.8435 | -29:24:39.033 | 25.80.2 | 1.7 | – | – | – | 0.04 | 0.16 |
| 1252-4720-6466 | 12:53:03.8342 | -29:26:20.835 | 25.80.1 | 1.5 | – | – | – | 0.02 | 0.12 |
| 1252-5058-5920 | 12:53:01.7448 | -29:26:03.873 | 25.90.2 | 1.8 | -0.4 | – | – | 0 | 0.19 |
| 1252-277-3385 | 12:52:52.3987 | -29:29:57.525 | 26.00.2 | 1.6 | – | – | – | 0 | 0.19 |
| 1252-5377-2621 | 12:52:49.5122 | -29:25:47.721 | 26.00.2 | 1.6 | -0.1 | – | – | 0 | 0.22 |
| 1252-7065-6877 | 12:53:05.4237 | -29:24:26.222 | 26.10.2 | 1.6 | – | – | – | 0.01 | 0.14 |
| 1252-3544-3542**This object appears to be lensed and therefore is excluded from our sample. | 12:52:53.0237 | -29:27:16.801 | 26.20.2 | 1.6 | 0.1 | – | – | 0 | 0.23 |
| 1252-2439-3364 | 12:52:52.3340 | -29:28:12.030 | 26.40.2 | 1.7 | -0.2 | – | – | 0 | 0.17 |
| 1252-7005-1697 | 12:52:46.1876 | -29:24:28.846 | 26.50.2 | 1.5 | – | – | – | 0 | 0.13 |
| 1252-3729-4565 | 12:52:56.7460 | -29:27:07.631 | 26.70.2 | 1.8 | 0.4 | – | – | 0 | 0.12 |
| 1252-7313-6944 | 12:53:05.6814 | -29:24:13.836 | 26.70.2 | 1.6 | – | – | – | 0.09 | 0.09 |
| 1252-1199-3650 | 12:52:53.4200 | -29:29:11.443 | 26.70.2 | 1.7 | 0.1 | – | – | 0 | 0.12 |
| 1252-5399-4314 | 12:52:55.7957 | -29:25:46.724 | 27.00.2 | 1.6 | 0.0 | – | – | 0 | 0.11 |
| 1252-3497-809 | 12:52:42.7537 | -29:27:18.894 | 27.00.2 | 1.6 | – | – | – | 0 | 0.11 |
| 1252-4375-1877 | 12:52:46.8536 | -29:26:37.733 | 27.20.2 | 1.6 | 0.7 | – | – | 0.60 | 0.09 |
| 1252-3684-528 | 12:52:41.6802 | -29:27:09.550 | 27.30.2 | 1.5 | – | – | – | 0.16 | 0.09 |
| HDFN-2135-3286 | 12:36:49.9368 | 62:13:55.671 | 26.50.2 | 1.9 | -0.6****This is . | 2.1 | 1.1 | 0.02 | 0.14 |
| HDFN-4965-4355 | 12:36:30.7457 | 62:12:53.371 | 27.00.2 | 1.5 | – | 1.3 | – | 0.01 | 0.10 |
| Data set | Observed | No evolution Prediction |
|---|---|---|
| RDCS1252-2927 | 18.7aaCorrected for the expected 13% contamination rate. | 12.11.03.5 |
| HDF North | 1.9aaCorrected for the expected 13% contamination rate. | 4.70.42.2 |