Optical and Infrared Properties of the 2 Ms Chandra Deep Field-North X-ray Sources 11affiliation: Based in part on data obtained at the Subaru Telescope, which is operated by the National Astronomical Observatory of Japan. 22affiliation: Based in part on data obtained at the W. M. Keck Observatory, which is operated as a scientific partnership among the the California Institute of Technology, the University of California, and NASA and was made possible by the generous financial support of the W. M. Keck Foundation.
Abstract
We present an optical and near-infrared catalog for the X-ray sources in the Ms Chandra observation of the Hubble Deep Field-North region. We have high-quality multicolor imaging data for all 503 X-ray point sources in the X-ray-selected catalog and reliable spectroscopic redshifts for 284. We spectroscopically identify six high-redshift () type II quasars ( ergs s-1) in our sample. Our spectroscopic completeness for the sources is 87%. The spectroscopic redshift distribution shows two broad redshift spikes that have clearly grown over those originally seen in the Ms exposure. The spectroscopically identified extragalactic sources already comprise 75% of the measured keV light. Redshift slices versus keV flux show that an impressive 54% of the measured keV light arises from sources at and 68% from sources at . Thus, major accretion onto supermassive black holes has occurred since the universe was half its present age.
We use seven broadband colors and a Bayesian photometric redshift estimation code to obtain photometric redshifts for the X-ray sources. We find that the photometric redshifts are within 25% of the spectroscopic redshifts for 94% of the non-broad-line sources with both photometric and spectroscopic measurements. The photometrically identified sources show a smooth continuation of the spectroscopically identified sources to redder color with increasing redshift, consistent with the galaxy tracks of evolved bulge-dominated galaxies. Fourteen have colors that would classify them as Extremely Red Objects (EROs). The photometric redshifts of these EROs are all between and .
We use our wide wavelength coverage to determine rest-frame colors for the X-ray sources with spectroscopic or photometric redshifts. We find that many of the X-ray sources have the rest-frame colors of evolved red galaxies and that there is very little evolution in these colors with redshift. We also determine absolute magnitudes and find that many of the non-broad-line sources are more luminous than , even at high redshifts. We therefore infer that deep X-ray observations may provide an effective way of locating galaxies with colors similar to present-day early-type galaxies to high redshifts.
Subject headings:
cosmology: observations — galaxies: distances and redshifts — galaxies: active — X-rays: galaxies — galaxies: formation — galaxies: evolution1. Introduction
High-energy X-rays can penetrate extremely large column densities of gas and dust; hence, hard X-ray surveys are our best current method for obtaining the least biased samples of active galactic nuclei (AGNs). Ultradeep surveys with the Chandra X-ray Observatory detect the faintest X-ray sources in both the soft ( keV) and hard ( keV) X-ray energy bands and have revealed large numbers of AGNs that were missed in optical surveys. In the present paper we describe the optical and near-infrared properties of the 503 X-ray point-sources detected in the Ms Chandra exposure of the region around the Hubble Deep Field-North called the Chandra Deep Field-North (CDF-N). This exposure is the deepest X-ray image to date.
Barger et al. (2002) presented a similar catalog of the 370 X-ray point-sources detected in the Ms CDF-N exposure (Brandt et al. 2001). They had very complete redshift identifications (78%) for the galaxy sources in a radius around the approximate X-ray image center and found spectroscopic evidence for large-scale structure in the field, which could account for a part of the field-to-field variation seen in the X-ray number counts (e.g., Cowie et al. 2002; Yang et al. 2003). Such large-scale structure is also seen in the spectroscopic redshift distribution (Hasinger 2002; Gilli et al. 2003) of the X-ray sources in the Ms exposure of the Chandra Deep Field-South (Giacconi et al. 2002).
Cowie et al. (2003) constructed rest-frame keV luminosity functions versus redshift for the AGNs in a number of Chandra (including the 1 Ms CDF-N), ROSAT, and ASCA deep fields. These authors found that at , most of the keV energy density arises in sources with luminosities in the ergs s-1 range. They also showed that the number density of sources in this luminosity range rises with decreasing redshift, while the number density of higher luminosity sources exhibit the well-known peak at . Cowie et al. (2003) argued that the dominant supermassive black hole formation occurred at recent times in sources with low accretion, rather than at earlier times in more X-ray luminous sources with high accretion.
The 1 Ms Chandra surveys have also detected apparently normal galaxies with X-ray-to-optical flux ratios lower than those of AGNs, e.g., (Barger et al. 2002; Rosati et al. 2002). The majority of X-ray sources with have been shown to be consistent with infrared and radio-emitting starburst galaxies (Alexander et al. 2002a; Bauer et al. 2002), while those with even lower X-ray-to-optical flux ratios are generally consistent with quiescent galaxies with low X-ray luminosities ( ergs s-1; Hornschemeier et al. 2003). These apparently normal galaxies are distinct from the X-ray luminous, “optically normal” galaxies that have been discovered in Chandra and XMM-Newton surveys (e.g., Barger et al. 2001b; Comastri et al. 2002). The latter sources show no high ionization signatures of AGN activity in their optical spectra, and their hard to soft X-ray flux ratios suggest they are highly absorbed systems whose column densities could effectively extinguish the ultraviolet, optical, and near-infrared continua from the AGNs. Alternatively, Moran, Filippenko, & Chornock (2002) propose that, since the entire galaxy often falls within the spectrograph slit for these distant systems, the host galaxy light from stars and HII regions could be overwhelming the emission-line signatures of the AGN activity.
The 1 Ms exposure of the CDF-N has since been extended to a second megasecond (Alexander et al. 2003), enabling the detection of increasing numbers of faint AGNs and apparently normal galaxies. In this paper we present multicolor imaging and optical spectroscopy of the X-ray sources detected in the Ms CDF-N exposure. We use these data to characterize the redshift distribution and properties of the faint X-ray sources.
We take km s-1 Mpc-1 and use an , cosmology.
2. X-ray Sample
Alexander et al. (2003; hereafter, A03) presented the 1.945 Ms CDF-N X-ray images, along with details of the observations, data reduction, and technical analysis. A03 merged their point-source lists in seven X-ray bands, keV (full band), keV (soft band; SB), keV (hard band; HB), keV (SB1), keV (SB2), keV (HB1), and keV (HB2), into a catalog (Tables 3A and 3B in A03) of 503 significantly detected point sources over an area of about 460 arcmin2. Near the aim point, the data reach limiting fluxes of ( keV) and ergs cm-2 s-1 ( keV). In Table A1 of the Appendix we present optical magnitudes and spectroscopic measurements, where available, for the full X-ray point source catalog of A03.
3. Optical/Near-infrared Imaging Data
The optical imaging data consist of Johnson , Johnson , Cousins , Cousins , and Sloan observations obtained with the Subaru prime-focus camera Suprime-Cam (Miyazaki et al. 2002) on the Subaru 8.2 m telescope during February-April of 2001 and 2002. The Suprime-Cam observations and reductions are described in Capak et al. (2003a), where catalogs of the entire sample of galaxies and stars in the field can be found. band observations were obtained with the Quick Infrared Camera QUIRC (Hodapp et al. 1996) on the University of Hawaii 2.2 m telescope. The notched filter has a central wavelength of 1.8 m and covers the longer wavelength region of the band and the shorter wavelength region of the band (roughly the filter). Because of its broad bandpass and low sky background, this filter is extremely fast and is roughly twice as sensitive as the , , or filters. Barger et al. (1999) found the empirical relation to convert between the and bands; for galaxies at most redshifts, . band observations were obtained with the MOSAIC prime-focus camera (Jacoby et al. 1998; Muller et al. 1998; Wolfe et al. 1998) on the Kitt Peak National Observatory 4 m telescope. The and band data are described in Capak et al. (2003a).
The X-ray catalog of A03 has extremely good positional accuracy, which simplifies the problem of matching the X-ray sources to their optical counterparts. For individual X-ray sources, the X-ray positional uncertainties are expected primarily to reflect the centroiding accuracies and the overall distortions in the X-ray data, and are dependent on the off-axis angles and the detected counts. For each source, A03 gives an % confidence X-ray positional uncertainty in column [4] of their Table 3A. The largest such positional uncertainty is just under for a small number of sources at the outside edge of the Chandra field, while about 90% of the sources have positional uncertainties less than .
The absolute astrometry of both the X-ray catalog of A03 and the optical catalog of Capak et al. (2003a) have been matched to the VLA 20 cm catalog of Richards (2000). We tested the accuracy of the individual optical source positions relative to the VLA 20 cm positions for the 20 cm sources lying in the CDF-N region and found a deviation of . Eighty percent of the optical sources with 20 cm counterparts lie within of the radio positions. Since the radio and optical morphologies may differ, these numbers should represent an upper bound on the accuracy of the optical positions, which are generally more accurate than the X-ray positions.
Given the X-ray positional uncertainties, we identified an X-ray source with an optical counterpart if an optical source brighter than () or () is within of the X-ray position. If more than one such optical counterpart is within the search radius, then we identified the X-ray source with the nearest optical neighbor. Using this criterion, there are 429 X-ray sources with optical counterparts in the A03 sample, 278 of which have magnitudes . From Capak et al. (2003a), the surface density of galaxies and stars in the CDF-N region to is approximately 16.6 arcmin-2. Thus, with a search radius of and a sample of 503 sources, we may expect a random field contamination of about 30 sources to , or roughly 10%. (A more sophisticated analysis allowing for clustering would yield a slightly higher value, e.g., McMahon et al. 2002.) This contamination rises at fainter magnitudes. For , where the field surface density is 50.1 arcmin-2, we may expect that about 34 of the 140 optical identifications, or roughly 25%, are chance projections, based on the 225 sources that are not identified with sources. The high contamination rate at faint optical magnitudes emphasizes the need for the highest possible spatial accuracy in the X-ray sample. If we restrict to the 403 sources where the X-ray positional uncertainties are less than , and if we use a smaller search radius of to match to the optical sources, then we find that 307 of the X-ray sources have counterparts, and less than 10% of these will be random field sources.
Seven sources lie within the envelopes of bright galaxies but are separated by more than and less than from the nuclear positions. Since these may be sources lying within the galaxies, we have placed the optical positions of these off-axis X-ray sources (sources 121, 197, 270, 316, 404, 410, and 479) at the bright galaxy nuclei. However, the number of examples is sufficiently small that some of these may well just be chance projections of sources lying behind the bright galaxies. Four of these seven sources lie within of the X-ray positions, the faintest having , while two lie within () and one within (). With 503 sources in our X-ray sample, we expect three sources to lie within of an galaxy and three sources to lie within of an galaxy, based on the surface density of band selected sources in the CDF-N region (Capak et al. 2003a).
Since many of the X-ray sources have positions which are much more accurate than our chosen search radius, we can examine how accurate the A03 estimates of the X-ray positional uncertainties are, and how reliable our counterpart identifications are, by plotting the distribution of counterparts versus radial X-ray-optical separation in arcseconds for three different ranges of X-ray positional uncertainty. In Figures 3a, 1b, and 1c we plot the sources with X-ray positional uncertainties , , and , respectively. Dashed lines show how many random sources are expected as a function of radial X-ray-optical separation, assuming a uniform spatial distribution. If the A03 X-ray positional uncertainties are accurate, then we should see tighter distributions when we look at smaller X-ray positional uncertainty ranges, and this is indeed what we see. For the two highest accuracy bins, random field contamination is negligible and less than 20% of the counterparts lie beyond the 80 % X-ray positional uncertainty limits in both cases.


For the sources with optical counterparts, we measured the magnitudes centered on the optical positions. (The optical positions are set to the peak of the optical emission.) For the 67 X-ray sources with optically fainter counterparts, we centered on the X-ray positions. In all cases we measured the optical magnitudes in diameter apertures and corrected these to total magnitudes using an average offset in color. For the band we also give isophotal magnitudes. Further details may be found in Capak et al. (2003a).
Table A1 of the Appendix gives and magnitudes in the Johnson system, and magnitudes in the Kron-Cousins system, magnitudes in the Wainscoat-Cowie system (Wainscoat & Cowie 1992), and and magnitudes in the AB magnitude system. An AB magnitude is defined by , where is the flux of the source in units of ergs cm-2 s-1 Hz-1. The magnitude limits of the images in the above systems are 27.1 (), 27.0 (), 26.8 (), 26.4 (), 25.1 (), 25.4 (), and 20.5 ().
We show band thumbnail images of the CDF-N sources in Figure A1 of the Appendix. In a few cases there is complex structure in the neighborhood of the X-ray position that complicates the photometry and counterpart identification. We have noted in Table A1 the sources for which this might be a problem.
4. X-ray-to-Optical Flux Ratios
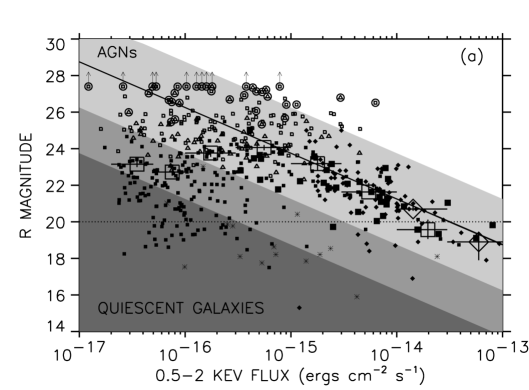
In Figure 2a we plot magnitude versus keV flux for the CDF-N soft X-ray sources. At bright X-ray fluxes, we also plot the Lehmann et al. (2001) ROSAT Ultra Deep Survey data (solid diamonds; groups and clusters and one optically unidentified source have been excluded). Spectroscopically identified stars are denoted by asterisks. We note in passing that flares of at least factors of several are observed in some of the stars (E. D. Feigelson et al., in preparation), as can be seen from their high ratios.
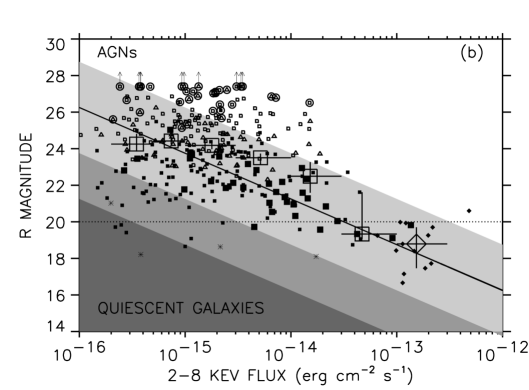
In Figure 2b we plot magnitude versus keV flux for the CDF-N hard X-ray sources. At bright X-ray fluxes, we include the Akiyama et al. (2000) ASCA Large Sky Survey data (filled diamonds; the two clusters and one source without an optical identification have been excluded, and the star is off-scale), after converting their keV fluxes to keV assuming (the value Akiyama et al. assumed in their paper for the intrinsic photon index).
The shaded regions in Figure 2 indicate typical X-ray-to-optical flux ratio ranges for different source classes. X-ray-to-optical flux ratios were found to be a good way to discriminate between source classes at bright X-ray fluxes ( ergs cm-2 s-1) from the Einstein Observatory Extended Medium-Sensitivity Survey data (e.g., Maccacaro et al. 1988); their discriminating power was later confirmed at greater depths using ultradeep ROSAT (Schmidt et al. 1998) and, finally, Chandra data (Hornschemeier et al. 2001; Barger et al. 2002). The flux in the band, , is related to the magnitude by . AGNs typically lie in the regions defined by the loci (lightest shading). We see from Figure 2 that this trend continues to hold for a large number of sources down to very faint optical magnitudes and X-ray fluxes.
Median optical magnitudes for the CDF-N X-ray sources (large open squares) and for the Lehmann et al. (2001) (Fig. 2a) or Akiyama et al. (2000) (Fig. 2b) sources (large open diamonds) are also shown. The horizontal bars show the widths of the flux bins, while the vertical bars show the 68% confidence ranges in the medians computed using the number of sources in each bin (Gehrels 1986).
In Figure 2a, at bright X-ray fluxes, matches the median optical magnitudes because the total light output from the sources is dominated by unobscured AGNs. At ergs cm-2 s-1, quite a few sources whose optical counterparts are brighter than expected for AGNs begin to populate the sample. The median optical magnitudes drop as host galaxy light from this growing population of normal galaxies begins to dominate the total light output and the ratio of the X-ray to optical light decreases. By (darkest shading), most of the sources are fairly normal galaxies whose X-ray emission is dominated by processes associated with star formation and accreting binary systems (Hornschemeier et al. 2003).
In Figure 2b, at the brightest X-ray fluxes, also matches the median optical magnitudes. However, at fainter X-ray fluxes, the medians deviate above as the sources become obscured in the optical due to dust and gas. At the faintest X-ray fluxes, the medians flatten as the optical light from the host galaxy begins to dominate the total light output from each source.
5. Spectroscopic Redshifts
The spectroscopic observations described in Barger et al. (2002) were made with the Low-Resolution Imaging Spectrograph (LRIS; Oke et al. 1995) on the Keck 10 m telescopes and with the HYDRA spectrograph (Barden et al. 1994) on the WIYN111The WIYN Observatory is a joint facility of the University of Wisconsin, Indiana University, Yale University, and the National Optical Astronomy Observatory. 3.5 m telescope. In this paper we present new spectroscopic observations that were obtained with the Deep Extragalactic Imaging Multi-Object Spectrograph (DEIMOS; Faber et al. 2002) on Keck II the nights of UT 2003 January 29–30, March 27, and April 25–27. The observations were made with the 600 lines per mm grating, giving a resolution of Å and a wavelength coverage of Å. The spectra were centered at an average wavelength of Å, although the exact wavelength range for each spectrum depends on the slit position. Each hr exposure was broken into three subsets, with the objects stepped along the slit by in each direction. The spectra were reduced in the same way as previous LRIS spectra (Cowie et al. 1996).
In the vast majority of cases, only spectra that could be confidently identified based on multiple emission and/or absorption lines were included. However, we have assigned redshifts to thirteen sources based primarily on a single line and the continuum shape. These sources may be less reliable than the other sources in the catalog. We have noted these sources in Table A1.
We have only cross-identified X-ray sources with spectroscopic counterparts if the radial offsets are . The only exceptions are the seven off-axis X-ray sources discussed in § 3. We have placed the optical positions of these off-axis sources (sources 121, 197, 270, 316, 404, 410, and 479) at the bright galaxy nuclei. [We note that the redshift for object 316 was given incorrectly in Barger et al. (2002; their object 218) to be ; the correct redshift is .]
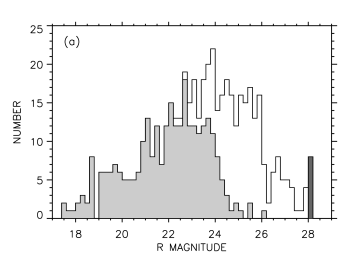
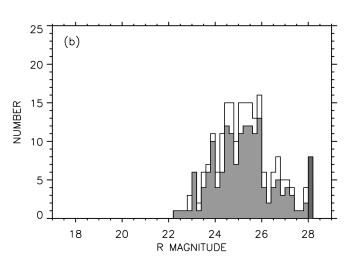
With this selection, 284 of the 503 X-ray sources (56%) have spectroscopic identifications, including 14 stars. Thirty-six of the sources have broad emission lines. Three of the redshifts (sources 173, 219, and 378) are taken from the compilation of Cohen et al. (2000). In Figure 5a we show the magnitude distribution for all 503 sources (open). We indicate which of the sources have spectroscopic identifications with the light shaded region. Of the 299 sources with , 261 (87%) have been spectroscopically identified, and the bulk of those that have not been identified lie in the magnitude range . In Figure 5b we show the magnitude distribution for the 219 CDF-N X-ray sources that either were not observed spectroscopically (open) or were observed but could not be identified (medium shading).
6. Photometric Redshifts
Broadband galaxy colors have been used in recent years to obtain photometric redshift estimates for galaxies (see Bolzonella, Miralles, & Pelló 2000 for a review). X-ray sources may have complex spectral energy distributions that arise from both the host galaxy and the AGN. Consequently, estimating photometric redshifts for X-ray sources using standard galaxy templates may be difficult. However, we are most interested in obtaining photometric redshifts for obscured AGNs whose spectroscopic signatures are not easily visible, and for those sources, photometric redshift estimates based on standard galaxy templates may be expected to work well.
Capak et al. (2003b) estimated photometric redshifts for sources in the CDF-N region using the template fitting method and photometry in the , , , , , , and bands. This method should avoid the biases at high redshifts that are introduced by the training set method (Connolly et al. 1995) or the principal component analysis method (Cabanac, de Lapparent, & Hickson 2002). Capak et al. used their large spectroscopic database to compare results from two publicly available codes, HYPERZ (Bolzonella et al. 2000) and BPZ (Bayesian photometric redshift estimation; Benítez 2000). The major difference between the codes is the inclusion of a weighting function in BPZ that reduces the number of degenerate fits at different redshifts. Additional differences are that HYPERZ includes a range of templates from the updated Bruzual & Charlot evolutionary code (GISSEL98; Bruzual & Charlot 1993), as well as the Coleman, Wu, & Weedman (1980; hereafter, CWW) templates, while BPZ only uses the templates of CWW and Kinney et al. (1996); however, BPZ does interpolate between the templates to produce intermediate templates. Also, an intrinsic reddening term is included in HYPERZ but not in BPZ, and the two codes treat non-detections differently. For most of the galaxies in the range, Capak et al. (2003b) found that the two codes produced similar results; however, HYPERZ confused a larger number of sources at with sources, which is not surprising since the weighting function in BPZ was introduced to solve this problem.
Capak et al. (2003b) were able to improve the results of both codes by tuning the photometry. They fitted templates at the known redshift for each source and then calculated the mean offset between their photometry and the template photometry. Iterating on this process produced small photometric offsets (0.049 in , 0.022 in , 0.069 in , in , and in ) that significantly improved the results (see Capak et al. 2003b for details); the and band magnitudes were fixed since the authors were confident in the photometry in those bands. The offsets are likely due to differences between real galaxies and the templates and between the real instrument filter profiles and the assumed profiles.
The BPZ code outputs the probability of , where is the galaxy redshift and is the “best” redshift estimate. When the value of is low, the redshift probability is spread over a large range in redshift, and the prediction is likely not reliable, so we applied a threshold to remove galaxies with catastrophic redshift errors (see Capak et al. 2003b for more details). We also applied a threshold to eliminate saturated sources. This is slightly fainter than the saturation limit in to also remove sources that may only be saturated in other bands. Such sources would not have good photometric redshift estimates, but since they are already spectroscopically identified, photometric redshift estimates are not needed.

In Figure 6 we plot the ratio of the photometric redshift estimate from BPZ to the spectroscopic redshift versus the spectroscopic redshift for the 193 remaining X-ray sources (172 non-broad-line and 21 broad-line sources) with both measurements. We plot the redshift ratio because what we are interested in is how accurate our distances are. This means that photometric redshift errors at low redshifts are accentuated. Some of the discrepant objects at low redshifts have complex optical structures near the X-ray source positions that contaminate the photometry. The broad-line AGNs with both spectroscopic and photometric redshifts are denoted by open squares. The photometric redshift method fails for many of them, but broad-line AGNs are straightforward to identify spectroscopically, even in the redshift range , and we now have observed the bulk of the sources in the CDF-N X-ray sample (see Figure 5b), so we do not need to worry that broad-line AGNs will contaminate our photometric redshift sample.
The photometric redshifts for the non-broad-line sources are clearly quite robust, with 94% having photometric redshifts within 25% (horizontal dashed lines) of their spectroscopic redshifts. Only one very low redshift source has a badly discrepant photometric redshift (spectroscopic redshift of and photometric redshift of 2.58) and hence is not within the vertical range of the plot. We have not attempted to refine the photometric redshifts with spectral information (e.g., there may be cases where we had insufficient spectral information to reliably identify the source spectroscopically but that information could have been used to try to improve the photometric redshifts), since for most purposes the photometric redshifts are accurate enough. The BPZ photometric redshifts presented in this paper are an improvement over the photometric redshift estimates made with HYPERZ for the 1 Ms CDF-N X-ray sources (Barger et al. 2002).
7. Redshift Distribution

In Figure 7 we show redshift versus hard X-ray flux for the spectroscopically (solid squares) and photometrically (open triangles) identified CDF-N hard X-ray sources. To avoid incompleteness at the faint end when determining the fractional light contribution from each redshift interval to the measured hard X-ray light, we consider two restricted uniform flux-limited hard X-ray subsamples, which we refer to as our “bright” and “deep” subsamples. For the bright subsample we consider a radius region around the approximate center of the X-ray image and select sources detected with fluxes above ergs cm-2 s-1. [We note, however, that above ergs cm-2 s-1 the number density of sources in the CDF-N becomes too low for an accurate measurement.] For the deep subsample we consider a radius high image quality and high exposure time region and select sources detected with fluxes between and ergs cm-2 s-1.
The numbers at the right of Figure 7 are the percentages of the measured hard X-ray light from the combined deep and bright subsamples that come from only spectroscopically identified sources in each redshift interval. The spectroscopically identified sources already comprise 75% of the measured hard X-ray light, of which at least 54% arises at redshifts below and at least 68% below . These percentages increase to 58% and 76%, respectively, if we include the sources with photometric redshifts, and they rise even higher if the bright X-ray sources found in deep ASCA surveys (Akiyama et al. 2000) are considered (see Figure 14a of Barger et al. 2002). Thus, an impressive amount of the keV extragalactic background light arises at recent times, as was first shown by Barger et al. (2001a).
In Figure 7 we show the redshift-magnitude relation for the CDF-N X-ray sources; sources without any redshift information are plotted below . Broad-line AGNs (large solid squares) are systematically the most optically luminous of the X-ray sources because of their AGN contribution to the light. The sources with photometric redshifts show a smooth continuation of the spectroscopic trend towards fainter magnitudes with increasing redshift.

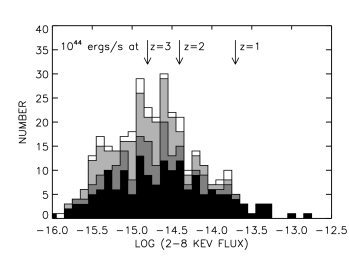
In Figure 7 we show the keV flux distribution for the CDF-N X-ray sources. Labeled arrows at the top of the figure show the flux of a source with a rest-frame keV luminosity of ergs s-1 at a redshift of , 2, or 3, computed using the keV flux and a -correction for an intrinsic power-law spectrum, where is the photon index (see Barger et al. 2002 for the reason behind this choice of ). The arrow at also roughly corresponds to the keV flux limit of ergs cm-2 s-1 where the fitted X-ray number counts give % of the keV light (Cowie et al. 2002).
Above the flux limit where roughly 80% of the light arises, there are 150 sources. Of these, the 113 with spectroscopic or photometric identifications account for most of the light; only 15% of the light is not accounted for by the identified sources. Sources with rest-frame keV luminosities greater than ergs s-1 (often called quasars) contribute 39% of the light, while fainter sources contribute 45%. Of the 25 sources in the quasar luminosity range, 15 are broad-line AGNs, and these 15 contribute 26% of the light. Six of the sources in the quasar luminosity range (sources 89, 240, 259, 390, 420, and 495) are type II AGNs, based on the presence of [NeIII], [NeV], or CIV emission lines in the spectra, though in many cases these lines are weak features superimposed on a much brighter galaxy spectrum. In one of these sources (source 420) the CIV line shows a P-Cygni profile. These six type II quasars contribute only 11% of the light and hence are not the dominant contributors to the X-ray background at these energies. One additional source in the quasar luminosity range (source 398) is a Ly emitter with absorption at CIV, while the remaining three (sources 108, 165, and 463) have only photometric redshifts.


In Figure 7a we show the spectroscopic (open) and photometric (hatched) redshift distributions for all the CDF-N X-ray sources with redshift information using a low resolution () binning. The gap in the spectroscopic redshift distribution between and 2 reflects the difficulty of identifying galaxies with redshifts in this range, where [OII] 3727 Å has moved out of the optical window and Ly 1216 Å has not yet entered in. The two broad redshift spikes seen in the 1 Ms exposure (Barger et al. 2002) have grown substantially in the 2 Ms exposure. Fifty-four spectroscopically identified sources lie between and , with a median redshift of , and 79 lie between and , with a median redshift of . Thus, these two redshift intervals contain nearly half of the identified galaxies. It is hard to quantify the significance of these peaks without knowing the true redshift distribution. If the galaxies between and were uniformly distributed, then we would expect 44 galaxies in the lower redshift bin and 55 in the higher. The peak could simply be the maximum in the redshift distribution, but it appears likely that the peak is an unique feature of the CDF-N region.

In Figures 7b and 7c we show the separate redshift distributions for the soft and hard samples, respectively, including only sources within of the approximate X-ray image center with keV fluxes above ergs cm-2 s-1 (Figure 7b) and keV fluxes above ergs cm-2 s-1 (Figure 7c). These limiting fluxes were chosen to match roughly the value where the fitted X-ray number counts give % of the light (Cowie et al. 2002). The solid arrows show the median redshifts of all the sources with spectroscopic and photometric redshifts in each sample, and the dashed arrows show the median redshifts after all the sources without any redshift information have been arbitrarily placed at high redshifts. The dashed arrows are only shifted to slightly higher redshifts than the solid arrows because most of the sources to these flux levels have already been identified.
In Figure 7 we show the redshift distribution for all the spectroscopically identified X-ray sources between and using a higher resolution () binning. The strongest single feature in the distribution is at , where 16 galaxies lie within a thousand km s-1 of the redshift. (These are split between two bins in Fig. 7 but do not contain all of the galaxies in each of the bins.) Six of these sources lie in a tight spatial clump (source 116 is the brightest galaxy in this clump).
Because of the apparent velocity sheets and complex structures in the redshift distributions of the X-ray sources in individual Chandra fields, we will need to observe a large number of fields in order to get the average true redshift distribution.
8. Optical/Near-Infrared Colors and Magnitudes
In Figure 8a we show color versus magnitude for the X-ray sources with both X-ray positional uncertainties and optical counterpart separations . (The tight positional selection is used in order to keep the field contamination low; see § 3.) Median colors for the non-broad-line sources in each magnitude bin are shown as large open diamonds. The 68% confidence ranges in the medians were computed using the number of sources in each bin (Gehrels 1986). The median color for all the broad-line sources is shown as a dashed line. The figure shows a general trend of the non-broad line sources towards bluer colors at fainter magnitudes, with the colors of the sources approaching the median blue color of the broad-line AGNs.
Schreier et al. (2001), and subsequently Koekemoer et al. (2002), also noted this color trend with magnitude from HST data on the CDF-S. They interpreted it as meaning that there are two distinct populations of sources, an optically bright red population that consists of normal galaxies at , and an optically faint blue population that consists of type 2 AGNs of low to moderate luminosity located at . Our interpretation is instead that the optically faint blue population consists of normal galaxies at . The galaxies simply appear blue in the optical because the 4000 Å break has moved beyond the band. We illustrate this in Figure 8b with a versus plot. Here the solid (open) squares denote the () sources from Figure 8a. Color-color tracks for an evolved elliptical galaxy (upper track), Sb galaxy (middle track), and irregular galaxy (bottom track) from CWW are plotted as solid lines for and as dashed lines for . The figure shows that is a natural dividing line between the optically bright X-ray sources, which are redder in , and the optically faint X-ray sources, which are bluer in .
Finally, in Figure 8c we plot versus redshift for the sources with spectroscopic (solid squares) or photometric (open triangles) redshifts to show that we have both photometric and some spectroscopic redshift confirmation for our interpretation. The sources with optically faint magnitudes are denoted by the second, larger symbols.


In fact, X-ray sources may be effective markers of red galaxies at high redshifts, as suggested (and spectroscopically confirmed for one source at from near-infrared spectroscopy) by Cowie et al. (2001). In Figure 8 we plot color versus redshift for the CDF-N X-ray sources with (a) non-broad-line spectroscopic (solid squares) or photometric (open triangles) redshifts, and (b) broad-lines (large solid squares). The overlays are CWW galaxy redshift tracks for an evolved elliptical galaxy (solid curve), Sb galaxy (dashed curve), and irregular galaxy (dotted curve). Sources with photometric redshifts smoothly extend the spectroscopically identified source population to higher redshifts and redder colors. The upper envelope of the photometrically identified sources tracks the elliptical galaxy curve, and at the higher redshifts, many of the galaxies fall into the Extremely Red Object (ERO) color range (see also Alexander et al. 2002b and Mainieri et al. 2002). Here we conservatively define EROs as having , which is equivalent to (; Barger et al. 1999). Just as for field EROs, these X-ray selected EROs could be explained by either old stellar populations at or by dust-enshrouded galaxies. Most of the EROs in the CDF-N sample (circles in Figure 2) have high X-ray-to-optical flux ratios because these sources are faint in the optical, and perhaps this signature could be used to pick out the higher redshift X-ray sources. Although we do not have spectroscopic redshifts for any of the sources redder than an Sb galaxy, and consequently our photometric redshift estimates are unconfirmed, spectroscopic identifications of high-redshift () red galaxies have recently been made, and the sources have been interpreted as the evolved descendants of galaxies that started forming stars at redshifts (Franx et al. 2003; van Dokkum et al. 2003).


It would be even more interesting to see how the rest-frame colors of the X-ray counterparts compare, and whether there are any intrinsic differences in the source properties between the brighter low-redshift sources and the fainter high-redshift ones. With our wide wavelength coverage, we are able to determine the rest-frame colors for the CDF-N X-ray sources with redshift identifications. In Figure 8a we show rest-frame AB Å color versus redshift for the X-ray sources with either spectroscopic or photometric redshifts. Beyond the colors are extrapolated and may be more uncertain. The horizontal lines show the colors of an elliptical galaxy (solid) and an Sb galaxy (dashed). The figure shows that many of the X-ray sources have the colors of evolved red galaxies and that there does not appear to be much evolution in the intrinsic colors of the galaxies with redshift. This is a rather surprising result, since passive evolution of the host galaxies would be expected to make the X-ray sources at high redshifts considerably bluer.
In Figure 8b we show the AB Å color distribution for the non-broad-line sources (open). The vertical lines show the rest-frame colors of an elliptical galaxy (solid) and an Sb galaxy (dashed). Here we can more clearly see that a very large fraction of the X-ray population has rest-frame colors within a narrow red color range. In contrast, the broad-line sources (hatched) are very blue. This latter result is expected, since the presence of a central AGN should make the rest-frame colors bluer than those of evolved galaxies.
The AGN contribution to the light is particularly strong in the ultraviolet and hence should increase the 2800 Å flux relative to the 8140 Å flux. However, this effect does not seem to be occurring in the non-broad-line sources. In fact, the number of sources with intermediate colors is rather small. The situation therefore seems to be that either the AGNs dominate the colors, as in the case of the broad-line sources, or the AGNs do not have much effect on the colors, leaving the sources to have the colors of evolved red galaxies.

We can examine the evolution of the rest-frame colors of the X-ray sources with either spectroscopic or photometric redshifts more quantitatively by dividing the sample into two redshift bins, and . In Figure 8 we show the rest-frame AB Å color distributions. There are 212 sources in the (solid) interval and 95 in the (dashed) interval. A Kolmogorov-Smirnov test shows that the maximum deviation of 0.14 is consistent with the two distributions being the same with a 95% confidence criterion. The median color of the sources is 3.0, and the median color of the sources is 3.3.

One of the most striking features of Figure 8b is that there is a clear color-color separation as a function of apparent magnitude. We might ask why apparent magnitude seems to be a reasonably good redshift diagnostic for the X-ray sources. The most likely answer is that most of the host galaxies of the X-ray sources have similar absolute magnitudes, and the X-ray sources lie in a rather uniform host galaxy population. We examine this possibility in Figure 8, where we plot absolute AB 8140 Å magnitude versus redshift for the spectroscopically identified non-broad-line sources (solid squares), photometrically identified sources (open triangles), and broad-line AGNs (large solid squares). The bottom envelope is just a selection effect against very faint optical magnitudes. The dashed line shows the galaxy from Loveday et al. (1992), which roughly corresponds to an Sb galaxy with . From Figure 8 we see that many of the non-broad-line sources are very luminous (), even at high redshifts. Thus, X-ray surveys may provide an effective way to find galaxies more luminous than with colors similar to present-day early-type galaxies to high redshifts, though at present this interpretation is based on photometric redshift estimates that currently have relatively little confirmation at these redshifts.
9. Summary
1. We presented a catalog of optical and near-infrared magnitudes and optical spectroscopy for the X-ray sources identified in the Ms Chandra exposure of the Hubble Deep Field-North region. We now have redshifts for 284 of the 503 X-ray point sources. The redshift identifications are very complete (87%) for the sources.
2. We also presented photometric redshifts, obtained using seven broadband colors and a Bayesian photometric redshift estimation code, for 78 spectroscopically unidentified sources. We expect these photometric redshift estimates to be reliable since we found that the photometric redshifts of all but 11 of the 172 spectroscopically identified non-broad-line sources with photometric redshift estimates are within 25% of the spectroscopic redshifts. Since broad-line AGNs are straightforward to identify spectroscopically, and we have now observed nearly all the X-ray sources, it is unlikely that broad-line AGNs are contaminating our photometric redshifts.
3. We showed that X-ray-to-optical flux ratios continue to be a good discriminator between X-ray source classes down to very faint optical magnitudes and X-ray fluxes, with AGNs typically falling within the region defined by the loci and quiescent galaxies lying at .
4. We constructed redshift slices of the hard X-ray sources versus hard X-ray flux and found that the spectroscopically identified sources already comprise 75% of the measured light, of which 54% arises from sources and 68% from sources. Our spectroscopic evidence for two broad redshift spikes in the X-ray source population discovered by Barger et al. (2002) has continued to grow, illustrating that the CDF-N is dominated by a rather small number of independent velocity elements. Because of the apparent velocity sheets and complex structures in the redshift distributions of the X-ray sources in individual Chandra fields, we will need to observe a large number of fields in order to get the average true redshift distribution.
5. We found that X-ray sources may be effective markers of red galaxies at high redshifts. In an versus redshift plot, the sources with photometric redshifts smoothly extend the spectroscopically identified source population to higher redshifts and redder colors. The upper envelope of the photometrically identified sources follows that of an elliptical galaxy track, and fourteen of these sources have colors that would classify them as EROs with redshifts between and .
6. With our wide wavelength coverage, we were also able to determine rest-frame colors for the X-ray sources with redshift identifications. We found that many of the non-broad-line X-ray sources have intrinsic colors of evolved bulge-dominated galaxies and that there is very little evolution in these colors with redshift, as confirmed with a Kolmogorov-Smirnov test between two redshift bins, and . If anything, the galaxies in the higher redshift interval are redder than those in the lower redshift interval. This is surprising both because passive evolution of the host galaxies would be expected to make the X-ray sources at higher redshifts bluer and because any AGN contributions to the light would make the sources bluer. Thus, it seems that either the AGN light dominates the colors, as is the case for the broad-line sources, or the AGN presence does not have much effect on the colors.
7. We showed that apparent magnitude seems to be a reasonably good redshift diagnostic for the non-broad-line X-ray sources, with there being a clear separation at a redshift of between optically bright and optically faint sources in a versus color-color plot. We suggest that this results from the fact that the X-ray sources lie in a rather uniform host galaxy population with similar absolute magnitudes. We found that many of the non-broad-line sources are very luminous (), even at high redshifts. We therefore infer that X-ray surveys may provide an effective way to find galaxies with colors similar to present-day early-type galaxies to high redshifts, though at present this interpretation is based on photometric redshift estimates that currently have relatively little confirmation at these redshift values.
References
- (1)
- (2) Akiyama, M., et al. 2000, ApJ, 532, 700
- (3)
- (4) Alexander, D. M., Aussel, H., Bauer, F. E., Brandt, W. N., Hornschemeier, A. E., Vignali, C., Garmire, G. P., & Schneider, D. P. 2002a, ApJ, 568, L85
- (5)
- (6) Alexander, D. M., Vignali, C., Bauer, F. E., Brandt, W. N., Hornschemeier, A. E., Garmire, G. P., & Schneider, D. P. 2002b, AJ, 123, 1149
- (7)
- (8) Alexander, D. M., et al. 2003, AJ, in press (astro-ph/0304392) (A03)
- (9)
- (10) Barden, S. C., Armandroff, T., Muller, G., Rudeen, A. C., Lewis, J., & Groves, L. 1994, Proc. SPIE, 2198, 87
- (11)
- (12) Barger, A. J., Cowie, L. L., Trentham, N., Fulton, E., Hu, E. M., Songaila, A., & Hall, D. 1999, AJ, 117, 102
- (13)
- (14) Barger, A. J., Cowie, L. L., Bautz, M. W., Brandt, W. N., Garmire, G. P., Hornschemeier, A. E., Ivison, R. J., & Owen, F. N. 2001a, AJ, 122, 2177
- (15)
- (16) Barger, A. J., Cowie, L. L., Mushotzky, R. F., & Richards, E. A. 2001b, AJ, 121, 662
- (17)
- (18) Barger, A. J., Cowie, L. L., Brandt, W. N., Capak, P., Garmire, G. P., Hornschemeier, A. E., Steffen, A. T., & Wehner, E. H. 2002, AJ, 125, 1839
- (19)
- (20) Bauer, F. E., Alexander, D. M., Brandt, W. N., Hornschemeier, A. E., Vignali, C., Garmire, G. P., & Schneider, D. P. 2002, AJ, 124, 2351
- (21)
- (22) Benítez, N. 2000, ApJ, 536, 571
- (23)
- (24) Bolzonella, M., Miralles, J.-M., & Pelló, R. 2000, A&A, 363, 467
- (25)
- (26) Brandt, W. N., et al. 2001, AJ, 122, 2810
- (27)
- (28) Bruzual, A. G. & Charlot, S. 1993, ApJ, 405, 538
- (29)
- (30) Cabanac, R. A., de Lapparent, V., & Hickson, P. 2002, A&A, 389, 1090
- (31)
- (32) Capak, P., et al. 2003a, AJ, submitted
- (33)
- (34) Capak, P., et al. 2003b, in preparation
- (35)
- (36) Cohen, J. G., Hogg, D. W., Blandford, R., Cowie, L. L., Hu, E., Songaila, A., Shopbell, P., & Richberg, K. 2000, ApJ, 538, 29
- (37)
- (38) Coleman, G. D., Wu, C-C., & Weedman, D. W. 1980, ApJS, 43, 393 (CWW)
- (39)
- (40) Comastri, A., et al. 2002, ApJ, 571, 771
- (41)
- (42) Connolly, A. J., Csabai, I., Szalay, A. S., Koo, D. C., Kron, R. G., & Munn, J. A. 1995, AJ, 110, 2655
- (43)
- (44) Cowie, L. L., Songaila, A., Hu, E. M., & Cohen, J. G. 1996, AJ, 112, 839
- (45)
- (46) Cowie, L. L., et al. 2001, ApJ, 551, L9
- (47)
- (48) Cowie, L. L., Garmire, G. P., Bautz, M. W., Barger, A. J., Brandt, W. N., & Hornschemeier, A. E. 2002, ApJ, 566, L5
- (49)
- (50) Cowie, L. L., Barger, A. J., Bautz, M. W., Brandt, W. N., & Garmire, G. P. 2003, ApJ, 584, L57
- (51)
- (52) Dickinson, M., et al. 2000, ApJ, 531, 624
- (53)
- (54) Faber, S. M., et al. 2002, Proc. SPIE, 4841, 186
- (55)
- (56) Fernández-Soto, A., Lanzetta, K. M., & Yahil, A. 1999, ApJ, 523, 72
- (57)
- (58) Franx, M. et al. 2003, ApJ, 587, L79
- (59)
- (60) Gehrels, N. 1986, ApJ, 303, 336
- (61)
- (62) Giacconi, R., et al. 2002, ApJS, 139, 369
- (63)
- (64) Gilli, R., et al. 2003, ApJ, in press (astro-ph/0304177)
- (65)
- (66) Hasinger, G. 2002, in New Visions of the X-ray Universe in the XMM-Newton and Chandra Era, ed. F. Jansen, (ESA SP-488; Noordwijk: ESA/ESTEC), in press (astro-ph/0202430)
- (67)
- (68) Hodapp, K.-W., et al. 1996, NewA, 1, 177
- (69)
- (70) Hornschemeier, A. E., et al. 2001, ApJ, 554, 742
- (71)
- (72) Hornschemeier, A. E., et al. 2003, AJ, in press (astro-ph/0305086)
- (73)
- (74) Jacoby, G. H., Liang, M., Vaughnn, D., Reed, R., & Armandroff, T. 1998, Proc. SPIE, 3355, 721
- (75)
- (76) Kinney, A. L., Calzetti, D., Bohlin, R. C., McQuade, K., Storchi-Bergmann, T., & Schmitt, H. R. 1996, ApJ, 467, 38
- (77)
- (78) Koekemoer, A. M., et al. 2002, ApJ, 567, 657
- (79)
- (80) Lehmann, I., et al. 2001, A&A, 371, 833
- (81)
- (82) Loveday, J., Peterson, B. A., Efstathiou, G., & Maddox, S. J. 1992, ApJ, 390, 338
- (83)
- (84) Maccacaro, T., Gioia, I. M., Wolter, A., Zamorani, G., & Stocke, J. T. 1988, ApJ, 326, 680
- (85)
- (86) Mainieri, V., Bergeron, J., Hasinger, G., Lehmann, I., Rosati, P., Schmidt, M., Szokoly, G., & Della Ceca, R. 2002, A&A, 393, 425
- (87)
- (88) McMahon, R. G., White, R. L., Helfand, D. J., & Becker, R. H. 2002, ApJS, 143, 1
- (89)
- (90) Miyazaki, S., et al. 2002, PASJ, 54, 833
- (91)
- (92) Moran, E. C., Filippenko, A. V., & Chornock, R. 2002, ApJ, 579, L71
- (93)
- (94) Muller, G. P., Reed, R., Armandroff, T., Boroson, T. A., & Jacoby, G. H. 1998, Proc. SPIE, 3355, 577
- (95)
- (96) Oke, J.B., et al. 1995, PASP, 107, 375
- (97)
- (98) Richards, E. A. 2000, ApJ, 533, 611
- (99)
- (100) Rosati, P., et al. 2002, ApJ, 566, 667
- (101)
- (102) Schmidt, M., et al. 1998, A&A, 329, 495
- (103)
- (104) Schreier, E. J., et al. 2001, ApJ, 560, 127
- (105)
- (106) van Dokkum, P. G., et al. 2003, ApJ, 587, L83
- (107)
- (108) Wainscoat, R. J., & Cowie, L. L. 1992, AJ, 103, 332
- (109)
- (110) Wolfe, T., Reed, R., Blouke, M. M., Boroson, T. A., Armandroff, T., & Jacoby, G. H. 1998, Proc. SPIE, 3355, 487
- (111)
- (112) Yang, Y., Mushotzky, R. F., Barger, A. J., Cowie, L. L., Sanders, D. B., & Steffen, A. T. 2003, ApJ, 585, L85
- (113)