RECENT RESULTS FROM THE AMANDA EXPERIMENT
1 Introduction
AMANDA-II, the final stage of AMANDA before the advent of IceCube , has been in operation since January 2000. Here, we will present results from 131 days of the year 1997, taken with AMANDA-B10 and preliminary results from 197 days of 2000, using AMANDA-II.
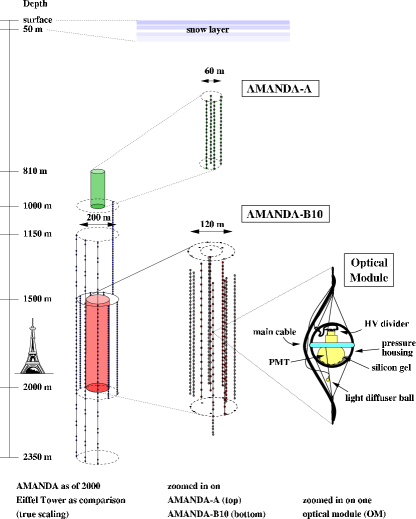
The AMANDA-II neutrino telescope, located at the geographic South Pole, uses the ice of the antarctic ice sheet as a Cherenkov medium. 677 optical modules (OM) containing Hamamatsu R5912-2 photo multipliers record the light at depths between 1150 m and 2350 m below the surface (fig. 1).
The prime goal of AMANDA is the detection of extraterrestrial neutrinos. Not bound to limitations of the two other means of observation, i.e. charged particles and gamma rays, they arrive at the Earth uninfluenced by magnetic fields or scattering off the Cosmic Microwave Background. The observation of a neutrino point source and its corresponding neutrino energy spectrum would give insight to the acceleration mechanism within the source, even if the source is optically thick. No other particles can escape the source without their spectra being distorted by interactions.
Source candidates can be classified into galactic and extragalactic. Inside our galaxy, fluxes from Super-Nova Remnants (SNR) and Micro Quasars (MQ) as well as Binary Systems have been predicted. Most prominent Extra-Galactic sources are Active Galactic Nuclei (AGN) and Gamma Ray Bursts (GRB) .
2 Atmospheric Neutrinos
The flux of atmospheric neutrinos is well known and thus provides a means of performance checking of the detector. Muons from atmospheric neutrinos are separated from muons produced by cosmic radiation by determining their origin as coming from below and above. This requires that the direction of the particles as seen by AMANDA can be reconstructed and a sufficient background suppression can be achieved. At the depth at which AMANDA is located, the flux ratio for atmospheric muons and muons from neutrinos is roughly ; this gives an idea of the challenge to be conquered.
Before starting reconstruction of events, the data is scanned for irregularities in detector behaviour. This monitoring takes place online over the whole data-taking period. Based on the observations made during this process, runs and OMs are excluded from the analysis.
As a first processing step, each event undergoes a hit-cleaning which removes hits not caused by a passing particle. These are caused by noise and after-pulsing of the PMT, or induced in the recording electronics by induction from neighbouring channels with a high signal level.
Then, three reconstruction levels are passed. In reconstruction, the arrival times of the Cherenkov photons at the OMs are used to assess the track direction and vertex. The direction is mainly characterised by the zenith angle, where zenith angle between and means a particle entering the detector from above (i.e. from the South) and angles between and indicates a particle from below (i.e. from the North).
The first reconstruction level, reducing the experimental data to 1%, retaining 90% of the atmospheric neutrino simulation, consists of a fast, non-minimising, i.e. explicitly calculable reconstruction. It does not take into account possible delay of the Cherenkov photons due to scattering in the ice. Events reconstructed with a zenith angle bigger than are kept and submitted to a reconstruction which corrects a track hypothesis with a maximum likelihood method. It uses the probability of the amount of scattering of the Cherenkov photons . This scattering is due to the optical properties of the ice embedding the OMs. To evade local peaks in the landscape formed by the mapping of the track parameters to a likelihood, the reconstruction is iterated 16 times in order to jump off the peaks and find the true global maximum. Events with a resulting zenith angle of greater than are kept.
Level 2 first restricts the result of the iterative likelihood fit to zenith angles above 80 degrees. More reconstructions are added fitting the spherical/ellipsoidal light emission of the cascade rather than a track to determine the nature of the event: track like or cascade like.
At level 3 we place restrictions on the reconstruction results and the topology of the event in order to arrive at the desired background rejection. The data is now suppressed by a factor of ; the signal simulation of atmospheric neutrinos is retained to 40%.
The resulting year 2000 data sample is thus assumed to represent mainly muons induced by atmospheric muon neutrinos. A small background contamination from atmospheric muons remains, especially around the horizon, thus an additional cut on the zenith angle to be greater than is applied.
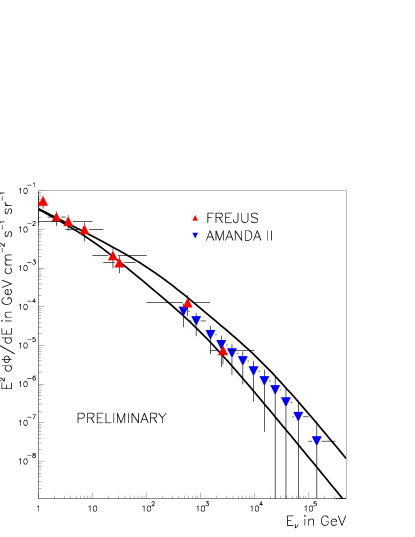
To determine the neutrino flux, it is necessary to reconstruct the energy of the muons. This is done by means of a neural network which is trained on simulated events. Simple variables such as the number of hit channels are used as input and the output is made to match the generated energy of the particle. Then, the energy of the neutrino itself is obtained from regularised unfolding taking into account the energy transfer distribution from the neutrino onto the muon.
Thus one finally arrives at the spectrum shown in figure 2. We state good agreement with the Fréjus observations . Non-consideration of systematic errors due to the misreconstructed down-going muon background so far prevents extraction of a limit on the non-atmospheric flux.
3 Neutrino Induced Cascades
The track based analysis of the atmospheric neutrinos is restricted to the muonic flavour. By looking to cascades, which have a spherical light emission pattern, one expands the capabilities to electron and tau neutrinos. An additional benefit is that light from in-situ sources gives rise to event patterns similar to that of showers. This allows for verification of the energy resolution to about 0.15 in in the range between 1 TeV and 100 TeV. Analysis of the year 2000 data yields an upper flux limit for the sum of all flavours: . Compared to the AMANDA-B10 result , this is an improvement by one order of magnitude.

4 Diffuse Flux from Extraterrestrial Neutrinos
We now present the search for diffuse high energy neutrino flux from extra–terrestrial sources in 1997 data . One exploits the harder spectrum of index -2.0 compared to the index of -3.7 for atmospheric neutrinos. Starting from a highly enriched neutrino sample, the number of channels is used as an energy estimator and a cut on it applied in order to minimise the model rejection factor (MRF ), defined as the ratio of the average upper limit and the number of expected signal events , see figure 3. An upper flux limit at 90% C.L. of is obtained.
5 Ultra High Energy (UHE) Neutrinos above 1 PeV
At high energy, the Earth becomes opaque to UHE neutrinos because of the rising cross section. It is however possible to search for high energy neutrinos above 1 PeV. This is done by looking at events close to the horizon and looking at the fraction OMs with only one hit, which enables to distinguish between bundles of atmospheric muons and single muons from high energy neutrinos. This information, together with other observables is fed into a neural net trained to indicate the nature of the event – muon bundle or single muon. This yields a sensitivity of . The actually obtained upper flux limit for 1997 data assuming an spectrum (including systematics) is .
6 Search for Neutrino Point Sources
| Candidate | Dec. [∘] | R.A. [h] | |||
|---|---|---|---|---|---|
| Crab Nebula | 22.0 | 5.58 | 2 | 1.76 | 2.1 |
| Markarian 501 | 39.8 | 16.90 | 1 | 1.57 | 1.6 |
| Cassiopeia A | 58.8 | 23.39 | 0 | 1.01 | 1.1 |
A point source search is performed by examining a binned sky for an excess of events. One calculates the significance, defined as the negative logarithm of the probability that the observed number of events in a bin is counted for the average of all bins. The resulting significance distribution is compared to a distribution obtained from random direction tracks. For the year 2000 data, no excess in significance is observed. Considering the background expectation () at different positions of candidate sources (see sect. 1), we obtain the integrated fluxes above 10 GeV shown in table 1.
7 Neutrinos from Gamma Ray Bursts
Gamma Ray Bursts are predicted to have neutrino emission associated with their photon output. This allows to directly consider events originating from the direction of the burst. The background is measured by counting neutrino events registered 1 hour before and after a 10 minute window around the burst time. Non observation of neutrino excess around the 317 bursts in the 1997-2000 BATSE catalogue yields an neutrino event upper limit of 1.45. The calculation of a flux however requires assumptions about the the flux normalisation as well as taking into account the individual nature of each GRB.
8 Systematic Effects
Systematics arise from uncertainties of input parameters in simulation of particle generation and propagation, transport of the photons through the ice and simulation of the detector itself. For the different analyses (see table 2), the contribution of single uncertainties varies, but in general it can be said that the optical properties of the ice have the biggest influence.
| Analysis | Bulk Ice | Hole Ice | OM Sens. | prop | SourceaaaCross-sections, Normalisations | Calibration &DAQ | Total |
|---|---|---|---|---|---|---|---|
| Atm , Diffuse | 15% | 25% | 15% | 10% | — | 10% +10% | 37% |
| Cascade | 20% | 9% | 5% | — | 5% | 4% | 25% |
| Point Source | — | — | — | — | 25% | — | 25% |
| UHE | 34% | — | 12%bbbHole ice included | 6% | 8% (16%cccFor atmospheric showers due to uncertainty in composition+20%dddFor atmospheric showers due to uncertainty in the absolute flux) | — | 37% (45%eeeFor atmospheric showers) |
8.1 Primary Cosmic Ray Flux
Absolute normalisation as well as the element composition of the cosmic rays have uncertainties. The first one can be estimated by comparing the spread in the flux measured by different experiments . The composition model used fits a heavy composition for the primaries. The effect on the UHE analysis was obtained by inverting the proton and iron contributions as an extreme case.
8.2 Neutrino Cross Section
Neutrino cross sections have been calculated up to eV. Below eV, all current sets of parton distributions obtain very similar cross sections. Above, the behaviour at Bjorken governs the result, leading to a uncertainty of up to a factor 2 at eV, mainly important for the UHE analysis.
8.3 Muon Propagation
The muons produced in neutrino and cosmic ray reaction are subject to uncertainties in the mean free path length and energy loss. Comparison of two different muon propagation schemes, allows an assessment of uncertainties here.
8.4 Optical Ice Parameters
The optical parameters of the bulk ice has to be determined with in-ice devices . Uncertainties here mainly arise from inhomogeneities in the ice and the assumption that during measurements photons stay within one quality of ice. We thus vary the optical properties of ice between the observed extremes to get an estimate on the magnitude of the effect.
8.5 Absolute Detector Sensitivity
The three contributions to the absolute detector sensitivity are the sensitivity of OM itself (OM sens), which has to be combined with the shadowing of the cables and the influence of the re-frozen water in the drill hole (hole ice) which accommodates each OM.
9 Conclusion
From atmospheric neutrinos to neutrinos of the highest energies, AMANDA shows its capabilities as neutrino telescope. Although no other than atmospheric neutrinos are observed, we are shown that already at limited size, it delivers substantial results on the way to IceCube. It is however important to further study systematics effects, especially of the optical ice properties. The results presented here can be found in more detail in the cited publications as well as in the papers submitted to the upcoming 28th International Cosmic Ray Conference, Tsukuba, Japan.
Acknowledgments
This research was supported by U.S. NSF office of Polar Programs and Physics Division, U.S. DoE, Swedish Natural Science Research Council, Swedish Polar Research Secretariat, Wallenberg Foundation (Sweden), German Ministery for Education and Research, DFG (Germany), Belgian funds for Scientific Research (FNRS-FWO), Flanders Institute to encourage scientific and technological research in the industry (IWT), Belgian Federal Office for Scientific,Technical and Cultural affairs (OSTC).
References
References
- [1]
- [2] J. Ahrens et al., astro-ph/0305196
- [3] J. Ahrens et al., astro-ph/0206487, submitted to Phys. Rev. D
- [4] J. Ahrens et al., astro-ph/0303218, accepted by Phys. Rev. Lett.
- [5] http://f64.nsstc.nasa.gov/batse/grb/catalog
- [6] S. Böser, Diploma Thesis, TU München, Germany, 2002
- [7] D. Chirkin, and W. Rhode, Contributed to 27th International Cosmic Ray Conference (ICRC 2001), Hamburg, Germany, 2-15 Aug 2001
- [8] K. Daum, Zeitschrift fü Physik C 66, 417 (1995)
- [9] G.J. Feldman and R.D. Cousins, Phys. Rev. D 57, 3873 (1998)
- [10] R, Gandhi, C. Quigg, M.H. Reno and I.Sarcevic, Astropart. Phys. 5, 81 (1996)
- [11] H. Geenen, Diploma Thesis, UGH Wuppertal, Germany, 2002
- [12] R. Glasstetter et al. [KASCADE Collaboration], FZKA-6345E , (), prepared for the 26th Inernational Cosmic Ray Conference (ICRC 1999), Salt Lake City, UT, 17-25 August 1999.
- [13] T. Hauschildt, Technical Report, DESY, Zeuthen 2001
- [14] G.C. Hill and K. Rawlins, Astropart. Phys 19, 393 (2003)
- [15] J.R. Hoerandel, astro-ph/0210453 submitted to Astroparticle Physics 15. April 2002; accepted 6. August 2002
- [16] J.G. Learned and K.Mannheim, Ann. Rev. Nucl. Part. 50, 679 (2000)
- [17] P. Lipari and T.Stanev, Phys. Rev. D 44, 3543 (1991)
- [18] E. Waxman Nucl. Phys. Proc. Suppl. 100, 314 (2001)
- [19] E. Waxman, J. Bahcall Phys. Rev. Lett. 78, 2292 (1997)
- [20] C.H.V. Wiebusch, DESY-Proc 1999-01, (1999)
- [21] K. Woschnagg, HE.4.1.15 in Proceedings of the 26th International Cosmic Ray Conference, Salt Lake City, 1999