Evidence for a Significant Blazar Contamination in CMB Anisotropy Maps
The analysis of the recent WMAP source catalog shows that the vast majority of bright foreground extragalactic sources detected in CMB maps are Blazars. In this paper we calculate the contamination of CMB anisotropy maps by this type of flat-spectrum, strongly variable and polarized extragalactic radio sources using up-to-date results from recent deep multi-frequency surveys. From a careful archive search and from multi-frequency catalog cross-correlations we found that more than 50 known Blazars (or Blazar candidates) expected to be above the sensitivity limit of the BOOMERANG experiment are included in the 90/150 GHz BOOMERANG anisotropy maps, a factor larger than previously reported. Using a recent derivation of the Blazar radio LogN-LogS we show that Blazars, whose counts continue to grow steeply down to faint fluxes, can sensitively affect CMB fluctuation maps with even moderate resolution and sensitivity. We calculate specifically that these sources induce an average sky brightness of , corresponding to an average temperature of K. Moreover, we find that the associated level of fluctuations is of the order of at 41 GHz and at 94 GHz. Taking into account both Blazar variability, causing the detection of a number of weak sources that rise above the detector sensitivity during flares in long-exposure satellite experiments, and the many steep-spectrum radio sources that flatten at high frequencies, as well as the contribution of radio-galaxies, we find that the level of residual fluctuation due to discrete extragalactic foreground sources could be factor of higher than the above estimate. We show that the Blazar induced fluctuations contaminate the CMB spectrum at the level of at and at , and thus they cannot be neglected in the derivation of the primordial CMB fluctuation spectrum. Careful cleaning for Blazar contamination of high sensitivity/high resolution CMB maps is therefore necessary before firm conclusions about weak features, like secondary high- peaks of the CMB power spectrum or very weak signals like CMB polarization measurements, can be achieved.
Key Words.:
Cosmology: observations,Cosmic microwave background – Galaxies: active1 Introduction
The Cosmic Microwave Background (hereafter CMB) contains - in nuce - a large amount of cosmological information. The paradigm follows from the fact that the CMB power spectrum is sensitive to the cosmological parameters which describe the fundamental properties of the universe (see, e.g., Jungman et al. 1996, Bond et al. 1997). The ability of the CMB data to constrain the cosmological parameters hinges upon the existence of acoustic oscillations in the primordial plasma at the last scattering epoch and on the ability of CMB experiments to disentangle such primordial fluctuations from those induced by cosmic structures at lower redshift.
CMB temperature fluctuations have been measured and studied in detail for the past decade starting with the large angular scale ( deg corresponding to a scale ) COBE detection (Smooth et al. 1992) up to the more recent and small-scale detection by BOOMERANG (deBernardis et al. 2000), MAXIMA (Hanany et al. 2000), DASI (Halverson et al. 2002), VSA (Grainge et al. 2002), CBI (Pearson et al. 2002) and, lastly, by WMAP (Bennet et al. 2003) which probes the CMB angular spectrum till over the whole sky with unprecedented precision. Extracting constraints on the cosmological parameters from the measurements of the CMB power spectrum is conceptually simple, but much more delicate in practice. In fact, the ability of the present and upcoming CMB experiments to determine the cosmological parameters requires a careful cleaning of the CMB maps from the galactic and extra-galactic foregrounds (see, e.g., Refregier & Spergel 2000).
At high Galactic latitudes point-like sources are one of the main contaminants at small angular scales where, even when the brightest sources are identified and then subtracted, their residual contribution may dominate over the cosmic variance uncertainty. It has been shown, in fact, that point-like sources are one of the main foreground issue for the CBI experiment which is sensitive up to (Myers et al. 2002). However, such an issue also applies to other CMB experiments like VSA, DASI, or WMAP which probe the CMB angular spectrum at lower and it is nonetheless crucial for the up-coming space missions like PLANCK. Along this line of reasoning, Pierpaoli (2003) has recently shown that point-like sources induce a contamination of level in the CMB power spectrum reconstruction even at in the simulated WMAP map at GHz. This level of contamination grows for increasing values of (i.e., for smaller angular scales) reaching a level of at . This implies that point-like sources must be successfully identified and efficiently subtracted off the CMB maps before recovering the true primordial fluctuation spectrum. Pierpaoli (2003) also showed that bright sources have the greatest impact on the power spectrum at moderate values () while the fainter sources have a greater impact at high- values.
The recent WMAP experiment (Bennet et al. 2003) resolved 208 bright pointlike sources, the vast majority of which are Blazars. We show in this paper that recent Blazar surveys, combined with detailed multi-frequency Spectral Energy Distribution analysis, provide evidence that a much larger number of Blazars and active galaxies must be present as positive temperature fluctuations already visible in the available CMB maps with even moderate spectral and spatial sensitivity. To this end, we discuss in Sect.2 the astrophysical aspect of Blazars at radio and sub-mm frequencies and we discuss in Sect.3 their contribution to the BOOMERANG 90/150 GHz anisotropy map. We also compare our results with the catalog of bright sources derived from the WMAP team. Based on an updated derivation of the Blazar counts, we derive in Sect.4 the average sky brightness of the mm sky due to the Blazar population and we compute in Sect.5 their angular power spectrum compared to the CMB power spectrum. We summarize our conclusions and we discuss the relevance of our results for the present and for the next coming CMB precision experiment in the final Sect.6.
2 Blazars at cm and mm wavelengths
Blazars are a type of radio loud Active Galactic Nuclei (AGN) distinguished by their extreme, in some cases unique, properties. These include large amplitude rapid variability, apparent superluminal motion, high level of polarization and emission of radiation across the entire electromagnetic (e.m.) spectrum, from low frequency radio waves to gamma rays, up to TeV energies in some cases. This peculiar behaviour is thought to be due to physical phenomena observed under very special circumstances such as the emission of radiation from a relativistic jet of material ejected by a radio galaxy in the direction of the observer and seen at small angle with respect to the line of sight (Urry & Padovani (1995), Blandford & Rees (1978)).
The broad band e.m. spectrum of Blazars [represented in a plane and usually referred to as the Spectral Energy Distribution or SED] is marked by a flat radio spectrum, widely believed to be due to synchrotron radiation, whose luminosity increases with frequency until it reaches a maximum that is normally located at Hz but can also reach Hz in some extreme cases. Above the synchrotron peak the spectrum falls sharply until Inverse Compton (IC) emission emerges and rises again to form a second luminosity peak which is typically located at frequencies Hz [see, e.g., Fig.1 for two examples of Blazar SEDs; many other examples of Blazar SEDs can be found in the catalog of Giommi et al. (2002a)].
Because the special conditions that make a radio galaxy appear like a Blazar are rather improbable, Blazars are much rarer than other AGN. However, since Blazars emit over the entire e.m. spectrum, while other types of AGN emit most of their radiation in the radio (radio loud only), infra-red, optical, and X-ray band, Blazars remain the extragalactic sources more frequently found in the remaining parts of the e.m. spectrum, that is the Gamma-Ray, the TeV and the microwave bands.
There are two types of Blazars: those showing a featureless spectrum, called BL Lacs, which are rare and do not show a strong cosmological evolution, and the flat radio spectrum QSOs (FSRQ), which have broad lines in their optical spectrum, are much more abundant and evolve strongly on cosmological times (Urry & Padovani (1995), Padovani (2002)). Intensity and spectral variations are conspicuous at optical frequencies and become even larger at higher frequencies. Variability in the radio part of the e.m. spectrum, as demonstrated by a monitoring program lasting more than 25 years, can reach factors of 2 to 10 on typical time-scales of weeks to years with a clear tendency to become more pronounced and more frequent at higher frequencies; polarization at radio frequencies is often present at a level of a few percent and in some case up to 10% (see, e.g., Hughes et al. (1992) and the on-line UMRAO database http://www.astro.lsa.umich.edu/obs/radiotel/umrao.html).
Radio sources of this type display a spectral shape
which is not too different from that of the CMB spectrum before and around the
peak of its power in the frequency range GHz (see, e.g., Fig.1).
For this reason Blazars can easily contaminate CMB maps (e.g., they can be
confused with CMB fluctuations) if they are bright enough to be detected by CMB
experiments. The recent results of the WMAP satellite experiment (Bennett et al. (2003))
clearly demonstrate that Blazars are present in large numbers in CMB fluctuation
maps. In fact, we found, from a cross-correlation of the 208 sources of the WMAP
catalog with catalogs of known sources and with the NED database, that of the WMAP sources are Blazar-like objects. Specifically, we found 139
FSRQ, 24 BL Lacs, and 15 radio galaxies. In addition to this evidence, we found
that the three extragalactic sources detected well above the sensitivity
threshold of the BOOMERANG maps (De Bernardis et al. (2000), Coble et al. (2003)) are also
Blazars.
To produce a more quantitative analysis of the contamination of CMB anisotropy
maps by Blazars, we provide in the following, a list of the bright known Blazars
which can be found in the 90/150 GHz BOOMERANG map. We choose to analyze the
BOOMERANG maps because it covers a statistically representative large area of the sky ) and because they are available (even though in a low
resolution format) on the web (see, e.g., http://cmb.phys.cwru.edu/boomerang/).
3 Blazars in the BOOMERANG CMB anisotropy maps
We search here for Blazars that might have already been detected in the BOOMERANG maps but not yet recognized as such. To this aim, we have built the SED of all known Blazars for which that are enough published measurements (taken from NED and from various other surveys) to allow for a reasonably safe extrapolation of the flux intensity at the frequencies 90 and 150 GHz of the BOOMERANG maps.
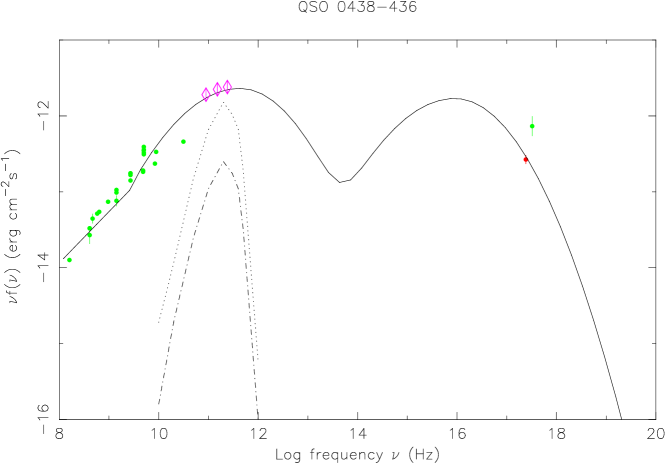
We started our analysis from the few point-like sources that have already been recognized in the BOOMERANG maps (De Bernardis et al. (2000)). Their follow-up (Coble et al. 2003) has shown their galactic (6 out of 9 sources) or extra-galactic (3 out of 9 sources) nature. The three extragalactic foreground sources are namely a Blazar (PKS0537-441), a BL Lac (PKS0521-365) and a Flat Spectrum Radio QSO (PKS0438-43). For one of these, namely PKS0438-436, we report the SED in Fig.1 where filled circles represent NED measurements and the three open diamonds at 90, 150 and 240 GHz represent the BOOMERANG measurements taken from Coble et al. (2003). To obtain a flux estimate around the peak of the CMB we fitted the multi-frequency points with a Synchrotron Self Compton (SSC) model (Perri et al. (2002), see also Perri 2003, PhD Thesis, University of Rome, La Sapienza) which is a very good approximation of the SED of Blazars in the radio and mm band. The dotted and dashed-dotted curves in Fig.1 represent the spectral distribution of typical CMB temperature fluctuations of the order of 300 and 50 respectively, which can be clearly detectable in the BOOMERANG maps. Based on the SED shown in Fig.1, the source PKS0438-436 is then associated with a fluctuation of order , as already recognized in the BOOMERANG maps. The SED of the other sources PKS 0521-365 and PKS 0537-441 are similar to the previous case but are not reported here for the sake of brevity.
Following a similar procedure we found more than 50 Blazars, or Blazar candidates, selected through a multi-frequency technique like that used in the DXRBS (Landt et al. (2001); Padovani (2002)) using the NVSS (radio), GSC2 (optical) and the Rosat (X-ray) all sky survey, for which the extrapolation of the radio data is above the detection limit of the BOOMERANG experiment. Since the SED of Blazars allows for fluxes above the BOOMERANG sensitivity and below the Rosat all sky survey sensitivity limit, the number of objects found is only a lower limit.
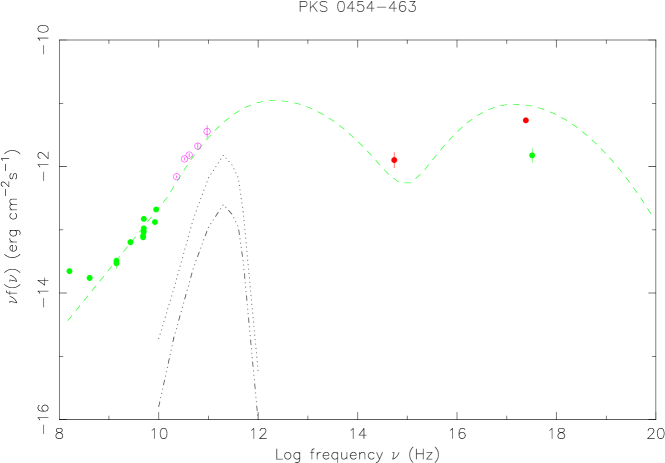
As an example of our findings, we show in the right panel of Fig.1 the SED of the source PKS 0454-483 whose expected emission at mm frequencies is similar to that of the three Blazars already found in the BOOMERANG map. Whenever a Blazar was found to have a flux corresponding to a CMB fluctuation significantly above K, we have identified its position in the 150 GHz BOOMERANG map.
We report in Fig.2 the location of the whole set of Blazars found in the 150 GHz BOOMERANG map. Their sky coordinates (RA and DEC), radio flux, optical V-band magnitude and redshift are also reported for completeness in Tab.1.

| Source name | Ra(J2000.0) | Dec(J2000.0) | Radio Flux | V-mag | Redshift | Notes |
|---|---|---|---|---|---|---|
| PKS 0252-549 | 02 53 30.7 | -54 41 40.9 | 1193 | 17.7 | 0.537 | FSRQ - WMAP |
| PKS 0257-510 | 02 58 37.7 | -50 52 15.9 | 452 | 23 | 0.834 | FSRQ |
| PKS 0308-611 | 03 09 55.6 | -60 58 27.4 | 1103 | 18.6 | - | NED: QSO |
| PKS 0310-558 | 03 12 05.8 | -55 41 38.0 | 501 | 18 | - | Blazar candidate |
| PKS 0317-570 | 03 18 55.9 | -56 50 52.0 | 257 | 17.5 | - | Blazar Candidate |
| PMN J0321-3711 | 03 21 23.2 | -37 11 33.0 | 5020 | - | - | NED: Radio S. Extended - WMAP |
| PKS 0340-372 | 03 42 05.4 | -37 03 10.9 | 872 | 18.1 | 0.284 | QSO |
| PKS 0402-362 | 04 03 53.0 | -36 04 47.9 | 1132 | 17.2 | 1.417 | FSRQ |
| PKS 0405-385 | 04 06 58.7 | -38 26 22.9 | 830 | 17.7 | 1.285 | FSRQ - WMAP |
| PKS 0410-519 | 04 11 36.1 | -51 49 19.9 | 361 | 17.5 | - | NED: QSO |
| PMN J0419-3010 | 04 19 48.2 | -30 10 06.9 | 184 | 17.5 | - | Blazar candidate |
| PMN J0422-3844 | 04 22 14.6 | -38 44 48.1 | 130 | 17 | 3.11 | NED: QSO |
| WGA J0424.6-3849 | 04 24 39.2 | -38 49 01.9 | 309 | 18.5 | 2.34 | FSRQ |
| PKS 0422-380 | 04 24 41.8 | -37 56 23.9 | 1706 | 18.1 | 0.782 | FSRQ - WMAP |
| WGA J0428.8-3805 | 04 28 50.4 | -38 05 44.1 | 51 | 16.5 | 0.15 | BL Lac |
| 1RXS J043208.7-35065 | 04 32 08.6 | -35 06 51.1 | 182 | 18 | - | Blazar candidate |
| PKS 0432-606 | 04 33 34.0 | -60 30 14.0 | 636 | 19 | - | NED: QSO |
| PKS 0435-300 | 04 37 37.4 | -29 54 11.1 | 691 | 17.2 | 1.328 | FSRQ |
| 0438-43 | 04 40 17.7 | -43 32 56.0 | 3933 | 18.8 | 2.852 | FSRQ - WMAP |
| PKS 0439-331 | 04 41 34.6 | -32 59 52.0 | 197 | - | - | NED: Blazar candidate |
| 1RXS J044510.0-38382 | 04 45 10.0 | -38 38 24.0 | 244 | 17 | - | NED: QSO - PKS 0443-387 |
| PKS 0448-392 | 04 49 42.0 | -39 10 51.9 | 819 | 16.5 | 1.288 | FSRQ |
| PKS0450-469 | 04 51 52.5 | -46 53 02.0 | 541 | 18.3 | - | NED: QSO |
| 1Jy0454-463 | 04 55 51.2 | -46 16 01.9 | 1653 | 17.4 | 0.858 | FSRQ - WMAP |
| PKS 0506-61 | 05 06 43.6 | -61 09 39.9 | 1211 | 16.9 | 1.093 | FSRQ - WMAP |
| NGC 1808 | 05 07 43.0 | -37 30 29.8 | 238 | 12.6 | 0.003 | Starburst gal. |
| PMN J0510-3533 | 05 10 54.0 | -35 33 09.0 | 123 | 18.1 | - | Blazar candidate |
| PKS 0511-484 | 05 12 51.4 | -48 24 09.0 | 1094 | 19.8 | 0.306 | NED: Radio galaxy |
| Fairall 790 | 05 14 35.4 | -49 03 33.1 | 310 | 15.9 | 0.09 | NED: Elliptical gal. |
| 1Jy 0514-459 | 05 15 48.1 | -45 57 00.0 | 990 | 17.5 | 0.194 | FSRQ |
| PKS 0518-45 | 05 19 49.0 | -45 46 45.8 | 14999 | 15.8 | 0.035 | FSRQ - WMAP |
| PKS 0521-365 | 05 22 59.4 | -36 28 01.9 | 8180 | 14.6 | 0.055 | BL Lac - WMAP |
| PMN J0525-3343 | 05 25 04.9 | -33 43 00.1 | 210 | 18.7 | 4.4 | FSRQ |
| PMN J0529-3555 | 05 29 37.1 | -35 55 22.0 | 329 | 17.7 | - | Blazar Candidate |
| 1RXS J053132.1-35333 | 05 31 32.0 | -35 33 30.9 | 173 | 18.5 | 0.9 | Blazar candidate |
| PKS 0532-378 | 05 34 18.0 | -37 47 07.0 | 528 | 19.5 | 1.668 | NED: QSO |
| PKS 0534-340 | 05 36 28.5 | -34 01 12.0 | 663 | 17.8 | 0.683 | FSRQ |
| 1Jy0537-441 | 05 38 51.0 | -44 05 06.0 | 4805 | 15 | 0.896 | BL Lac - WMAP |
| PKS 0539-543 | 05 40 47.2 | -54 18 20.8 | 373 | 18.2 | - | Blazar Candidate - WMAP |
| 1RXS J054329.1-39563 | 05 43 29.1 | -39 56 38.0 | 174.8 | 17.9 | - | Blazar candidate |
| PMNJ0545-4757 | 05 45 06.4 | -47 57 11.9 | 294 | 17 | - | Blazar Candidate in Cluster |
| PKS 0549-575 | 05 50 08.1 | -57 32 30.8 | 355 | 19.5 | - | QSO from NED - WMAP |
| PKS 0548-322 | 05 50 40.7 | -32 16 18.8 | 213 | 15.5 | 0.069 | BL Lac |
| PKS 0548-317 | 05 50 47.4 | -31 43 59.8 | 1034.5 | 9.9 | 0.033 | BL Lac |
| PKS 0555-374 | 05 57 11.1 | -37 28 13.0 | 152 | 14.2 | 0.0044 | Elliptical in Cluster |
| 1RXS J060414.4-31560 | 06 04 14.4 | -31 56 02.0 | 2960.4 | 18.5 | 0.452 | FSRQ |
| PMN J0606-3448 | 06 06 08.1 | -34 47 43.0 | 135 | 17.9 | 2.28 | NED: QSO |
| PKS 0607-605 | 06 07 55.0 | -60 31 55.9 | 558 | 18.2 | - | NED: QSO |
| PKS 0606-306 | 06 08 40.9 | -30 41 38.0 | 100 | 16.9 | - | Blazar Candidate |
| PKS 0610-316 | 06 12 29.2 | -31 39 14.0 | 643 | 18.5 | - | NED: QSO |
| PKS 0613-312 | 06 15 16.8 | -31 16 59.8 | 173.6 | 17 | - | NED: QSO |
| PKS 0410-519 | 06 22 02.1 | -47 35 52.0 | 315 | 13 | - | Blazar Candidate |
| WGA J0631.9-5404 | 06 31 59.5 | -54 04 31.0 | 155 | 18.2 | 0.193 | FSRQ |
| PKS 0646-437 | 06 48 16.7 | -43 47 00.9 | 126 | 18 | 1.029 | FSRQ |
To summarize, we found 54 known Blazars with flux greater than 200 mJy that are probably associated with fluctuations of amplitude , in the 150 GHz BOOMERANG map. The number of these Blazar point-like sources is a factor larger than previously reported (Coble et al. (2003)). A much larger number of fainter Blazars are evidently expected to be associated with lower amplitude () CMB fluctuations due to the fact that the Blazar counts steeply increase at flux fainter than mJy, as will be discussed in the next Sect.4.
The analysis of the BOOMERANG map is just an example of what we could find in a specific area of the sky surveyed at mm wavelenghts. In particular, we estimate that more 200 Blazars should be found above the BOOMERANG sensitivity limit in 1000 area. The WMAP anisotropy maps have basically the same sensitivity threshold and spatial resolution of the BOOMERANG maps and thus our results can be quite easily rescaled to the WMAP all-sky survey. Given the previous results, the Blazar populations are expected to produce a non-negligible contamination of the CMB maps as well as of the CMB power spectrum. We will address this point more specifically in the next Sects.4 and 5.
4 The sky brightness due to Blazars at cm and mm wavelengths
Precise estimates of the contribution of Blazars to the sky brightness at radio and mm frequencies have so far been hampered by the lack of sufficiently deep surveys. For a long time only very shallow (1 or 2 Jy) surveys have been available at cm frequencies (Stickel et al. (1991), Wall & Peacock (1985)). However, the recent multi-frequency approach to Blazar search is changing the picture (e.g. Laurent-Muehleisen et al. (1998), Giommi et al. (1999), Padovani (2002), Giommi et al. 2002b Giommi et al. 2002c ), making it possible to detect many fainter Blazars.
The integrated radio flux due to a population of discrete sources in the flux range can be calculated as follows:
| (1) |
where the quantity is usually referred to as the differential LogN-LogS distribution that, for a population of sources with constant density, is given by a power-law with slope equal to 2.5 which then flattens at faint fluxes of order of mJy, depending on the Blazar luminosity function. The LogN-LogS of BL Lacs is presently known down to 3.5 mJy for the subsample of extreme High Energy Synchrotron peaked (HBL) sources (Giommi et al. (1999), Giommi et al. 2002b ) while the best estimate of the LogN-LogS of the full population of BL Lacs and FSRQs currently comes from the Deep X-Ray Blazar Survey (DXRBS, Landt et al. (2001)). This is the deepest complete and radio-flux limited Blazar survey presently available which extends to 50 mJy (Padovani et al. (2003)). At radio frequencies, FSRQs are more abundant than BL Lacs by about a factor of and show a strong cosmological evolution, while BL Lacs either do not evolve or show negative cosmological evolution (Padovani (2002), Giommi et al. (1999), Bade et al. (1998), Rector et al. (2000) ). The LogN-LogS of BL Lacs is approximately euclidean up to at least 50 mJy, while below 20 mJy it flattens substantially, at least in the subsample of extreme HBL BL Lacs (Giommi et al. 2002b ). From the DXRBS survey we know that the surface density of sources brighter than 0.1 Jy at 5 GHz is 0.1 object per square degree for FSRQs and 0.025 objects per square degree for BL Lacs (Giommi et al. 2002b , Padovani et al. (2003)). We can then assume a Blazar overall density of 0.125 with flux Jy.


Since FSRQs (the dominant Blazar population) evolve strongly, while BL Lacs show no evolution (or slightly positive) at high radio fluxes (Padovani (2002)), and negative evolution below 20 mJy (Giommi et al. (1999), Giommi et al. 2002b ), we can conservatively assume an overall Blazar differential LogN-LogS with an ”Euclidean” slope of 2.5 which extends up to a break flux of the order of 10 mJy below which it flattens significantly to a slope of . This assumption is fully supported by the LogN-logS (see Fig.3) that we have built using a sample of 135 Blazars (BL Lacs + FSRQs) from the NVSS-RASS 1Jy and the 0.1 and 0.05 Jy points of the DXRBS (Padovani et al. (2003)). While this LogN-logS is consistent with the counts of flat spectrum radio sources derived by Toffolatti et al. (1998) at Jy, it does not show any flattening until a rather faint radio flux is reached and not just below 1 Jy as in the predictions based on Toffolatti et al. (1998).
Thus, given the previously discussed LogN-LogS, and setting consistently the lower integration limit to 0.1 mJy, Eq.(1) yields a radio brightness of at 5 GHz. In order to properly extrapolate this brightness to higher frequencies, we have to make use of the distribution of radio to mm spectral slopes for the Blazar population. To estimate realistic slope values we have built the Spectral Energy Distribution (SED) of all Blazars in the NVSS-RASS 1Jy survey (Giommi et al. 2002c ) using the many radio measurements available from the literature (mostly taken from NED). Since all objects in the NVSS-RASS survey are brighter than 1 Jy, several radio data points are normally available for each Blazar over a wide frequency range. We have then fitted a a power law to the radio part of spectrum and measured the distribution of spectral slopes [here ] between the cm (e.g., GHz) and mm region (e.g., and GHz). We have derived the normalized distribution shown in Fig.3 using the subsample of 135 objects with which is a requirement normally applied to build Blazar samples. Using such a spectral slope distribution, the expected 150 GHz sky brightness due to Blazars ranges from to depending mildly on the assumptions for the LogN-LogS parameters. Since the CMB brightness at 150 GHz is (e.g. Hasinger (2000)), the Blazars brightness is that of the CMB, which is only a factor of a few below the level of the presently measured CMB fluctuations and similar to the sensitivity planned for the upcoming PLANCK mission. At 41 and 94 GHz we obtain a sky brightness of 3-5 assuming that the slope of the LogN-LogS flattens from 2.5 to 2.1 at 10 mJy and integrating it down to 1 and 0.1 mJy, respectively.
This estimate is only a lower limit to the average sky brightness induced by Blazars since the DXRBS and NVSS-RASS 1Jy surveys only include sources with flat radio spectrum between 1.4 and 5 GHz, while it is well known that a number of radio source spectra that are steep at low frequencies progressively flatten at higher frequencies. Through direct 15 GHz source counts measurements (see Taylor et al. 2003) estimate that the contribution of steep-spectrum sources at 1.4-5 GHz increase the extrapolated source counts at high frequency by a factor of .
In addition, other sources that are not accounted for in Blazar surveys have been detected, as a minority population but still in fair numbers, in the WMAP experiment. These are, e.g., radio galaxies which have a often extended emission with steep radio spectrum, that outshines a much flatter spectrum nuclear component which may emerge and dominate the emission above a few tens of GHz. One example of such sources is Pictor A, a bright radio galaxy with extended steep-spectrum emission and a flat-spectrum Blazar like, nuclear component (Fiocchi & Grandi 2003, in preparation), which is included in the WMAP source catalog and is also present in the BOOMERANG maps (see Sect.2).
5 The angular power-spectrum contributed by Blazars
Assuming that the Blazar are spatially distributed like a Poissonian random sample, then the angular power spectrum, , contributed by these sources is given by
| (2) |
(Tegmark and Efstathiou 1996, Scott and White 1999). The quantity at right hand side in Eq.(2) is the usual Poisson shot-noise term (Peebles 1980, Tegmark and Efstathiou 1996) and a further term, , adds to it if the clustering of sources is not negligible (Scott and White 1999). This last clustering term can be even a factor larger than the Poissonian term at large and intermediate angular scales, (Scott and White 1999).
For the Blazar population described by the LogN-LogS given in Fig.3 we found at 41 GHz and at 94 GHz. Our results can be translated into temperature units, as is usual in CMB anisotropy studies, using the conversion between the isotropic black-body (Planckian) brightness and the CMB temperature which writes as
| (3) |
where is the a-dimensional frequency given in terms of the Planck constant , of the speed of light and of the Boltzmann constant . For WMAP, we found at 41 GHz and at 94 GHz. In Fig.4 we plot the quantity and we compare it to the CMB fluctuation power spectrum which best fits the available data.
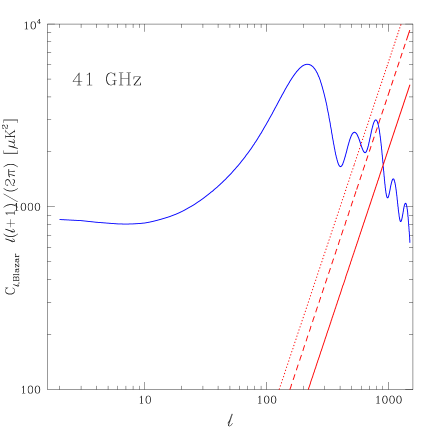
The solid line in Fig.4 shows the contribution of Blazars to the CMB fluctuation spectrum in the WMAP Q channel at 41 GHz as evaluated from the LogN-LogS given in Eq.1 which yields . We stress here that the previous value is a definite lower limit for since it neglects the contribution of steep-spectrum sources at low frequencies which flatten at these frequencies (41 and 94 GHz) and the effect of flux variability. For this reason we also show a more realistic case for the Blazar power spectrum by adding the contribution of radio sources with steep-spectrum at low radio frequencies which flatten at higher frequencies (the dashed line in Fig.4). These sources likely provide a value of which is higher by a factor (see also discussion in Taylor et al. 2003). The effect of spectral and flux variability also allows for an increase of the fluctuation level because many Blazars which are below the sensitivity threshold of CMB experiments can be detected during flares. The Blazar flux variability at millimeter wavelengths may be very substantial (higher than the factors 3-10 on time scales of weeks to years seen at cm wavelengths) and could definitely increase the level of contamination of CMB maps when these are built over long integration periods. The dotted line in Fig.4 shows the Blazar power spectrum when also this last contribution is taken into account.
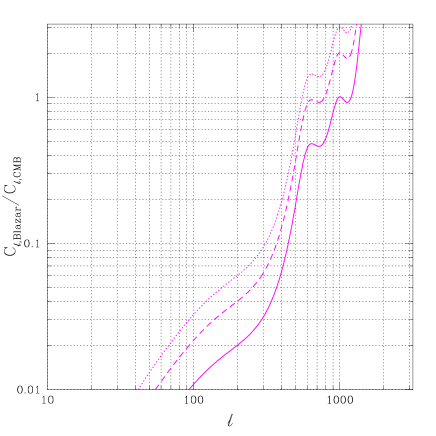
To better quantify the level of contamination of the CMB power spectrum induced by Blazars we show in the right panel of Fig.4 the ratio where has been evaluated in a CDM cosmology with which best fits the available data. It is evident from our results that, even in the case of the lower limit to (solid curve in Fig.4), the population of flat spectrum radio sources produces a power spectrum which amounts to of the CMB power spectrum at and reaches of the CMB power spectrum at . In this case the Blazar power spectrum equals the CMB power spectrum at . In a more realistic case, the addition of steep-spectrum radio sources at low- which flatten at higher ’s makes the contamination of the primordial CMB spectrum more significant. In fact, in this last case, the Blazar power spectrum (dashed curve in Fig.4) reaches a level at and nearly reaches equality at . Inclusion of variability effects increases even more the contamination (dotted curve in Fig.4) reaching a level of at and equalizing the CMB power spectrum at . Here we have not considered the statistical uncertainties of the CMB power spectrum data. These results show that Blazar-like (flat-spectrum) radio sources introduce a non-negligible contamination in CMB maps and in the CMB power spectrum reconstruction, even in the lower-limit case of considering just the flat-spectrum sources at high frequencies. Notice, that the Blazar contamination of CMB maps decreases with increasing frequency and it becomes a few % at for GHz.
We also stress that the previous calculations are performed neglecting the clustering term and thus they must be considered again as a lower limit to the realistic angular power spectrum contributed by the Blazars. Such a clustering term could produce even a factor amplification of the power spectrum at any (see, e.g., Scott and White 1999). We will consider more specifically this additional contribution elsewhere (Giommi & Colafrancesco in preparation).
It stems from the previous analysis, that the low- part of the reconstructed CMB power spectrum is heavily contaminated by Blazars even at , where the second and third acoustic peaks are expected in the best-fit cosmological model (i.e., a scenario with ). Thus, the non-negligible Blazar contamination of the CMB anisotropy spectrum at has evidently an impact on the derivation of the cosmological information which is contained in the CMB anisotropy spectrum. The second acoustic peak at is considered as an incontrovertible evidence of inflationary sound waves (see, e.g., Hu & White 1997) and its amplitude is mainly sensitive to the values of and . Increasing has the effect of decreasing the amplitude of the second peak relative to the first and third peaks. A contamination of at would tend to decrease the power of the CMB spectrum at the position where the second peak is expected in a CDM scenario. This effect, by itself, would bias the quantities and/or toward high values. The third acoustic peak (and in principle all the acoustic peaks) is mainly depending on the amount of Dark Matter in the universe and its amplitude decreases for increasing values of . The high level of contamination () of the CMB power spectrum at as well as the intrinsic uncertainty of the data render the determination of the third acoustic peak problematic. The first acoustic peak at is contaminated at a level and hence the constraint on set by CMB anisotropy data are little affected by the Blazar contamination, unless a substantial clustering of these sources can be considered as realistic. The present data do not provide strong insights on this last point and we will study it in more details in a forthcoming paper (Giommi & Colafrancesco, in preparation).
Finally, we stress that the Blazar emission is significantly polarized at the level of % at radio and optical frequencies. As a consequence of the non-negligible Blazar contamination of the CMB maps, the primordial polarization patterns could be heavily contaminated by these polarized sources. Hence, a significant contamination of CMB fluctuation maps and the non-negligible fraction of residual unresolved sky brightness will complicate the detection of primordial polarization fluctuations, as these are expected to be present only at a very low level, i.e. at a level lower than the primary CMB fluctuations (see, e.g., Hu & White 1997).
6 Conclusions
In this paper we studied the contamination of CMB fluctuation maps induced by
flat-spectrum extragalactic radio sources which shine in the frequency bands
probed by BOOMERANG and WMAP. Blazars have in fact a typical spectrum which is
similar to the CMB spectrum in the range 40 - 150 GHz. We predicted the level of
brightness and of the induced CMB anisotropy using the most updated version of
the Blazar LogN-LogS.
In view of the results presented in the previous sections, the main conclusion
of this paper can be summarized as follows:
-
•
Blazars are the major point-like, bright source contaminant of CMB maps.
-
•
We expect more than 100 Blazars to be present in the BOOMERANG 90/150 GHz maps above the sensitivity limit. We already identified more than 50 of these sources on the basis of a detailed analysis of known and candidate Blazars. We have also identified a large number of Blazars (178 out of a total of 208 sources) among the sources of the WMAP bright source catalog.
-
•
The importance of Blazars as contaminants of CMB fluctuation maps stems from the fact that their LogN-LogS is steeper than that of flat spectrum radio sources previously used to estimate the contamination of CMB maps by extragalactic sources. The observed Blazar LogN-LogS at 5 GHz combined with the measured spectral slope distribution implies a LogN-LogS at higher frequencies which is steeper than Euclidean at least down to 50 mJy at all frequencies relevant for CMB experiments. We expect, in fact, sources per deg2 at mJy, quite independently of the frequency.
-
•
We expect an induced fluctuation amplitude of the CMB map of order of which corresponds to a temperature fluctuation of at 41 GHz. The corresponding Poissonian spectrum of the Blazar population equals the CMB power spectrum at , and contaminates it at levels at and at .
-
•
The previous estimates of are a firm lower limit to the level of CMB fluctuation induced by the Blazar population. In fact, the value of the Poissonian term is likely to be higher by a factor at least considering both the Blazar variability and the contribution of steep-spectrum sources at low frequencies, radio-galaxies and possibly starburst galaxies at lower fluxes. We also stress that allowance for an appropriate clustering term might enhance substantially the angular power spectrum of the point-like sources and hence increase the level of contamination of the CMB power spectrum.
-
•
It is important to stress that flux variability at millimeter wavelengths may be very substantial (higher than the factors 3-10 on time scales of weeks to months seen at cm wavelengths) and definitely increases the level of contamination of CMB maps when these are built over long integration periods. Moreover, the Blazar variability increases with increasing frequency so that such a bias is more relevant for high-frequency CMB detections.
-
•
As a consequence of the non-negligible Blazar contamination of the CMB maps, the primordial CMB polarization seems to be greatly affected by the presence of polarized Blazars. Thus, the significant contamination of CMB fluctuation maps and the non-negligible fraction of residual unresolved sky brightness will render difficult to detect primordial polarization fluctuations.
The many high-sensitivity and high-resolution CMB experiments planned for the near future will definitely face with the problems highlighted in this paper. In fact, we predict at least 1300 sources/sr at 90 GHz which produce a flux excess corresponding to in a pixel of 15 arcmin size. One proven way of finding Blazars down to faint radio fluxes ( mJy) is to use highly efficient multi-frequency selection techniques, similarly to the DXRBS survey which has an efficiency of (Landt et al. (2001)), by cross correlating deep radio surveys (e.g., NVSS, FIRST etc.) with deep X-Ray data over the largest possible area of sky. However, to reach flux levels lower than mJy, this approach requires an X-ray sensitivity of erg cm-2s-1 . Such a sensitivity is reached in XMM-Newton and Chandra X-ray images only for a very limited area of sky. In conclusion, it is crucial to determine the level of Blazar contamination in precision CMB experiments in order to separate the contaminating foreground from the primordial CMB fluctuations and to provide a reliable determination of the cosmological parameters.
Acknowledgements.
The authors are grateful to E. Massaro for useful discussions, to P. Padovani for providing DBRBS results in advance of publication, and to M. Perri, E. Cavazzuti and S. Piranomonte for their help in the analysis of part of the NVSS-RASS 1JY data. We also thank N. Panagia for useful comments on a preliminary version of the paper. This research has made use of data from the ASI Science Data Center and from the NASA/IPAC Extragalactic Database (NED).References
- Bade et al. (1998) Bade N. et al. Astron. Astrophys. 334, 450
- Bennett et al. (2003) Bennett C.L., Bay M., Halpern M. et al. 2003a ApJ, 583, 1
- Bennett et al. (2003) Bennett C.L., 2003b ApJ submitted, astro-ph/0302208
- Blandford & Rees (1978) Blandford R.D. & Rees M.J. 1978 in Pittsburgh Conf. on BL Lac objects, p. 328
- (5) Bond, J., Efstathiou, G. and Tegmark, M. 1997, MNRAS, 291, 33
- Coble et al. (2003) Coble K., et al. 2003, ApJS, submitted, astro-ph/0301599
- De Bernardis et al. (2000) De Bernardis P. et al. 2000, Nature, 404, 955
- Hasinger (2000) Hasinger G., in ISO Surveys of a Dusty Universe, D. Lemke, M. Stickel, K. Wilke eds., Springer, astro-ph/0001360
- Giommi et al. (1999) Giommi P., Menna M. T., Padovani P., 1999, MNRAS, 310, 465
- Giommi et al. (2002a) Giommi P., et al. 2002a, Proceeding of the workshop ”Blazar Astrophysics with BeppoSAX and Other Observatories”, Giommi, Massaro & Palumbo eds., ASI special publication, p. 63
- (11) Giommi P., Perri M., Landt H., Perlman E. 2002b, Proceeding of the workshop ”Blazar Astrophysics with BeppoSAX and Other Observatories”, Giommi, Massaro & Palumbo eds., ASI special publication, p. 133
- (12) Giommi P., Perri M., Piranomonte S., Padovani P. 2002c, Proceeding of the workshop ”Blazar Astrophysics with BeppoSAX and Other Observatories”, Giommi, Massaro & Palumbo eds., ASI special publication, p. 123
- (13) Grainge, K. et al. 2002, MNRAS in press (astro-ph/0212495)
- (14) Halverson, N.W. et al. 2002, ApJ, 568, 38
- (15) Hanany, S. et al. 2000, ApJ, 545, L5
- Hu & White (1997) Hu, W. & White, M. 1997, New Astronomy, 2, 323
- Hughes et al. (1992) Hughes, P. A., Aller, H. D. & Aller M.F., 1992 ApJ, 396, 469
- (18) Jungman, G., Kamionkowski, M., Kosowski, A. and Spergel, D. 1996, Pys.Rev.D, 54, 1332
- Landt et al. (2001) Landt H., Padovani P., Perlman E.S., Giommi P., Bignall H. and Tzioumis A., 2001, M.N.R.A.S. 323, 757
- Laurent-Muehleisen et al. (1998) Laurent-Muehleisen S. A., Kollgaard R. I., Ciardullo R., Feigelson E. D., et al., 1998, ApJS, 118, 127
- (21) Myers, S.T. et al. 2002, preprint astro-ph/0205385
- Padovani (2002) Padovani P., 2002, Proceeding of the workshop ”Blazar Astrophysics with BeppoSAX and Other Observatories, Giommi, Massaro & Palumbo eds., ASI special publication, p. 101.
- (23) Pearson, T.J. et al. 2002, ApJ in press (astro-ph/0205388)
- Peebles (1980) Peebles, P.J.E. 1980, The Large-Scale Structure of the Universe (Princeton Univ. Press, Princeton)
- Perri et al. (2002) Perri M., Giommi P., Piranomonte S., Padovani P., 2002, Proceeding of the workshop ”Blazar Astrophysics with BeppoSAX and Other Observatories”, Giommi, Massaro & Palumbo eds., ASI special publication, p. 119
- (26) Pierpaoli, E. 2003, ApJ, 589, 58
- Rector et al. (2000) Rector T.A., et al. 2000, Astron. J. 120, 1626
- Urry & Padovani (1995) Urry C.M, Padovani P., 1995 Publ. Astr. Soc. Pacific 107,803
- Padovani et al. (2003) Padovani P., et al. 2003, in preparation
- (30) Refregier, A. & Spergel, D.N. 2000, ApJ, 531, 31
- Scott & White (1999) Scott, D. and White, M. 1999, A&A, 346, 1
- (32) Smooth, G.F. et al. 1992, ApJ, 396, L1
- Stickel et al. (1991) Stickel M., Padovani P., Urry C.M. Fried J.W., Kuḧr H., 1991, ApJ 374,431
- (34) Taylor, A. et al. 2003, MNRAS in press (astro-ph/0205381)
- Tegmark & Efstathiou (1996) Tegmark, M. and Efstathiou, G. 1996, MNRAS, 281, 1297
- Toffolatti et al. (1998) Toffolatti L., et al. 1998, MNRAS, 297, 117
- Wall & Peacock (1985) Wall J.V., Peacock J.A., M.N.R.A.S. 216, 173