Chapter 1 Mass Composition of the Primary Cosmic Rays in the Energy Region eV in Anomalous Diffusion Model
Abstract
We discuss the problem of cosmic ray mass composition variation in wide energy region eV. The mass composition predicted in the framework of recently developed anomalous diffusion model is tested using the results of CORSIKA calculations and experimental data on the depth of maximum of extensive air showers. We show that the model predictions for the mass composition are consistent with observations of different experiments.
1. Introduction
The measurement of the mass composition of the primary cosmic rays (PCR), especially with energies eV, is known to be one of the most actual problems of modern astrophysics. The reliable data about composition of the PCR are necessary for solving the problems of the origin of ultrahigh energy cosmic ray and also mechanisms of their acceleration and propagation through the interstellar medium.
In recent works [1-5] the new interpretation of experimental data in the framework of galactic approach were offered under assumption that cosmic-ray particles propagate through the fractal interstellar medium (the anomalous diffusion model). It was shown that the ”knee” ( eV) and the ”ankle” ( eV) in PCR energy spectrum and also phenomenon of absence of Greisen-Zatsepin-Kuzmin cutoff [6,7] could be explaned in natural way in the anomalous diffusion model (see, figure 1).
At present stage, analysis and comparison of the experimental data on extensive air showers (EAS) with results of EAS simulations is the only single effective method for the estimation of a PCR energy spectrum, composition and also for the test of hadronic interaction models at ultrahigh energies. One of the basic EAS characteristics, which can be used to determine the cosmic ray mass composition, is the depth of shower maximum .
In this paper the results of calculations of of EAS, simulated by CORSIKA(v.6.0) [8] in wide energy region for different primaries are presented. The mass composition in energy region eV, predicted in the framework of anomalous diffusion model, is compared with experimental data of different arrays, which use various detection techniques: Casa-Blanca [9], Space-Vulcan [10], Hegra-Airobicc [11], Fly’s Eye [12], HiRes-MIA [13] and Yakutsk [14].

2. Calculation and results
We used the quark-gluon string model with jets (QGSjet) which provides the best overall description of the experimental data about EAS [15]. The calculations have been made for five groups of nuclei (p, He, CNO, Ne-Si, Fe), in the standard atmosphere. For each primary particle from 500 ( eV) to 50 ( eV) events were simulated with thinning level .

| type of nuclei | a | b | c |
|---|---|---|---|
| p | -801.55 | 119.84 | -1.97 |
| He | -878.11 | 120.68 | -1.86 |
| CNO | -1131.84 | 142.84 | -2.38 |
| Ne-Si | -1164.74 | 141.26 | -2.26 |
| Fe | -1149.86 | 135.01 | -2.01 |
In figure 2 we show cascade curves of electrons for vertical showers induced by proton and iron of eV. The depths of EAS maximum were approximated by quadratic expression of the form
| (1) |
In table 1 we show the approximation coefficients for different groups of nuclei.
| E, eV | ||||||
|---|---|---|---|---|---|---|
| 0.43 | 0.25 | 0.12 | 0.11 | 0.09 | 10.91 | |
| 0.46 | 0.24 | 0.11 | 0.10 | 0.09 | 10.59 | |
| 0.51 | 0.23 | 0.09 | 0.09 | 0.08 | 9.49 | |
| 0.50 | 0.26 | 0.08 | 0.08 | 0.08 | 9.01 | |
| 0.41 | 0.26 | 0.11 | 0.11 | 0.11 | 11.55 | |
| 0.35 | 0.25 | 0.13 | 0.13 | 0.14 | 14.09 | |
| 0.31 | 0.23 | 0.15 | 0.15 | 0.16 | 15.84 | |
| 0.30 | 0.22 | 0.15 | 0.16 | 0.17 | 16.73 | |
| 0.30 | 0.21 | 0.15 | 0.16 | 0.18 | 17.04 | |
| 0.39 | 0.18 | 0.13 | 0.14 | 0.16 | 15.25 | |
| 0.81 | 0.14 | 0.03 | 0.01 | 0.01 | 2.71 | |
| 0.81 | 0.14 | 0.03 | 0.01 | 0.01 | 2.59 | |
| 0.81 | 0.14 | 0.03 | 0.01 | 0.01 | 2.59 |
For the mass composition, predicted in the framework of anomalous diffusion model (table 2), the weighted depths of shower maximum , where denotes the group of nuclei, were obtained according to CORSIKA calculations for five types of nuclei. In figure 3 we present our results for the depth of maximum in proton- and iron-induced showers and also in comparision with experimental data in the energy range eV.
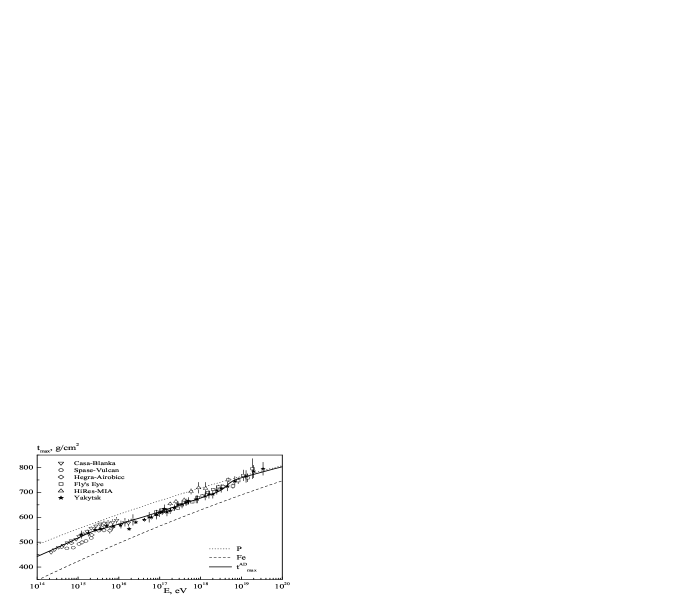
It must be emphasized that experimental data, which consistently demonstrate the remarkable lightening of the primary composition around the main features in energy spectrum ( eV and eV), and our results obtained in the framwork of anomalous diffusion model are in satisfactory agreement in the whole considered energy range.
3. Conclusions
We have considered the mass composition variation of primary cosmic rays at energy eV. CORSIKA/QGSjet simulations of extensive air showers for primary p, He, CNO, Ne-Si, Fe in a wide energy range were performed. The depth of shower maximum were estimated for mass composition predicted in the framework of anomalous diffusion model. It was shown that the experimentally observed lightening of primary composition in the ”knee” and the ”ankle” regions, is the consequence of anomalous diffusion of cosmic rays in fractal interstellar medium.
This work was supported UR grant 02.01.014.
4. References
1. Lagutin A.A., Nikulin Yu.A., Uchaikin V.V. 2001, Nucl. Phys.B (Proc. Suppl.), v.97, 267.
2. Lagutin A.A. 2001, Problems of atomic science and technology, N6(2), 214.
3. Lagutin A.A., Strelnikov D.V., and Tyumentsev A.G. 2001, Proc.of the 27th ICRC, v.5, 1896.
4. Lagutin A.A., Uchaikin V.V. 2003, Nucl. Instr. and Meth. in Phys. Res., v. B201, 212.
5. Lagutin A.A., Tyumentsev A.G. 2003, Izv. RAN, ser Fiz., v.67, N4.
6. Greisen K. 1966, Phys. Rev. Letters, v.16, 748.
7. Zatsepin G.T., Kuzmin V.A. 1966, JETP Letters, v.4, 78.
8. Heck D., Knapp J. Extensive Air Shower Simulation with CORSIKA: A User’s Guide (Version 6.00 from December 13, 2000) - Kernforschungszentrum Karlsruhe GmbH. 2000.
9. Fowler J.W., Fortson L.F., Jui C.C.H. et al. 2000, Preprint astro-ph/0003190 v2, 25.
10. Dickinson J.E., Gill J.R., Hart S.P. et al. 1999, Proc.of the 26th ICRC, 3, 136.
11. Arqueros F., Barrio J.A., Bernlohr et al. arXiv: astro - ph/9908202.
12. Bird D. et al. 1993, Phys. Rev. Lett., v.71, 3401.
13. Abu-Zayyad T., Belov K., Bird D.J. et al. 2000, Phys. Rev. Lett., v.84, N19, 4276.
14. Knurenko S., Kolosov V., Petrov Z., et al. 2001, Proc.of the 27th ICRC, v.1, 177.
15. Kalmukov N.N., Ostapchenko S.S. 1993, Yad. Fiz, v.56, N3, 105.