Is High-Velocity Cloud Complex C Associated with the Galactic Warp?
Centre for Astrophysics & Supercomputing,
Swinburne University, Mail #31, P.O. Box 218, Hawthorn, VIC 3122,
Australia
1dkawata@astro.swin.edu.au, 2cthom@astro.swin.edu.au,
3bgibson@astro.swin.edu.au
Abstract
We test the hypothesis that High-Velocity gas cloud Complex C is actually a high-latitude spiral arm extension in the direction of the Galactic warp, as opposed to the standard interpretation - that of a once extragalactic, but now infalling, gas cloud. A parallel Tree N-body code was employed to simulate the tidal interaction of a satellite perturber with the Milky Way. We find that a model incorporating a perturber of the mass of the Large Magellanic Cloud on a south-to-north polar orbit, crossing the disk at 15 kpc, does yield a high-velocity, high-latitude, extension consistent with the spatial, kinematical and column density properties of Complex C. Unless this massive satellite remains undiscovered because of either a fortuitous alignment with the Galactic bulge (feasible within the framework of the model), or the lack of any associated baryonic component, we conclude that this alternative interpretation appears unlikely.
Keywords: ISM: clouds — Galaxy: kinematics and dynamics — methods: N-body simulations
1 Introduction
Despite 40 years of intense study, the origin of thousands of High-Velocity Clouds (HVCs) remains largely a mystery. HVCs are clouds of hydrogen gas that exhibit velocities that do not conform to a simple model of galactic rotation. Covering more than a third of the sky at radio wavelengths (Murphy, Lockman & Savage 1995)111Perhaps as much as 85% of sky, as inferred by probes of lower column-density OVI gas (Sembach et al. 2003)., their origin scenarios fall into two broad categories (see Wakker & van Woerden 1997 for a comprehensive review) - Galactic and extragalactic.
Under the Galactic scenario, HVCs are considered to have a “local” origin, perhaps being infalling debris initially driven from the disk into the halo by a supernova- or stellar wind-driven “galactic fountain” (Bregman 1980), or perhaps being simply a high-latitude extension of the outer spiral arms due to the warp of the disk (Davies 1972).
The extragalactic scenario encompasses several disparate suggestions ranging from the tidal disruption of gas-rich satellites such as the Magellanic Clouds (Murai & Fujimoto 1980; Gardiner & Noguchi 1996), to the infall of proto-galactic Cold Dark Matter (CDM) Local Group building blocks (Blitz et al. 1999). In these pictures, HVCs may represent the infalling metal-poor gas invoked to reproduce the metallicity distribution function of the solar neighbourhood by many chemical evolution models of the Milky Way (Twarog 1980; Gibson et al. 2002). The most extreme variants of these extragalactic hypotheses (e.g. Blitz et al.) suggest that HVCs are in fact the baryonic tracer of the dark matter satellites predicted to exist (by cosmological CDM simulations) in large numbers throughout the Local Group (Klypin et al. 1999; Moore et al. 1999).
In recent years the HVC which has come under the greatest scrutiny is Complex C. This cloud covers over 1600 deg2 at high Galactic latitudes (20∘ 60∘), in quadrants I and II of the Milky Way. While explicitly excluded from the Blitz et al. (1999) “extragalactic origin” model, Wakker et al. (1999a) suggest that Complex C is in fact an infalling extragalactic cloud, based upon its apparently low metallicity (c.f. Gibson et al. 2001). Such an interpretation opens up the possibility that Complex C may be the baryonic component of one of the numerous halos predicted by the cosmological CDM simulations referred to earlier, which in turn could lend support to the notion that many such HVCs trace cosmologically “interesting” structures (as opposed to being more of interest in a Galactic sense). Recently, Tripp et al. (2003) have obtained a high resolution STIS spectrum of 3C 351, in which they find evidence for the hypothesis that Complex C is ablating and dissipating as it approaches the plane of the Galaxy. This idea is supported by FUSE OVI observations (Wakker et al, 2003; Sembach et al, 2003).
Converse to this picture, as early as 30 years ago Davies (1972) recognised that Complex C had a surprising projected spatial and kinematical connection to the Galaxy in the direction of the disk’s warp in Quadrant I. Davies’ hypothesis placed Complex C in the outer Milky Way, either as a high-latitude extension of the Outer Arm (where the maximum in the disk’s warp occurs), or as a separate high-latitude spiral arm. Davies suggested that the passage of the Large Magellanic Cloud on its orbit may have been responsible for both the warp and high-latitude extension (comprising Complex C), albeit without the benefit of testing that hypothesis computationally.
In what follows, we revisit this alternative suggestion as to the origin of Complex C - specifically, can the interaction of a satellite galaxy with the Milky Way induce a high-latitude extension of the Outer Arm consistent with the spatial and kinematical characteristics of Complex C? If such a model can be constructed, what are the implications for the mass and orbit of the satellite?and what is the likelihood that the model reflects reality? To address these three questions, we employ a series of Tree N-body simulations over a wide range of mass- and orbital-parameter space. In Section 2 we describe the numerical framework adopted to simulate the encounter of a satellite galaxy with that of the Milky Way. The results of these simulations are then presented in Section 3, with the accompanying discussion and conclusions provided in Section 4.
2 Model
The numerical simulations modelling the interaction of the Milky Way and a companion dwarf galaxy were conducted using a Tree N-body code. This code forms part of GCD+, our original parallel Tree N-body/SPH code described in Kawata(1999) and Kawata & Gibson (2003). The Milky Way (consisting of live halo, disk and bulge) was constructed using the MW-A model of Kuijken & Dubinski (1995). We used a disk scale-length of kpc and rotation velocity of kms-1. The halo, disk and bulge were described using 200,000, 80,000 and 20,000 particles respectively, giving particle masses of M⊙ (halo), M⊙ (disk) and M⊙ (bulge). The softening lengths (which are proportional to the particle mass to the 1/3rd power) of the halo, bulge and disk were set to 0.37 kpc, 0.35 kpc and 0.28 kpc respectively. Throughout the paper, we consider north to be along the z-axis, with the disk in the - plane. The rotation axis of the Milky Way is set to the negative direction of -axis. Under these conditions, we have confirmed the stability of the Milky Way model to the same degree as that shown by Kuijken & Dubinski (1995).
For simplicity, the dwarf companion is modelled by a rigid Plummer sphere of scale-length 1 kpc. We present three simulations showing how close an orbit, and how massive a companion, are required to reproduce high latitude gas clouds like Complex C as an extension of the Galactic Warp. The initial position, velocity and mass of the perturber for each model are shown in Table 1. Here, model A is our fiducial model. Model B has a reduced mass for the perturber, while model C is given a larger radius orbit. Once the initial position and velocity of the perturber are specified, the orbit of the perturber is self-consistently calculated by the N-body scheme. Since we construct both halo and disk with live N-body particles (as opposed to assuming a fixed potential), the effects of dynamical friction on the orbit are naturally taken into account222The effect of the dynamical friction is mainly determined by the mass of the perturber and the background density, and does not depend on the Plummer scale-length (Noguchi, 1999).
Complex C is seen in the Northern sky and we wish to consider the case where Complex C is a high scale-height extension of the Outer Arm, from the disk towards the North Galactic Pole. The orbit required to create such an extension should pass from south to north through the disk. We assume this orbit in all models. This is a simple and idealised condition. We are primarily interested in tidal forces in the z-direction and therefore only consider the (simplified) case of polar orbits. All the known close satellites of the Milky Way (i.e., LMC, SMC, Sagittarius dwarf) occupy polar orbits. This restriction is therefore useful in limiting the parameter space to be explored and enabling us to compare to the observed Milky Way satellites, whilst not limiting the usefulness of the model
We focus only on the effect of a single passage of the perturber. It would also be interesting to observe the effects of many passages of the satellite. To follow such a long evolution, however, requires that the mass-loss of the companion be taken into account. For this idealised scenario, we wish to limit the parameter space to be explored and thus only follow a single passage of the perturber. The simulations were run for 0.33 Gyr, allowing sufficient time for this single interaction to occur.
In this paper, we model the components of the Milky Way using collisionless particles. We thus only follow the effects of gravity on the dynamical evolution of the system. We recognise that both the HVC and outer disk (the region we are primarily interested in) are dominated by gas and we should, in principle, consider hydrodynamical effects. Since the gas densities are low, however, we may neglect collisional effects in the gas components for this initial study.
| Model | Mass (M⊙) | Position ( kpc) | Velocity ( kms-1) |
|---|---|---|---|
| A | 0, 0, 187 | ||
| B | 0, 0, 187 | ||
| C | 0, 0, 187 |
3 Results
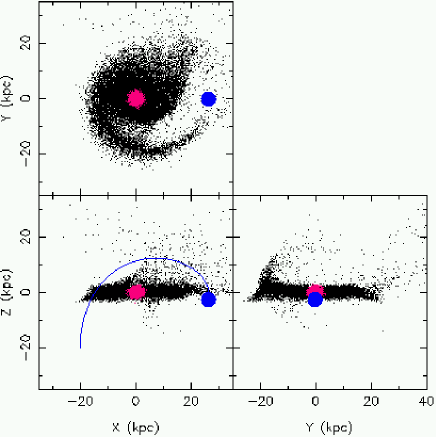
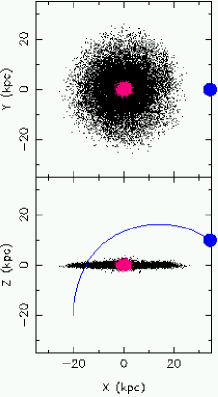
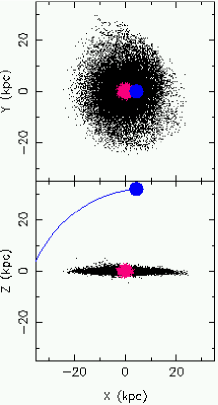
Figure 1 shows the final particle distributions of all models. As can be seen, model A is the only one in which the perturbing dwarf affects the disk. In the model A simulation, two spiral-arm patterns are induced by the tidal force of the perturber and some particles are drawn out of the disk along the orbit of the satellite. As shown below in detail, model A provides the best set of parameters for reproducing gas clouds with similar position, kinematics and column densities to Complex C. From this, we infer that to create the extended warp the perturber must be as massive as the Large Magellanic Cloud (LMC) (2 M⊙) and cross the disk on a south-to-north orbit as close as 15 kpc from the Galactic centre. We now focus on the results for this model.
 |
 |
 |
| Position (kpc) | Velocity (kms-1) | |||
| Model | ||||
| A1 | 0 | 0 | -220 | |
| A2 | 8.5 | 0 | 0 | 220 |
In the projection in the upper panel of Figure 1 we see two warps bending northwards out of the disk. We consider two sub-models (A1 and A2), in which we assume a solar position such that each warp would be located at a similar Galactic longitude to Complex C. Table 2 shows the assumed solar position and velocity in these sub-models. For simplicity, we ignore the slight difference between the solar velocity and the velocity of the Local Standard of Rest, choosing the LSR value.
 |
 |
 |
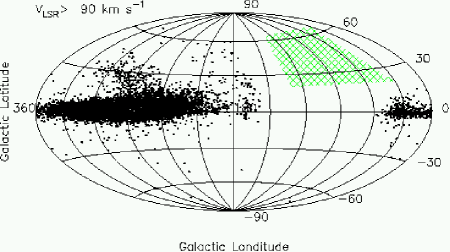 |
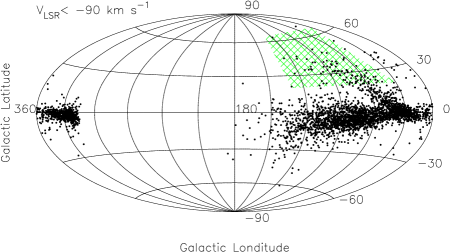
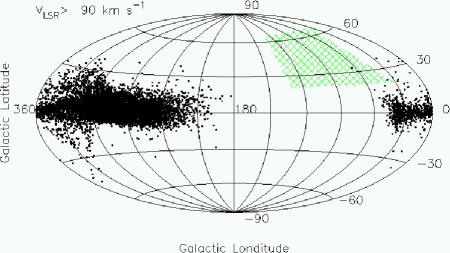
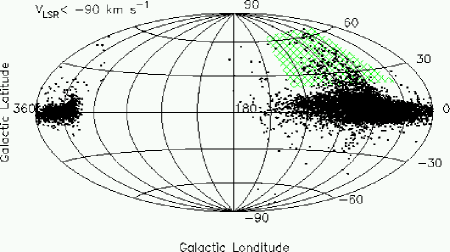
Figures 2 & 3 show all-sky positive- and negative-velocity projections of the final particle distributions for the two sub-models. In both figures, particles with galactocentric radius kpc have not been plotted, since we are interested only in the outer region. The position of Complex C in Galactic coordinates is roughly (, ) with a mean velocity of V kms-1 (Wakker 2001). In both sub-models, a significant number of particles can be seen in this area, with similar velocities to that of Complex C. Note that in both images, only particles with negative velocities populate the position of Complex C.
We also note that sub-model A2 includes a fortuitous group of particles with positive velocities in quadrant III/IV of the galaxy. This region corresponds to the same area of sky as population EP and HVC complexes WA, WB and WD. This component comes from the high-latitude extension of the warp, which is seen in the Complex C region in sub-model A1 (red circles in Figure 4). This is an interesting coincidence and natural outcome of the model. Population EP has higher VLSR ( kms-1) than complexes WA/WB/WD ( kms-1). The mean velocity of particles in the region (, ) is V kms-1. Although the spatial resolution makes it difficult to decided whether to associate Population EP or Complexes WA/WB/WD with the group of particles, the position and velocity are suggestive of Population EP. Population EP, or at least some fraction of it, has been suggested to correspond to gas associated with the Leading Arm of the Magellanic Stream (Gardiner & Noguchi 1996; Putman et al. 1998), or a gas filament falling into the Local Group (Blitz et al. 1999). The warp origin is a possible alternative explanation for population EP. Distance measurements for population EP would be crucial test for these scenarios.
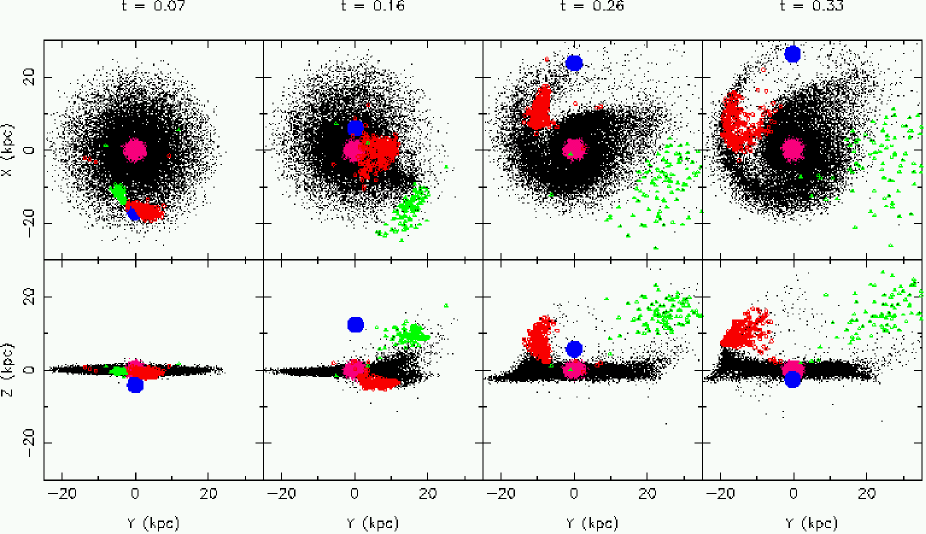
To date, no stellar content associated with Complex C has been detected. We would therefore expect any particles in the region of Complex C to have come from a gas-dominated region i.e., the edge of the disk. Figure 4 shows the morphological evolution of model A, with the perturber crossing the disk at a radius of 15 kpc. Disk particles are drawn up out of the disk by the tidal force. The face-on view shows the spiral pattern induced by the tidal interaction. The particles which finally settle in the Complex C region have been tagged by triangles (for sub-model A1) or circles (sub-model A2). Before the interaction, these particles lie at the edge of the disk (t=0.07 of Figure 4). We thus justify the claim that, at the end of the simulation, particles in the region of Complex C should represent mainly gas, in agreement with observations.
We also note that, since the particles originate from well outside the solar-circle, the metallicity of the gas would be expected to be sub-solar. Complex C has been extensively studied in the UV, in order to obtain metallicity information (e.g. Wakker et al, 1999a; Gibson et al, 2001; Tripp et al, 2003). The reported metallicities have differed, depending on the sight-lies studied and techniques used to derive abundances. Recent studies (Tripp et al, 2003; Collins et al, 2003) agree on a metallicity range of Z⊙. Under the conditions we present, drawing gas from the disk at a radius of 15 kpc, we would expect metallicities consistent with this range based on observations of disk gas metallicities (e.g., Afflerbach et al. 1997).
It is worth noting that, just before the perturber crosses the disk, particles represented by circles (see Figure 4) lead the perturber (i.e. are ahead in the disk rotation direction), whilst those particles shown as triangles trail the perturber. The evolution of the two sets of particles is quite different. In the case of the triangles, the perturber’s tidal force increases the angular momentum of the particles. This increase in angular momentum throws the particles to the outer disk as they slowly move up out of the disk (towards galactic north). Conversely, the particles leading the perturber will have a net decrease in angular momentum. This causes the particles to fall in towards the bulge. Since the perturber is initially on the south side of the disk, these particles first move downward, before they are dragged north of the disk as the perturber moves on its orbit up out of the disk. Thus the morphology of the two sets of particles is determined by their original position with respect to the satellite.
 |
 |
A final consideration is the (HI) column density. Figure 5 shows the column density contour map for each sub-model. The plotted column density is the projected density of all high-velocity particles ( kms-1 - this level, and the contour levels, are the same as those used in Figure 2 of Wakker (1991)), assuming that 76 of the mass of each particle is neutral hydrogen (this is the primordial value and hence the largest possible fraction). Again, particles with Galactocentric radius less than 5 kpc have been excluded. As Wakker (1991) notes, the column density of Complex C is between cm-2 and cm-2, and more than cm-2 in some small parts.
Figure 5 demonstrates that both models A1 and A2 successfully reproduce an extended HI gas structure in the region of Complex C. The predicted HI column density is slightly higher than that of Complex C, but this prediction will be an upper limit on the value. If the metallicity of the gas is not primordial, and/or some fraction of the hydrogen is ionised, then we expect the (predicted) column density to decrease333The assumption of no ionisation gives a conservative upper limit. In practice, H measurements show the ionisation factor is non-zero (Wakker, 1999a; Wakker, 1999b). . Hence the predicted column density for both models acceptably agrees with the observed Complex C column density. Since the HI fraction of Complex C is not well-known, further precise comparison is difficult.
Table 3 summarises the properties of the Complex C candidates in sub-models A1 and A2, which are measured by counting the particles with kms-1 in the region (, ). As also seen in Figures 2 and 3, both models succeed in reproducing the kinematical characteristics of Complex C. Neither the total mass of, nor distance to, Complex C are known. The column density discussed above is a combination of these two factors. Non-detections of CaII absorption by Complex C in 5 stellar probes have set a firm lower limit of 1.2 kpc on the distance to Complex C (discussed by Wakker (2001)). A less firm limit of 6.1 kpc is set by further CaII non-detections. These limits are not particularly restrictive and not inconsistent with the model presented here.
| Total mass | Mean velocity | Distance | |
|---|---|---|---|
| Model | (M⊙) | (kms-1) | (kpc) |
| A1 | 32.7 | ||
| A2 | 18.4 |
4 Discussion and Conclusion
Using a series of high-resolution N-body simulations, we modelled the interaction of the Milky Way (consisting of bulge, disk and live halo) with a dwarf companion galaxy. We found that a perturber with mass of order M⊙ (a similar size to the LMC) and which crosses the disk at a Galactocentric radius of order 15 kpc can induce a high-latitude extension of the Outer Arm. This extension is consistent with the spatial, kinematical and column-density characteristics of Complex C. We have also shown in Figure 1 that such a high-latitude extension cannot be induced by a perturber with mass smaller than M⊙ or with an orbit which crosses the disk at greater than 15 kpc.
According to recent orbital analysis of the LMC (e.g. Gardiner & Noguchi 1996), the pericentre of the LMCs orbit is 45 kpc and thus it must cross the disk plane well outside the 15 kpc boundary. Our study therefore suggests that the LMC cannot be responsible for such a high scale-height extension of the Outer Arm. This is consistent with the prediction of Hunter & Toomre (1969).
The predicted orbit of the recently discovered Sagittarius dwarf galaxy has a smaller perigalacticon of 15 kpc (Ibata & Lewis 1998). Despite its favourable orbit, however, the mass of the Sagittarius dwarf is smaller than the LMC by an order of magnitude (109 M⊙) and the predicted last passage through the disk is from North to South at a radius of 70 kpc.
Thus, our scenario would require a large, heretofore undiscovered, companion dwarf galaxy. It may be possible for such a perturber to be obscured by the Galactic Bulge. Figure 4 shows this is possible within the confines of our simulation (sub-model A1). If such a satellite had such a close orbit, a stellar and/or gas tidal stream would be expected. The formation of such a stream is, however, dependant on the stellar/gas mass to dark halo mass ratio (Johnston et al., 1996; Ibata et al., 2001)444Also, a luminous, baryonic stream is only expected if the perturber initially has such a component. A pure Dark Matter halo would leave no such stream. To date, there is no observational evidence for such a stream. Another possibility is the lack of any associated detectable baryonic component, i.e., a dark galaxy (e.g., Trentham et al. 2001). We view both possibilities as highly unlikely. Further, Figures 1 and 4 show that a satellite with the required mass and orbit to create Complex C would be massive enough to significantly thicken the thin disk. We have measured exponential scale-heights of the disk and obtained kpc before the interaction and kpc after the interaction. The final disk thickness is inconsistent with observations of the scale-height of the thin disk (0.3 kpc). We thus take our results to be strong (but not conclusive) evidence against the suggestion of Davies (1972) that Complex C is a high scale-height extension of the Outer Arm induced by a past interaction with a satellite dwarf galaxy.
A dwarf satellite interaction is not the only way to make such an extension of the Outer Arm. Recently, Bekki & Freeman (2002) showed that a rotating triaxial dark halo can induce a high-latitude extension of the outer disk gas. This model may be able to explain the scenario in which Complex C is part of the Outer Arm, although according to their paper, the quantitative comparison of the kinematical and spatial properties of Complex C with numerical simulation is still in progress.
The present study provides no discussion on the validity of other formation scenarios for Complex C (e.g. the Galactic Fountain or extragalactic models). Complex C is the largest HVC and its kinematical and chemical properties have been extensively observed using various facilities from the UV to radio wavelengths. This paper has shown that the observed kinematical properties give useful constraints on one formation scenario. To understand the origin of Complex C, as well as other HVCs, quantitative comparisons between observation and numerical simulations (both chemical and dynamical properties) are important. In future work, we plan to test other formation models, taking advantage of our original chemo-dynamical evolution code, GCD+.
Acknowledgements
We acknowledge the Yukawa Institute Computer Facility, the Astronomical Data Analysis Centre of the National Astronomical Observatory Japan, and the Victorian and Australian Partnerships for Advanced Computing, where the simulations described here were performed. This work is supported by the Australian Research Council (A0010517 and DP0343508) and the Swinburne University Research Development Grants Scheme.
References
Afflerbach, A., Churchwell, E. & Werner, M.W., 1997, ApJ, 478, 190
Bekki, K. & Freeman, K.C. 2002, ApJ, 574, L21
Blitz, L., Spergel, D.N., Teuben, P., Hartmann, D. & Burton, W.B., 1999, ApJ, 514, 818
Bregman, J.N., 1980, ApJ, 236, 577
Collins, J.A., Shull, J.M., & Giroux, M.L., 2003, ApJ, 585, 336
Davies, R.D., 1972, MNRAS, 160, 381
Gardiner, L. & Noguchi, M., 1996, MNRAS, 278, 191
Gibson, B.K., Fenner, Y., Maddison, S.T. & Kawata, D., 2002, in Extragalactic Gas at Low Redshift, eds. J.S. Mulchaey & J.T. Stocke, (San Francisco: ASP), 225
Gibson, B.K., Giroux, M.L., Penton, S.V., Stocke, J.T., Shull, M. . & Tumlinson, J., 2001, AJ, 122, 3280
Hunter, C., & Toomre, A., 1969, ApJ, 155, 747
Ibata, R.A., & Lewis, G.F., 1998, ApJ, 500, 575
Ibata, R.A., Irwin, M., Lewis, G. F., & Stolte, A., 2001, ApJL, 547, 133
Johnston, K.V., Hernquist, L., & Bolte, M., 1996, ApJ, 465, 278
Kawata, D., 1999, PASJ, 51, 931
Kawata, D., & Gibson, B.K., 2003, MNRAS, 340, 908
Klypin, A., Kravtsov, A.V., Valenzuela, O. & Francisco, P., 1999, ApJ, 522, 82
Kuijken, K. & Dubinski, J., 1995, MNRAS, 277, 1341
Moore, B., Ghigna, S., Governato, F., Lake, G., Quinn, T. & Stadel, J., 1999, ApJ, 524, L19
Murphy, E.M., Lockman, F.J. & Savage, B.D., 1995, ApJ, 447, 642
Murai, T. & Fujimoto, M., 1980, PASJ, 32, 581
Noguchi, M., 1999, ApJ, 514, 77
Putman, M.E., et al., 1998, Nature, 394, 752
Sembach, K.R., Wakker, B.P., Savage, B.D., et al., 2003, ApJS, 146, 165
Trentham, N.,Möller, O., & Ramirez-Ruiz, E., 2001, MNRAS, 322, 658
Tripp, T.M, Wakker, B.P., Jenkins, E.B., et al, 2003, AJ, submitted (astro-ph/0302534)
Twarog, B.A., 1980, ApJ, 242, 242
Wakker, B.P., 1991, A&A, 250, 499
Wakker, B.P., 2001, ApJS, 136, 463
Wakker, B.P., Howk, J.C., Savage, B.D., van Woerden, H., Tufte, S.L., Schwarz, U.J., Benjamin, R., Reynolds, R.J., Peletier, R.F. & Kalberla, P.M.W., 1999a, Nature, 402, 388
Wakker, B.P., Howk, J.C., Savage, B.D., Tufte, S.L., Reynolds, R.J., van Woerden, H., Schwarz, U.J. & Peletier, R.F., 1999b, ASP Conf. Ser. 166, 26
Wakker, B.P., Savage, B.D., Sembach, K.R., et al., 2003, ApJS, 146, 1
Wakker, B.P. & van Woerden, H., 1997, ARAA, 35, 217