Self-Similar Models for the Mass Profiles of Early-type Lens Galaxies
Abstract
We introduce a self-similar mass model for early-type galaxies, and constrain it using the aperture mass-radius relations determined from the geometries of 22 gravitational lenses. The model consists of two components: a concentrated component which traces the light distribution, and a more extended power-law component () which represents the dark matter. We find that lens galaxies have total mass profiles which are nearly isothermal, or slightly steeper, on the several-kiloparsec radial scale spanned by the lensed images. In the limit of a single-component, power-law radial profile, the model implies , consistent with isothermal (). Models in which mass traces light are excluded at confidence. An cusp (such as the Navarro-Frenk-White profile) requires a projected dark matter mass fraction of inside 2 effective radii. These are the best statistical constraints yet obtained on the mass profiles of lenses, and provide clear evidence for a small but non-zero dark matter mass fraction in the inner regions of early-type galaxies. In addition, we derive the first strong lensing constraint on the relation between stellar mass-to-light ratio and galaxy luminosity : , which is consistent with the relation suggested by the fundamental plane. Finally, we apply our self-similar mass models to current problems regarding the interpretation of time delays and flux ratio anomalies in gravitational lens systems.
1 Introduction
The structure of galaxies is closely linked to their formation and evolution, and therefore provides a vital testing ground for the cold dark matter (CDM) paradigm which has proven so successful on large scales (e.g., Spergel et al. 2003). The primary observable is the shape of the radial mass profile, from which the relative distributions of luminous and dark matter can be determined. The outermost regions of galaxies have now been extensively probed using weak lensing (e.g., Fischer et al. 2000; McKay et al. 2001; Kleinheinrich et al. 2003) and satellite dynamics (e.g., Zaritsky et al. 1997; Romanowsky & Kochanek 2001; McKay et al. 2002; Prada et al. 2003), each of which reveals an extended dark matter halo out to . Methods for tracing the inner regions of galaxies largely depend on the galaxy morphology. Spiral galaxies are the most easily studied, and are consequently the best understood, as rotation curves can be mapped to using kinematic tracers such as HI. Flat rotation curves at clearly indicate the presence of dark matter (e.g., Rubin, Thonnard & Ford 1980), but dynamical observations also suggest that the inner halo may be significantly less concentrated (e.g., McGaugh & de Blok 1998; de Blok et al. 2001; Salucci 2001; de Blok & Bosma 2002) than the cuspy halos predicted by CDM simulations (e.g., Moore et al. 1999b; Bullock et al. 2001).
Compared to their late-type counterparts, early-type (elliptical and lenticular; E/S0) galaxies are not as well understood. Some of the best evidence for dark matter outside of a few optical radii has been obtained from investigations of the extended, X-ray emitting gas (e.g., Fabbiano 1989; Matsushita et al. 1998; Loewenstein & White 1999). The inner regions of early-type galaxies are typically probed using stellar dynamics (e.g., Rix et al. 1997; Gerhard et al. 2001). However, the velocity dispersion is not an unambiguous tracer of the mass profile, as it requires an understanding of the orbital anisotropy. In addition, the existence of a tight fundamental plane (FP; Djorgovski & Davis 1987; Dressler et al. 1987) presumably provides clues about the inner structure of early-type galaxies, but little consensus has been achieved regarding its meaning (e.g., Faber et al. 1987; Renzini & Ciotti 1993; van Albada, Bertin & Stiavelli 1995; Ciotti, Lanzoni & Renzini 1996; Pahre, de Carvalho, & Djorgovski 1998; Bertin, Ciotti, & Del Principe 2002). Many outstanding questions therefore remain regarding the structure of E/S0 galaxies, the universality of this structure, and its relation to the predictions of CDM models.
Strong gravitational lensing is a powerful and unique tool for investigating the mass distributions in early-type galaxies at intermediate redshift, as it probes mass directly. First, model-independent projected masses may be inferred from the geometry of the lensed images (e.g., Schneider, Ehlers & Falco 1992). When mass models are normalized by this constraint, the stellar velocity dispersion becomes a far more sensitive probe of the radial mass profile. Ongoing efforts by the Lens Structure and Dynamics (LSD) survey (Koopmans & Treu 2002, 2003; Treu & Koopmans 2002a; collectively “KT”) have made significant progress in obtaining and interpreting dynamical measurements in gravitational lens systems. Second, models of the galaxy mass distribution can be constructed based on the positions, morphologies and flux ratios of the lensed images. Of particular importance are the additional astrometric constraints obtained from complex structure in the lensed source, which can be used to break degeneracies and distinguish among radial mass profiles. These constraints include large-scale extended emission from radio lobes (e.g., Kochanek 1995) or quasar host galaxies (see, e.g., Kochanek, Keeton, & McLeod 2001 and Saha & Williams 2001 for general discussions), lensed images of multi-component sources (e.g., Cohn et al. 2001; Muñoz, Kochanek & Keeton 2001), and the relative orientations of milliarcsecond-scale radio jets (e.g., Rusin et al. 2002; Winn, Rusin & Kochanek 2003).
The mass distributions in several lens galaxies have now been investigated using either direct modeling or stellar dynamics. In all but one case, the profile is consistent with an isothermal model (). The lone exception is PG1115+080, for which the high stellar velocity dispersion (Tonry 1998) suggests a mass profile steeper than isothermal (; Treu & Koopmans 2002b), although this also implies that the galaxy lies well off the FP. The lensing results are therefore generally consistent with the nearly isothermal profiles favored by X-ray and dynamical studies of local elliptical galaxies.
Understanding the mass profiles of lens galaxies is required for the determination of the Hubble constant () from measured time delays. Kochanek (2002) demonstrates that the predicted delay between two images, and hence the derived value of , is primarily governed by the average surface mass density in the annulus defined by their radial distances from the lens center, with a small correction for the slope of the profile in this annulus. Each of these quantities is determined by the shape of the radial mass profile. Based on a study of several lens systems which are dominated by a single galaxy and have well-measured time delays, Kochanek (2002) finds if lenses are isothermal. This value is lower than those obtained from the Hubble Space Telescope (HST) Key Project (; Freedman et al. 2001) and WMAP data (, although this requires the assumption of a flat cosmology and a dark energy equation of state of ; Spergel et al. 2003). In fact, Kochanek (2002, 2003) shows that early-type galaxies must be described by models in which mass traces light, and hence have no extended dark matter halos, to reconcile current time delay measurements with (see also Williams & Saha 2000). This apparent discrepancy with other observational constraints and the CDM paradigm demands continued examination of the lens galaxy population.
Decomposing the luminous and dark matter components of early-type galaxies is also potentially important for investigating the nature of flux ratio discrepancies in gravitational lens systems. It has now been extensively demonstrated that simple, smooth mass models have great difficulty reproducing the observed flux ratios in four-image lenses (e.g., Dalal & Kochanek 2002; Metcalf & Zhao 2002; Chiba 2002; Keeton, Gaudi & Petters 2002), both in the optical and radio. The effect has been traced to small-scale structure in the gravitational potential (Kochanek & Dalal 2003), and can be due to either stars (microlensing; e.g., Witt, Mao, & Schechter 1995; Schechter & Wambsganss 2002) or CDM satellite halos (millilensing; e.g., Mao & Schneider 1998; Metcalf & Madau 2001; Bradac et al. 2002; Chiba 2002; Dalal & Kochanek 2002). Both phenomena are surely present, as radio sources are generally too large to be affected by stars, while uncorrelated time variability is an unmistakable signature of stellar microlensing in some optical lenses (e.g., Wozniak et al. 2000). Microlensing is most efficient at accounting for observed anomalies, in particular the preferred demagnification of the saddle point image, when stars comprise a small fraction (15–30%) of the surface mass density at the image radius (Schechter & Wambsganss 2002). If we can constrain a two-component model of the galaxy mass distribution, then we can predict the stellar surface mass fraction at the radii typically spanned by lensed images. Thus, the predictions and requirements of the microlensing hypothesis may be tested.
Because mass distributions have been directly constrained in only a small number of gravitational lenses, it is worthwhile to consider statistical constraints on the lens galaxy population. Such attempts have thus far been very limited. Several analyses (e.g., Rusin & Ma 2001; Evans & Hunter 2002) have focused on the absence of central images in deep radio maps of gravitational lens systems, which has been invoked to rule out profiles that are much shallower than isothermal or have significant cores. Keeton (2003) suggests that such constraints have been over-interpreted, since the magnification of the missing image is strongly dependent on the properties of the mass profile very close to the galaxy center. In addition, because mass distributions steeper than isothermal do not produce central images, any constraints based on the absence of these images are one-sided. The number and sizes of lens systems have also been used to investigate galaxy mass profiles in the context of CDM models (Keeton 2001). It is shown that adiabatic compression (e.g., Blumenthal et al. 1986) yields nearly flat rotation curves for a range of initial halo concentrations and cooled baryon fractions (see also Kochanek & White 2001 and Kochanek 2003), but typical CDM halos (e.g., Bullock et al. 2001) appear to be too centrally concentrated to account for the data. The analysis, however, offers few quantitative results describing the mean mass profile and scatter, and therefore demands further study of two-component mass models.
In this paper we introduce a new technique to statistically constrain the mass profiles of early-type lens galaxies via aperture mass measurements. Each lens must obey a strict relationship between the image radii and the projected masses they enclose. The set of mass-radius relations can be used to investigate the typical mass profile in a sample of lenses if we assume that early-type galaxies have a self-similar (homologous) structure. This means that the functional form (shape) of the mass distribution is the same from galaxy to galaxy, and is scaled by the properties of the light distribution. An underlying homology between mass and light is suggested by the existence of a tight fundamental plane relating optical and dynamical observables. In one popular interpretation of the FP (e.g., Faber et al. 1987; van Albada et al. 1995), early-type galaxies are structurally homologous, but the mass-to-light ratio has a luminosity dependence. Gerhard et al. (2001) use dynamical data to bolster this hypothesis, demonstrating that more luminous early-type galaxies have higher stellar mass-to-light ratios in their central regions. Other analyses have cast doubt on the description of the FP in terms of strong homology and varying mass-to-light ratios (e.g., Caon, Capaccioli, & D’Onofrio 1993; Pahre et al. 1998; Bertin et al. 1994, 2002), and instead suggest a weak homology in which structural parameters vary systematically with luminosity. However, because a strong homology is the simplest reasonable assumption, it is a good starting point for the statistical investigation of mass profiles in early-type galaxies.
Section 2 details the aperture mass-radius constraints offered by lensing. Section 3 describes the lens sample and outlines our various assumptions. Section 4 introduces our self-similar models and the associated methodology. Section 5 presents our statistical constraints on the radial mass distribution in lenses. Section 6 demonstrates how these constraints can be used for the interpretation of measured time delays and flux ratio anomalies among lensed images. Section 7 discusses our findings in the context of recent astrophysical and cosmological results. Unless otherwise stated, we assume a flat cosmology with for all calculations.
2 Aperture Masses from Lens Geometries
The geometries of gravitational lens systems yield model-independent constraints on projected masses. Consider, for example, a deflector with a circularly symmetric surface density distribution, and a source which sits directly behind it. The image will form on a ring of (physical) Einstein radius , which is related to the aperture mass () it encloses by
| (1) |
where is the critical surface density. Angular diameter distances to the lens, to the source, and from the lens to the source are , and , respectively. For this simple case, the mass enclosed by the ring is determined by its radius alone, and is therefore independent of the shape of the mass profile.
Real lenses are more complicated. First, sources (and their images) are, in general, not symmetrically placed with respect to the mass distribution. This means that the geometry may be described by more than one characteristic radius. Second, gravitational potentials are, in general, not circularly symmetric. The presence of a quadrupole, due to either external shear or ellipticity, effectively stretches the image plane along one axis and compresses it along a perpendicular axis, thereby confusing the interpretation of geometry in terms of mass. These issues are surmountable, however, allowing any lens geometry to yield model-independent relations between masses and radii.
Four-image lenses (quads) offer the best mass constraints, as the above complications are minimized. The images typically reside at similar radii, and their good angular coverage allows for the robust determination and removal of the quadrupole. Just about any mass profile can reproduce the image positions and fluxes in a quad, but modeling demonstrates that there is a radius at which all models agree on the enclosed projected mass (e.g., Cohn et al. 2001; Muñoz et al. 2001). We have tested the generality of this claim using Monte Carlo simulations. First, we create fake four-image lenses from an elliptical mass distribution with some fixed radial profile residing in an external shear field of random orientation. We then model the image positions and fluxes using a broad range of mass profiles, tabulating the mass enclosed by a circular aperture as a function of radius for each best-fit model. We find that the suite of aperture mass curves cross at nearly the same radius (), the value of which can be accurately estimated (to ) from the critical radius of a model-fit singular isothermal sphere (SIS) in an external shear field. This is true regardless of whether the mass distribution is spherical or elliptical. The enclosed, projected mass inside is then given by eq. (1), to an accuracy of .
Two-image lenses (doubles) yield weaker mass constraints. If the potential is circularly symmetric, then the lens equation dictates a model-independent mass-radius relation:
| (2) |
where and are the radii of the images with respect to the galaxy center, and and are the projected masses they enclose. Hence, doubles constrain a combination of two radii and two masses. Note that in the limit of a ring (), we recover eq. (1). The presence of a quadrupole smears the mass-radius relation for doubles, and the limited number of constraints means that its effects cannot be removed in a model-independent manner. If the quadrupole is represented as an external shear, then the maximum fractional deviation from eq. (2) is equal to the shear magnitude , and this occurs when the shear axis is parallel or perpendicular to the axis defined by the lensed images. Averaging over orientations, the rms deviation is . We have confirmed this assertion using Monte Carlo simulations, in which fake doubles are produced from one mass profile and modeled using a range of mass profiles. While four-image lenses typically have quadrupoles which can be described by shear fields of amplitude (e.g., Keeton, Kochanek & Seljak 1997; Holder & Schechter 2003), we might expect doubles to have somewhat lower quadrupoles, on average, as they represent a greater fraction of the lensing cross section when the shear is small (e.g., Keeton et al. 1997; Rusin & Tegmark 2001; Finch et al. 2002). Consequently, deviations from eq. (2) should generally be . We therefore employ eq. (2) as a model-independent mass-radius relation for doubles, and set a tolerance for quadrupole effects.111We note in passing that when using steep radial profiles to fit fake lenses produced from shallower profiles, huge external shears or extremely flattened deflectors may be required. These solutions, however, can be rejected on the grounds of physical implausibility. First, the mass distributions of lens galaxies would have to be significantly more flattened than the light distributions, which typically have moderate axial ratios of ; (e.g., Keeton et al. 1997). Second, such large external shears would have to be directly traced to nearby, cluster-scale perturbers, which are not observed in the relatively low-density environments of lens galaxies (Keeton, Christlein & Zabludoff 2000).
3 Data
3.1 Lens Sample
We begin with the sample of 28 early-type gravitational lens galaxies and bulges analyzed by Rusin et al. (2003). Note that this includes Q2237+050 (Huchra et al. 1985), which is lensed entirely by the bulge of a spiral galaxy. Twenty-two of the systems have measured lens redshifts (), and 18 of these are in combination with a measured source redshift ().222Here we include a recent measurement of (Treu & Koopmans 2003) for MG1549+3047 (Lehár et al. 1993). Previously, for systems with no , the lens redshift had been estimated under the requirement that the galaxy fall on the fundamental plane (Kochanek et al. 2000). To make use of this technique, one must first estimate the stellar velocity dispersion, which necessitates an explicit assumption of a galaxy mass profile. Since this paper is concerned with constraining mass models, it is prudent to exclude the six lenses without spectroscopic lens redshifts. The number of lenses used in the following analysis is therefore 22. The systems are listed in Table 1.
3.2 Geometric Properties
The important geometric properties of each lens system are derived from the radii of the lensed images. Image positions with respect to the lens galaxy are determined from the HST data, based on the fitting methods outlined by Lehár et al. (2000).333 Because the two images of the radio lens B2319+051 (Rusin et al. 2001) have not been detected in the optical, a direct determination of their positions with respect to the galaxy is currently impossible. However, the structure in the lensed jets allows the galaxy position to be determined from mass modeling. Rusin et al. (2001) demonstrate this in the context of an isothermal mass profile, but our calculations show that the recovered galaxy position is nearly independent of the assumed model. We therefore include this system in our analysis, using the estimated and from that paper. The uncertainties on these positions are typically milliarcseconds, which is negligible compared to the radii of even the closest lensed images in doubles ( arcsec). For quads and rings, the angular Einstein radius is determined by fitting an SIS plus external shear model to the lens data, and then converted to the physical radius . The Einstein radius can typically be derived to 1% precision, so its uncertainty is also negligible. The geometric properties of the lens sample are listed in Table 1.
Interpreting radii in terms of masses requires the critical surface density , which depends on source and galaxy redshifts through the angular diameter distances. Recall that each lens galaxy in our sample has a measured redshift. If the source redshift has also been measured, then there is no uncertainty in , at least within the context of our standard cosmological assumptions. If the source redshift is not known, we derive the uncertainty in (actually ) with Monte Carlo techniques. Following Rusin et al. (2003), we draw 10000 values from a Gaussian distribution for the source redshift, keeping only trials with because virtually all known lensed sources lie within this range. We adopt the value of as the median, and the rms scatter around this value as the uncertainty in .
3.3 Photometric Properties
The important photometric properties of each galaxy are the intermediate axis effective radius and luminosity. These quantities are derived from HST data obtained with the WFPC2 and NICMOS cameras. The fitting methods are detailed by Lehár et al. (2000), Kochanek et al. (2000) and Rusin et al. (2003). The optical effective radius (; or in physical units) is determined by fitting a de Vaucouleurs profile to the galaxy in the filter with the highest signal-to-noise ratio. This quantity is then held fixed to determine the mean surface brightness within the effective radius () in all filters . The total magnitude is then . The photometric properties of our sample are tabulated in Rusin et al. (2003).
Complications arise from the need to convert the observed galaxy magnitudes to some standard luminosity scale that accounts for -corrections and luminosity evolution. As we shall see in §4, only the magnitude offset is required for our analysis, since we can parameterize the homology model in terms of the present-day () stellar mass-to-light ratio for an galaxy. Assuming that does not evolve (i.e., that the evolution rate is independent of luminosity; the same assumption was made in Rusin et al. 2003 and all other analyses using the FP to study galaxy evolution; e.g., van Dokkum et al. 1998, 2001; Treu et al. 2001, 2002), we can estimate this quantity from the observed magnitudes, without converting to rest frame bands. Specifically, we compare the observed magnitudes () to models () for the apparent magnitudes of an galaxy at the lens redshift, and then calculate the mean offset:
| (3) |
We compute the model magnitudes by convolving spectral energy distributions from the GISSEL96 version of the Bruzual & Charlot (1993) spectral evolution models with transmission curves for HST filters (available from the technical archives of STScI, with zero-points from Holtzman et al. 1995). All models are normalized to a fixed present-day characteristic magnitude of for early-type galaxies in the band (e.g., Madgwick et al. 2002). We take as a fiducial model an instantaneous starburst at with solar metallicity and a Salpeter (1955) initial mass function (IMF). The assumed metallicity is consistent with observations of early-type field galaxies at (Ferreras, Charlot & Silk 1999), and the assumed formation redshift is consistent with a number of analyses which strongly favor old stellar populations (mean star formation redshift ; e.g., Bernardi et al. 1998; Schade et al. 1999; Kochanek et al. 2000; van Dokkum et al. 2001; Im et al. 2002; van de Ven, van Dokkum & Franx 2002; Rusin et al. 2003). Considering a broad range of stellar models (, ) yields an rms scatter in of 0.1–0.2 mag for most lenses. This uncertainty is much larger than the measurement errors, since all of the 22 galaxies have excellent photometry. We therefore adopt a luminosity error of , or , for all lens galaxies.
Estimating requires some understanding of luminosity evolution, which is implicitly included in the spectral models. For example, when normalized to a fixed at , a faster evolution rate (lower ) would predict higher values of , and hence we would derive lower values of for each lens galaxy. If the true mean star formation redshift is , then our fiducial model of could greatly overestimate , especially for high redshift lenses (). However, most studies of early-type field galaxies are inconsistent with the rapid luminosity evolution implied by . We note in passing that if the evolution rate is explicitly fit by our mass models (§4), the scatter is minimized by , and increases for later formation redshifts. Unfortunately, the resulting constraints on the evolution rate are very poor, as a number of other parameters are being fit. Since this paper focuses on the structure of lens galaxies, we believe it is best to simply assume a reasonable mean star formation redshift of . We reiterate that our estimated uncertainties on are sufficient to account for the spread in evolution rates over the favored range of .
Finally, note that many of the quantities entering our analysis are correlated. For example, the total magnitude and the fraction of the light enclosed by the aperture radius both correlate with the effective radius . Neither effect is very significant, because is typically quite small (see Rusin et al. 2003), but for completeness we take these correlations into account via Monte Carlo calculations. We draw 10000 trials from a Gaussian distribution representing the effective radius (mean , width ), compute the derived quantities, and store them for later use. We use the 10000 sets of correlated parameters, plus the independent (uncorrelated) luminosity error of , to calculate the scatter in the quantities entering the fitting functions given below.
4 Self-similar Models for Galaxy Mass Distributions
The aperture mass-radius relation (eq. 1 or 2) for a single lens tells us nothing about the mass profile. However, recall that the image splitting scale depends on the redshifts of both the lens galaxy () and lensed source () through the angular diameter distances in . For example, consider a spherical galaxy with a power-law mass density , and a corresponding surface density . If a source sits directly behind this galaxy, it will be lensed into a ring of Einstein radius . We could therefore imagine placing a fixed mass distribution at various , where it will lens sources at various . The resulting set of Einstein radii and aperture masses would then allow us to trace out the radial mass profile of that galaxy.
Nature offers us an ensemble of gravitational lens systems with a wide range of lens () and source () redshifts, but the galaxy properties are far from uniform. The aperture mass-radius relations can, however, determine the typical (or “mean”) mass profile of the lens galaxy population if all galaxies can be placed on a common mass scale. This is most easily accomplished by postulating some self-similar (homology) model to relate the mass and light distributions of early-type galaxies. A given model allows projected masses to be predicted for each lens using the photometric parameters, which can then be compared to the mass-radius relations determined from the lensing geometries. The large range of image radii in our sample, spanning , gives us a long baseline for mapping the profile. We note, however, that the distribution is not uniformly populated, with most of the quads and rings probing the range . Doubles help fill in the radial coverage: the inner images typically span , while the outer images span .
We consider a physically-motivated two component (luminous plus dark matter) model for the mass distribution. Because of the limited sample of lenses on which to test the model, we keep the number of parameters to a minimum. The component which traces the luminous matter is modeled by two parameters: the mean present-day () stellar mass-to-light ratio (in the rest frame band) for an galaxy, and an exponent () describing its dependence on the galaxy luminosity : . Under the assumption of homology, the fundamental plane implies that (e.g., Jorgensen, Franx & Kjaergaard 1996). For each galaxy, the luminous surface mass density is represented by a de Vaucouleurs profile, and the associated mass enclosed by an aperture is
| (4) |
where is the projected fraction of the luminosity inside . Recall that for the de Vaucouleurs profile, , and . Note that our use of the intermediate axis effective radius, which is the geometric mean of the major and minor axes, allows us to accurately determine the fraction of the luminosity enclosed by a circular aperture, even when the surface brightness distribution is elliptical.
We model the dark matter as a power-law mass distribution. N-body simulations predict halos in which the mass density follows a shallow power-law slope at small radius, and turns over to a steeper slope beyond some break radius (e.g., Navarro, Frenk & White 1997, hereafter NFW; Moore et al. 1999b). However, because the lensed image radii probe only the inner several kiloparsecs of the mass distribution, we believe that a power-law approximation for the dark matter halo is reasonable on this scale. We describe this component by two parameters: the projected mass fraction () within , which is roughly the median scale of the Einstein radii of our lens sample, and the logarithmic slope of the mass density profile (, where ).444The parameter should be thought of as a “local” density slope. In reality, our fits use a surface density . This avoids the divergences encountered in converting between volume and surface densities for . For each galaxy, the dark matter enclosed by an aperture is
| (5) |
where . The total model-predicted mass inside is then
| (6) |
Note that the parameters and set the normalization of the mass profile, while the dark matter parameters and modulate its shape. The homology scheme effectively places all galaxies on a common mass scale by normalizing the aperture masses by , and the aperture radii by . If a strict homology holds, then all galaxy aperture masses and radii should reside on a curve in the space of versus .
Modeling, dynamical and statistical studies of gravitational lens galaxies often make use of a single-component mass distribution with a scale-free radial profile. While simplistic, this model allows one to explore much of the lensing phenomenology related to mass concentration, and provides a standard for comparing profile constraints from different lens systems. It is therefore worthwhile to consider the scale-free limit of our homology model. By taking and (such that ), we obtain a pure power-law mass distribution:
| (7) |
where is the projected mass inside for an galaxy.
We will constrain the parameters of the homology model by the set of mass-radius relations from the lens sample. The optimization is performed using the goodness-of-fit function
| (8) |
In quads and rings, the lensing geometry constrains the mass enclosed by the Einstein radius (eq. 1). These systems are evaluated using
| (9) |
where and are defined below. In doubles, the lensing geometry constrains a combination of two radii and projected masses (eq. 2). These systems are evaluated using
| (10) |
The logarithmic uncertainty on each data point is derived using the Monte Carlo methods outlined in §3, but is well approximated as , where is the additional 10% tolerance for quadrupole-related smearing of the mass-radius relation in doubles. We set for quads and rings, and for systems with a measured . Finally, we note that the above procedures have been tested using Monte Carlo simulations, and we find that the input mass profiles can be successfully recovered.
Following optimization, we uniformly rescale the estimated errors by setting so that the best-fit model has , the number of degrees of freedom. This does not alter the optimized parameters, but does allow us to relate the uncertainties to the observed scatter in the homology model. Moreover, it preserves the relative weighting among the data points, which naturally gives more weight to quads and rings, and those systems with a measured . Rescaling is particularly important because our model is undoubtedly a simplistic representation of galaxy mass distributions. Hence, the is likely to be dominated by unmodeled complexity (i.e., deviations from self-similarity) in the galaxy population, rather than by observational errors.
5 Analysis and Results
We first simultaneously constrain all four parameters (, , , ) in our homology model. The best-fit model has for (with ). The rms scatter ( in ) is significantly larger than can be accounted for by the assumed observational uncertainties. Given our estimates of the measurement errors, the intrinsic scatter is roughly 30% in mass. Fig. 1 shows the pairwise parameter constraints. The contours correspond to , , and . Unless otherwise noted, these and all subsequent values involve the rescaled , in which is set so that the best-fit model has .
There are well-defined regions allowed by the data, but substantial degeneracy between parameters. This is expected because the mass-radius relations constrain the combined (luminous plus dark matter) radial mass distribution. For example, we require a projected mass of inside for the typical lens galaxy. This can be achieved by placing more mass in the luminous component, which requires a larger , or more mass in the dark matter component, which requires a smaller . This degeneracy is reflected in the panel of Fig. 1. The mass-radius relations also prefer some overall shape, or concentration, for the combined profile. To achieve a given mass concentration, we can place more of the mass in the stellar component if the CDM slope is shallower, and less if the CDM slope is steeper. These degeneracies (, ) are also clearly seen in Fig. 1.
The slope , which describes the increase in stellar mass-to-light ratio with luminosity, is uncorrelated with the other three parameters (Fig. 1). Optimizing over the other parameters, we find at confidence (), and at confidence (). This is the first constraint on from strong lensing.
Our analysis robustly detects the presence of dark matter in the form of a mass component that is more spatially extended than the light. Dark matter contributes several tens of percent to the projected mass inside . This result can be quantified in a variety of ways, for different assumptions:
-
•
A model in which mass traces light () has with respect to the overall best fit, and is therefore rejected at confidence. It is too centrally concentrated to account for the ensemble of aperture mass-radius relations. We note in passing that such a model would require in the rest frame band, only slightly higher than the value of determined by Gerhard et al. (2001) from dynamical analyses of the central regions of local (nearly ) early-type galaxies.
-
•
Optimizing over the other three parameters, we find at 68% confidence, and at 95% confidence.
-
•
For a shallow CDM density slope of , as suggested by the NFW profile, the best-fit model has , and with respect to the best overall model. The allowed range is at confidence, and at confidence.
-
•
For a steeper CDM density slope of , as suggested by the Moore et al. (1999b) profile, the best-fit model has , and with respect to the best overall model. The allowed range is at confidence, and at confidence.
Because there are significant degeneracies between parameters, we cannot place a tight constraint on the slope of the dark matter component: at 68% confidence, with an upper bound of at 95% confidence. However, the favored models have dark and luminous components which sum to produce very similar mass profiles over the radial range probed by the lensed images. This is illustrated in Fig. 2, which shows the projected mass versus for all models with in the plane. We see that the mass profile closely tracks a pure isothermal () model.
In the scale-free limit ( and , see §4), we find at 68% confidence, consistent with isothermal or slightly steeper profiles. The 95% range is . The best-fit scale-free model has relative to the best overall model, so it provides a good approximation to the mass distributions in lens galaxies.
Fig. 3 demonstrates how the ensemble of mass-radius relations traces the radial mass profile. The solid line shows the scaled aperture mass as a function of the scaled aperture radius , predicted by the best-fit power-law model. Quad and ring systems are plotted at a single radius , with enclosed mass . Doubles are more difficult to depict, as they constrain a combination of two masses and radii. Note, however, that any mass profile can be normalized such that the mass-radius relation for a specific double is satisfied exactly. The resulting values of and in the context of the best-fit profile are plotted for each double in Fig. 3. While the locations of the points obviously depend on the assumed model, the best-fit profile will minimize their scatter about the model curve. In this way we see that doubles also help map the mass profile.
The radial coverage offered by the current lens sample is not uniform (Fig. 3). Quad and ring systems, which provide the strongest mass constraints, mostly lie in the range . There are two notable outliers: Q2237+030 (Huchra et al. 1985), which probes the smallest radial scale (), and MG2016+112 (Lawrence et al. 1984), which probes the largest radial scale (). Because these lenses constrain the extremes of the density profile, it is important to address how much they affect our fits. We find that dropping either of the systems does not alter the primary conclusions that the total mass profile is nearly isothermal, or that is favored. Some of the other constraints are slightly affected, and this can be understood based on the unique characteristics of each lens. First, MG2016+112 probes a scale much larger than the effective radius, and its aperture mass will be dominated by dark matter in most models. This system is therefore important for constraining the properties of the CDM component. Removing it weakens the exclusion of models in which mass traces light to about confidence, and significantly weakens the upper limit on in the limit . Profile constraints in the scale-free limit (), however, are not significantly changed. Second, Q2237+030 probes a scale much smaller than the effective radius, and its aperture mass will be dominated by luminous matter in most models. Consequently, this system contributes minimally to constraints on the CDM component. Dropping it has little effect on any of the model parameters, even those related to the stellar mass.
Finally, it is interesting to dissect the distribution of scatter about the best-fit homology model. Despite comprising only 7 of the 22 systems, doubles account for 56% of the . The additional scatter for doubles is greater than we would expect from the quadrupole smearing, and may indicate some unmodeled effect which we do not presently understand. Dropping all doubles would significantly improve the fit ( for , prior to rescaling) and tighten the resulting parameter constraints, but would not alter the major conclusions. For example, a model in which mass traces light would be rejected more strongly (), and constraints on the density slope in the scale-free limit would be (68% C.L.). We also note that a pair of lenses are particularly strong contributors to the scatter. The two-image system Q0142–100 (Surdej et al. 1987) is the farthest outlier, just as it is in our FP analysis (Rusin et al. 2003), and accounts for almost of the . Because the galaxy appears to be much brighter than expected, it greatly over-predicts aperture masses. The ring system MG1131+0456 (Hewitt et al. 1988) is the second largest contributor to the , accounting for of its value, despite being assigned a rather large fit tolerance due to its estimated source redshift. The lens galaxy can be brought into better agreement with the other galaxies if the lensed source is at a substantially higher redshift than the assumed median of . While our sample is too small to reasonably remove these two outliers, doing so would improve the fit ( for , prior to rescaling) but not affect the major conclusions. For example, a model in which mass traces light would be rejected somewhat more strongly (), and constraints on the density slope in the scale-free limit would be (68% C.L.).
6 Applications
6.1 Time Delays and the Hubble Constant
The time delays between gravitationally lensed images depend on a combination of the Hubble constant and the mass distribution of the lensing galaxy. The Hubble constant inferred from a measured time delay can be approximated as
| (11) |
where is the mean scaled surface mass density in the annulus defined by the radii of the lensed images, is the logarithmic slope of the density () within the annulus, and the constants and incorporate the lensing geometry, the redshifts, and the measured delay (Kochanek 2002). The term is the most important, and the term just contributes a small (10%) correction. Kochanek (2002, 2003) investigates “simple” time delay lenses which are dominated by a single galaxy with a precisely determined centroid relative to the images. Two limiting cases of the mass distribution are considered: models in which mass traces light yield , while isothermal models yield . A number of recent results from a broader (perhaps less well understood) sample of lenses fall within the range (Burud et al. 2002a, 2002b; Fassnacht et al. 2002; Treu & Koopmans 2002b; Winn et al. 2002) if isothermality is assumed. In fact, the only lens to yield for an isothermal model is B0218+357 (Biggs et al. 1999), but the result is currently dominated by systematics related to the poorly constrained galaxy position. One can therefore make the case that estimates of the Hubble constant from strong lensing are in broad agreement, but are systematically lower than the values favored by both the HST Key Project (Freedman et al. 2001) and the recent WMAP results (Spergel et al. 2003). Because Kochanek (2002, 2003) shows that nearly constant mass-to-light ratio models are necessary to reconcile time delay measurements with , this would seem to imply that lens galaxies have no extended dark matter component, in contradiction to virtually every other observational test.
We can now explore this intriguing problem in the context of our constraints on self-similar galaxy models. Of the five lenses considered by Kochanek (2002), three are drawn from our sample. The two exceptions are B1600+434 (Jackson et al. 1995), which has a late-type lens galaxy (Koopmans, de Bruyn & Jackson 1998) and is therefore not described by our models, and RXJ0911+0551 (Bade et al. 1997), which has a significant cluster perturbation complicating interpretation of the image radii. Because PG1115+080 (Weymann et al. 1980) has been explored in detail by Treu & Koopmans (2002b), we limit our demonstration to a pair of two-image lenses, SBS1520+530 (Chavushyan et al. 1997) and HE2149–2745 (Wisotzki et al. 1996).
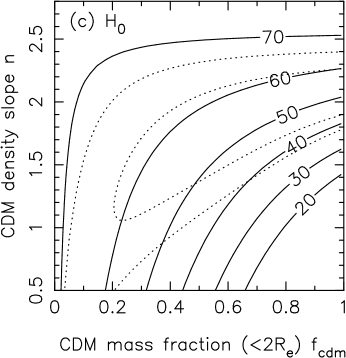
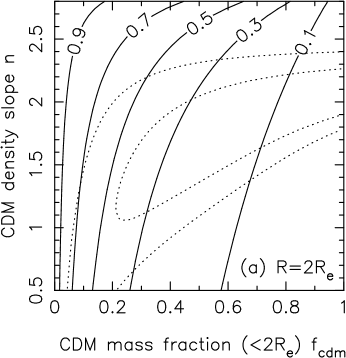
Because the favored homology models produce very similar mass profiles, , and the implied do not vary much along the degeneracy stripe. These three quantities are plotted for SBS1520+530 and HE2149–2745 in Figs. 4 and 5, respectively, by normalizing the models to reproduce the mass-radius relations exactly. The values of use the coefficients , and from Kochanek (2002). The uncertainties in these coefficients are propagated to using Monte Carlo procedures. Assuming that each model (,) has a likelihood , constraints on can be determined from a Bayesian analysis. These constraints are shown in panel (d) of Figs. 4 and 5. For SBS1520+530, (68% C.L.). For HE2149–2745, (68% C.L.). The values of come out slightly higher than those obtained by Kochanek (2002) for an isothermal profile, because our favored profiles are slightly steeper than . The Hubble constants are still lower than those favored by the HST Key Project (; Freedman et al. 2001) and WMAP data (; Spergel et al. 2003), but the discrepancy is only about in our analysis.
6.2 Flux Ratio Anomalies and Microlensing
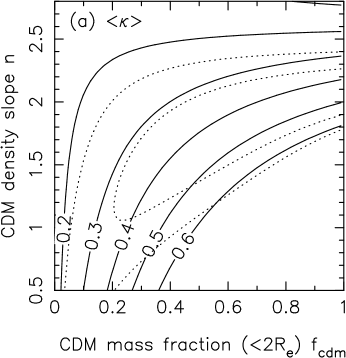
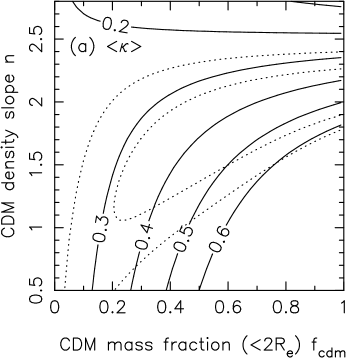
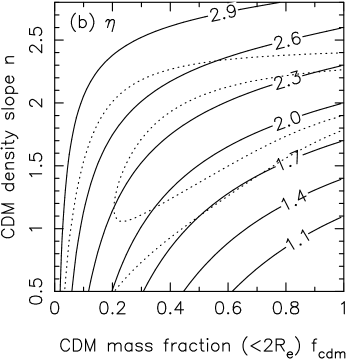
Simple, smooth models for the galaxy mass distribution have great difficulty reproducing the observed flux ratios in four-image lenses (e.g., Dalal & Kochanek 2002; Metcalf & Zhao 2002; Chiba 2002; Keeton et al. 2003). Moreover, flux ratio measurements in both the radio and optical appear to violate fundamental symmetry arguments which predict nearly equal magnifications for merging image pairs. Such flux ratio “anomalies” are almost certainly due to small-scale structure in the gravitational potential (Kochanek & Dalal 2003), which can significantly perturb magnifications (e.g., Mao & Schneider 1998) while leaving the image positions virtually unaltered. There is a debate regarding the identification of the perturbers. CDM simulations (Moore et al. 1999a) predict significant substructure (with mass scale ) in galaxy halos, and Dalal & Kochanek (2002) demonstrate that the substructure mass fraction required to account for radio flux ratio anomalies is in line with -body results. Stars are another source of substructure in the gravitational potential (Witt et al. 1995), and microlensing-induced time variability has been unambiguously detected in the light curves of Q2237+030 (Wozniak et al. 2000). Schechter & Wambsganss (2002) have pointed out that there is a tendency for saddle point images to be demagnified compared to our expectations for smooth lens models (see also Kochanek & Dalal 2003). They demonstrate that stellar microlensing produces this effect only if the stars account for a relatively small fraction () of the surface mass density at the image radius.555To ward off possible confusion of terminology, we note that while is a global parameter describing the projected dark matter mass fraction inside , is a local parameter describing the fraction of surface mass density in the form of stars at the radius of a lensed image. If is too high, then the asymmetric effects on saddles and local minima disappear; if is too low, then the anomalies are too rare. We can now test whether our two-component mass models fall within the favored range.
In the context of our homology model, the value of at a given radius depends only on the dark matter abundance parameter and density slope . Fig. 6a plots at , a typical radial distance for lensed images. Since we require models with an extended dark matter component, lower values of are favored at due to the fact that the surface brightness of the galaxy has already decreased substantially at this radius, while the dark matter density has not. Assuming that each model (,) has a likelihood , constraints on can be determined from a Bayesian analysis. These constraints are shown in Fig. 6b. At , just about any value of is permitted. At , however, the results are quite restrictive, favoring (68% C.L.). Hence, our models are consistent with the values of needed to produce the relative demagnification of saddle point images observed in flux ratio anomalies.
7 Discussion
We have constrained the typical mass profile of early-type lens galaxies using an ensemble of aperture mass-radius relations from 22 gravitational lenses. The different galaxies are combined using a self-similar mass model consisting of four parameters: the present-day () stellar mass-to-light ratio in the band for an galaxy (), its dependence on galaxy luminosity (, where ), the projected mass fraction of dark matter inside 2 effective radii (), and the logarithmic density slope of the CDM (, where ). Despite significant parameter degeneracies, the favored models have dark and luminous components which sum to produce very similar total mass profiles over the radial range probed by the lensed images. In the scale-free limit we find (68% C.L.), consistent with isothermal or slightly steeper profiles. Two-component models imply that the dark matter mass fraction is not very high: for an halo (NFW 1997), or for a steeper halo (Moore et al. 1999b), both at 68% confidence. Even so, the need for an extended dark matter component in the inner regions of the galaxies is significant, as a model in which mass traces light is ruled out at confidence. These are the best statistical constraints yet obtained on the typical radial mass profile in gravitational lens galaxies, and they add to evidence that the mass distribution is nearly isothermal on the scale of a few effective radii.
One might expect lenses to be a biased sample of early-type galaxies, because deflectors with more centrally-concentrated profiles have larger lensing cross sections per unit mass. Consequently, if the galaxy population exhibits a range of profiles, then lensing would tend to select galaxies with steeper mass distributions. Note, however, that profile constraints for the lens galaxy population are consistent with the nearly isothermal profiles favored by dynamical and X-ray studies of local ellipticals, which are not selected on the basis of mass concentration. This would appear to strengthen the argument that early-type galaxies do not exhibit much structural variety, and therefore, that gravitational lenses are typical members of this galaxy population. Of course, even if lenses were a biased galaxy sample, it would have no effect on applications such as Hubble constant determination, which only requires an understanding of the mass profiles in lens galaxies.
Our results have implications for the relationship between dark and luminous matter in early-type galaxies, and can be compared with recent studies involving the stellar dynamics of local galaxies (Gerhard et al. 2001) and lenses at intermediate redshift (KT), the number and size distribution of lenses (Keeton 2001), and the existence of a tight fundamental plane (Borriello, Salucci & Danese 2003). While the use of different mass models and priors makes a detailed comparison difficult, we can nonetheless survey the basic results for consistency.
First, consider evidence for the existence and abundance of dark matter within a few optical radii. Our results rule out a galaxy population in which mass traces light at confidence, and imply a small but significant dark matter mass fraction inside . KT likewise reject constant mass-to-light ratio models based on the measured velocity dispersions of lens galaxies. In comparison, Gerhard et al. (2001) claim 10–40% dark matter within the volume defined by , but caution that some elliptical galaxies show no evidence for dark matter at this scale. Coming from the other side, Keeton (2001) uses a variety of lensing statistics to place an upper limit of dark matter within the volume defined by . Borriello et al. (2003) also suggest that a cuspy dark matter halo can contribute little to the mass inside a few effective radii, if early-type galaxies are to occupy a tight fundamental plane. We can compare these measurements to the predictions of the CDM model. Assuming an NFW halo profile, a cooled baryon fraction of (from the local census of baryons by Fukugita, Hogan & Peebles 1998), and a typical initial halo concentration (; Bullock et al. 2001), the adiabatic compression models of Keeton (2001) predict –. The predicted value of can be reduced slightly by increasing the cooled baryon fraction, but even maximally efficient cooling (; Spergel et al. 2003) yields –. Because the above suite of measurements seem to imply lower dark matter mass fractions in the central regions of early-type galaxies, they may support the evidence from late-type galaxies (e.g., McGaugh & de Blok 1998; de Blok et al. 2001; Salucci 2001; de Blok & Bosma 2002) that halos are less concentrated than predicted by numerical simulations of CDM (e.g., Moore et al. 1999b; Bullock et al. 2001).
Next consider the dependence of mass-to-light ratio on luminosity. We find that (68% C.L.), the first such constraint from strong lensing. While this result strictly applies to the stellar mass-to-light ratio, the self-similarity of our model means that it also applies to the total mass-to-light ratio inside any fixed fraction of the effective radius. The luminosity dependence is slightly shallower than the slope of measured by Gerhard et al. (2001) in the band using stellar dynamics. Each of these results is broadly consistent with the value of obtained by interpreting the -band FP under the assumption of structural homology (e.g., Jorgensen et al. 1996). Similar investigations have recently been performed at longer wavelengths. Bernardi et al. (2003) measure in the band using virial mass-to-light ratios, and derive a similar value from their FP slopes. In addition, Borriello et al. (2003) show that scatter in the local -band FP is minimized by . Finally, it is interesting to note that the above estimates of , determined at the scale of the optical radius, are similar to the relations between virial mass and luminosity determined from weak lensing and satellite dynamics: Guzik & Seljak (2002) and Prada et al. (2003) find , while McKay et al. (2001, 2002) favor . The broad consistency of these scaling laws suggests that the mass distribution in early-type galaxies is closely related to the light over many orders of magnitude in radius.
We have applied our constraints on the mass distribution of early-type galaxies to a pair of interesting problems. First, we find that the measured time delays in SBS1520+530 and HE2149–2745 favor a Hubble constant of . This value is slightly higher than that derived by Kochanek (2002) using isothermal models, since we prefer mass profiles that are slightly steeper than . The derived is still systematically lower than recent results (Freedman et al. 2001; Spergel et al. 2003), although the discrepancy is only about in our analysis, as the statistical uncertainties in the mass profile are still significant. Second, we have estimated the fraction of the surface mass density in the form of stars () at the radii of lensed images. For images at , our models favor (68% C.L.). This is consistent with the values at which stellar microlensing can reproduce the observed flux ratio anomalies, in particular the tendency for saddle-point images to be more strongly perturbed than minima (Schechter & Wambsganss 2002).
Much more work is needed to fully understand the structure of early-type galaxies, and the implications for galaxy formation theories. Because of its unique advantages, gravitational lensing is certain to contribute significantly to this goal. Improved statistical tests to constrain the mass profiles of early-type galaxies require larger samples of lenses. Particularly important is the addition of new quad and ring systems which probe the mass distribution on small () and large () scales, and therefore fill in the tails of our radial coverage. As always, the key to turning recently discovered systems into useful astrophysical tools is the acquisition of high-quality HST photometry and ground-based spectroscopy. Expanded samples could allow us to replace our simplistic power-law model for the dark matter halo with more realistic profiles, and consider structural dependencies on luminosity or color. In this way we may be able to properly investigate sources of scatter in our homology model, and perhaps quantify or constrain the structural diversity of the early-type galaxy population. With regard to lensing determinations of the Hubble constant, it is vital to increase the number of lenses that have both direct profile constraints and well-determined time delays. Currently there is only one such system (PG1115+080; Schechter et al. 1997; Treu & Koopmans 2002b).666A number of profile constraints have been claimed for the time delay lens Q0957+561 (e.g., Grogin & Narayan 1996), but Keeton et al. (2000) demonstrates that existing models fail to properly reproduce lensed extended emission from the quasar host galaxy. Programs are now underway to both measure more time delays, and obtain profile constraints on current systems by measuring stellar velocity dispersions or mapping extended emission from the lensed host galaxies. Such observations should greatly illuminate current discrepancies related to time delays and the Hubble constant, and, more generally, improve our understanding of the mass distribution in early-type galaxies.
References
- (1)
- (2) Bade, N., Siebert, J., Lopez, S., Voges, W., & Reimers, D. 1997, A&A, 317L, 13
- (3)
- (4) Bernardi, M., Renzini, A., da Costa, L.N., Wegner, G., Alonso, M.V., Pellegrini, P.S., Rité, C., & Willmer, C.N.A. 1998, ApJL, 508, L143
- (5)
- (6) Bernardi, M., et al. 2003, AJ, 125, 1866
- (7)
- (8) Bertin, G., et al. 1994, A&A, 292, 381
- (9)
- (10) Bertin, G., Ciotti, L., & Del Principe, M. 2002, A&A, 386, 149
- (11)
- (12) Biggs, A.D., Browne, I.W.A., Helbig, P., Koopmans, L.V.E., Wilkinson, P.N., & Perley, R.A. 1999, MNRAS, 304, 349
- (13)
- (14) Blumenthal, G.R., Faber, S.M., Flores, R., & Primack, J.R. 1986, ApJ, 301, 27
- (15)
- (16) Borriello, A., Salucci, P., & Danese, L. 2003, MNRAS, 341, 1109
- (17)
- (18) Bradac, M., Schneider, P., Steinmetz, M., Lombardi, M., King, L.J., & Porcas, R. 2002, A&A, 338, 373
- (19)
- (20) Bruzual, A.G., & Charlot, S. 1993, ApJ, 405, 538
- (21)
- (22) Bullock, J.S., Kolatt, T.S., Sigad, Y., Somerville, R.S., Kravtsov, A.V., Klypin, A.A., Primack, J.R., & Dekel, A. 2001, MNRAS, 321, 559
- (23)
- (24) Burud, I., et al. 2002a, A&A, 383, 71
- (25)
- (26) Burud, I., et al. 2002b, A&A, 391, 481
- (27)
- (28) Caon, N., Capaccioli, M., & D’Onofrio, M. 1993, MNRAS, 265, 1013
- (29)
- (30) Chavushyan, V.H., Vlasyuk, V.V., Stepanian, J.A., & Erastova, L.K. 1997, A&A, 318L, 67
- (31)
- (32) Chiba, M., 2002, ApJ, 565, 17
- (33)
- (34) Ciotti, L., Lanzoni, B., & Renzini, A. 1996, MNRAS, 282, 1
- (35)
- (36) Cohn, J.D., Kochanek, C.S., McLeod, B.A., & Keeton, C.R. 2001, ApJ, 554, 1216
- (37)
- (38) Dalal, N., & Kochanek, C.S. 2002, ApJ, 572, 25
- (39)
- (40) de Blok, W.J.G, McGaugh, S.S., Bosma, A., & Rubin, V.C., 2001, ApJL, 552, L23
- (41)
- (42) de Blok, W.J.G., & Bosma, A. 2002, A&A, 385, 816
- (43)
- (44) Djorgovski, S., & Davis, M. 1987, ApJ, 313, 59
- (45)
- (46) Dressler, A., Lynden-Bell, D., Burstein, D., Davies, R.L., Faber, S.M., Terlevich, R., & Wegner, G. 1987, ApJ, 313, 42
- (47)
- (48) Evans, N.W., & Hunter, C. 2002, ApJ, 575, 68
- (49)
- (50) Fabbiano, G. 1989, ARA&A, 27, 87
- (51)
- (52) Faber, S.M., Dressler, A., Davies, R.L., Burstein, D., & Lynden-Bell, D. 1987, in: Nearly normal galaxies, ed. S.M. Faber (New York: Springer), 175
- (53)
- (54) Fassnacht, C.D., Xanthopoulos, E., Koopmans, L.V.E., & Rusin, D. 2002, ApJ, 581, 823
- (55)
- (56) Ferreras, I., Charlot, S., & Silk, J. 1999, ApJ, 521, 81
- (57)
- (58) Finch, T.K., Carlivati, L.P., Winn, J.N., & Schechter, P.L. 2002, ApJ, 577, 51
- (59)
- (60) Fischer, P., et al. 2000, AJ, 120, 1198
- (61)
- (62) Freedman, W.L., et al. 2001, ApJ, 553, 47
- (63)
- (64) Fukugita, M., Hogan, C.J., & Peebles, P.J.E. 1998, ApJ, 503, 518
- (65)
- (66) Gerhard, O., Kronawitter, A., Saglia, R.P., & Bender, R. 2001, AJ, 121, 1936
- (67)
- (68) Grogin, N.A., & Narayan, R. 1996, ApJ, 464, 92
- (69)
- (70) Guzik, J., & Seljak, U. 2002, MNRAS, 335, 311
- (71)
- (72) Hewitt, J.N., Turner, E.L., Schneider, D.P., Burke, B.F., & Langston, G.I. 1988, Nature, 333, 537
- (73)
- (74) Holder, G.P., & Schechter, P.L. 2003, ApJ, 589, 688
- (75)
- (76) Holtzman, J.A., Burrows, C.J., Casertano, S., Hester, J.J., Trauger, J.T., Watson, A.M., & Worthey, G. 1995, PASP, 107, 1065
- (77)
- (78) Huchra, J., Gorenstein, M., Kent, S., Shapiro, I., Smith, G., Horine, E., & Perley, R. 1985, AJ, 90, 691
- (79)
- (80) Im, M., et al. 2002, ApJ, 571, 136
- (81)
- (82) Jackson, N., et al. 1995, MNRAS, 274L, 25
- (83)
- (84) Jorgensen, I., Franx, M., & Kjaergaard, P. 1996, MNRAS, 280, 167
- (85)
- (86) Keeton, C.R., Kochanek, C.S., & Seljak, U. 1997, ApJ, 482, 604
- (87)
- (88) Keeton, C.R., et al. 2000, ApJ, 542, 74
- (89)
- (90) Keeton, C.R., Christlein, D., & Zabludoff, A.I. 2000, ApJ, 545, 129
- (91)
- (92) Keeton, C.R. 2001, ApJ, 561, 46
- (93)
- (94) Keeton, C.R., Gaudi, B.S., & Petters, A.O. 2002, ApJ, submitted (astro-ph/0210318)
- (95)
- (96) Keeton, C.R. 2003, ApJ, 582, 17
- (97)
- (98) Kleinheinrich, M., et al. 2003, astro-ph/0304208
- (99)
- (100) Kochanek, C.S. 1995, ApJ, 445, 559
- (101)
- (102) Kochanek, C.S., et al. 2000, ApJ, 543, 131
- (103)
- (104) Kochanek, C.S., Keeton, C.R., & McLeod, B.A. 2001, ApJ, 547, 50
- (105)
- (106) Kochanek, C.S., & White, M. 2001, ApJ, 559, 531
- (107)
- (108) Kochanek, C.S. 2002, ApJ, 578, 25
- (109)
- (110) Kochanek, C.S. 2003, ApJ, 583, 49
- (111)
- (112) Kochanek, C.S., & Dalal, N. 2003, ApJ, submitted (astro-ph/0302036)
- (113)
- (114) Koopmans, L.V.E., de Bruyn, A.G., & Jackson, N. 1998, MNRAS, 295, 534
- (115)
- (116) Koopmans, L.V.E., & Treu, T. 2002, ApJL, 568, L5
- (117)
- (118) Koopmans, L.V.E., & Treu, T. 2003, ApJ, 583, 606
- (119)
- (120) Lawrence, C.R., Schneider, D.P., Schmidet, M., Bennett, C.L., Hewitt, J.N., Burke, B.F., Turner, E.L., & Gunn, J.E. 1984, Sci., 223, 46
- (121)
- (122) Lehár, J., Langston, G.I., Silber, A., Lawrence, C.R., & Burke, B.F. 1993, AJ, 105, 847
- (123)
- (124) Lehár, J., et al. 2000, ApJ, 536, 584
- (125)
- (126) Loewenstein, M., & White, R.E. 1999, ApJ, 518, 50
- (127)
- (128) Madgwick, D.S., et al. 2002, MNRAS, 333, 133
- (129)
- (130) Mao, S., & Schneider, P. 1998, MNRAS, 295, 587
- (131)
- (132) Matsushita, K., Makishima, K., Ikebe, Y., Rokutanda, E., Yamasaki, N., & Ohashi, T. 1998, ApJL, 499, L13
- (133)
- (134) McGaugh, S.S., & de Blok W.J.G. 1998, ApJ, 499, 41
- (135)
- (136) McKay, T.A., et al. 2001, ApJ, submitted (astro-ph/0108013)
- (137)
- (138) McKay, T.A., et al. 2002, ApJL, 571, L85
- (139)
- (140) Metcalf, R.B., & Madau, P. 2001, ApJ, 563, 9
- (141)
- (142) Metcalf, R.B., & Zhao, H.S. 2002, ApJL, 567, L5
- (143)
- (144) Moore, B., Ghigna, S., Governato, F., Lake, G., Quinn, T., Stadel, J., & Tozzi, P. 1999a, ApJL, 524, L19
- (145)
- (146) Moore, B., Quinn, T., Governato, F., Stadel, J., & Lake, G. 1999b, MNRAS, 310, 1147
- (147)
- (148) Muñoz, J.A., Kochanek, C.S., & Keeton, C.R. 2001, ApJ, 558, 657
- (149)
- (150) Navarro, J.F., Frenk, C.S., & White, S.D.M. 1997, ApJ, 490, 493
- (151)
- (152) Pahre, M.A., de Carvalho, R.R., & Djorgovski, S.G. 1998, AJ, 116, 1606
- (153)
- (154) Prada, F., et al. 2003, ApJ, submitted (astro-ph/0301360)
- (155)
- (156) Renzini, A., & Ciotti, L. 1993, ApJL, 416, L49
- (157)
- (158) Rix, H.-W., de Zeeuw, P.T., Cretton, N., van der Marel, R.P., & Carollo, C.M. 1997, ApJ, 488, 702
- (159)
- (160) Romanowsky, A.J., & Kochanek, C.S. 2001, ApJ, 553, 722
- (161)
- (162) Rubin, V.C., Thonnard, N., & Ford, W.K., Jr. 1980, ApJ, 238, 471
- (163)
- (164) Rusin, D., & Ma, C.-P. 2001, ApJL, 549, L33
- (165)
- (166) Rusin, D., & Tegmark, M. 2001, ApJ, 553, 709
- (167)
- (168) Rusin, D., et al. 2001, AJ, 122, 591
- (169)
- (170) Rusin, D., Norbury, M., Biggs, A.D., Marlow, D.R., Jackson, N.J., Browne, I.W.A., Wilkinson, P.N., & Myers, S.T. 2002, MNRAS, 330, 205
- (171)
- (172) Rusin, D., et al. 2003, ApJ, 587, 143
- (173)
- (174) Saha, P., & Williams, L.L.R. 2001, AJ, 122, 585
- (175)
- (176) Salpeter, E. 1955, ApJ, 121, 161
- (177)
- (178) Salucci, P. 2001, MNRAS, 320L, 1
- (179)
- (180) Schade, D., et al. 1999, ApJ, 525, 31
- (181)
- (182) Schechter, P.L., et al. 1997, ApJL, 475, L85
- (183)
- (184) Schechter, P.L., & Wambsganss, J. 2002, ApJ, 580, 685
- (185)
- (186) Schneider, P., Ehlers, J., & Falco, E.E. 1992, Gravitational Lenses (Berlin: Springer-Verlag)
- (187)
- (188) Spergel, D.N., et al. 2003, ApJ, submitted (astro-ph/0302209)
- (189)
- (190) Surdej, J., Swings, J.-P., Magain, P., Courvoisier, T.J.-L., & Borgeest, U. 1987, Nature, 329, 695
- (191)
- (192) Tonry, J.L. 1998, AJ, 115, 1
- (193)
- (194) Treu, T., Stiavelli, M., Bertin, G., Casertano, S., & Moller, P. 2001, MNRAS, 326, 237
- (195)
- (196) Treu. T., Stiavelli, M., Casertano, S., Moller, P., & Bertin, G. 2002, ApJL, 564, L13
- (197)
- (198) Treu, T., & Koopmans, L.V.E. 2002a, ApJ, 575, 87
- (199)
- (200) Treu, T., & Koopmans, L.V.E. 2002b, MNRAS, 337L, 6
- (201)
- (202) Treu, T., & Koopmans, L.V.E. 2003, MNRAS, in press (astro-ph/0306045)
- (203)
- (204) van Albada, T.S., Bertin, G., & Stiavelli, M. 1995, MNRAS, 276, 125
- (205)
- (206) van de Ven, G., van Dokkum, P.G., & Franx, M. 2002, MNRAS, submitted (astro-ph/0211566)
- (207)
- (208) van Dokkum, P.G., Franx, M., Kelson, D.D., & Illingworth, G.D. 1998, ApJL, 504, L17
- (209)
- (210) van Dokkum, P.G., Franx, M., Kelson, D.D., & Illingworth, G.D. 2001, ApJL, 553, L39
- (211)
- (212) Weymann, R.J., et al. 1980, Nature, 285, 641
- (213)
- (214) Williams, L.L.R., & Saha, P. 2000, AJ, 119, 439
- (215)
- (216) Winn, J.N., Kochanek, C.S., McLeod, B.A., Falco, E.E., Impey, C.D., & Rix, H.-W. 2002, ApJ, 575, 103
- (217)
- (218) Winn, J.N., Rusin, D., & Kochanek, C.S. 2003, ApJ, 587, 80
- (219)
- (220) Wisotzki, L., Koehler, T., Lopez, S., & Reimers, D. 1996, A&A, 315L, 405
- (221)
- (222) Witt, H.J., Mao, S., & Schechter, P.L. 1995, ApJ, 443, 18
- (223)
- (224) Wozniak, P.R., Alard, C., Udalski, A., Szymanski, M., Kubiak, M., Pietrzynski, G., & Zebrun, K. 2000, ApJ, 529, 88
- (225)
- (226) Zaritsky, D., Smith, R., Frenk, C.S, & White, S.D.M. 1997, ApJ, 478, 39
- (227)
| Lens | Morph. | Radii (′′) | ||
|---|---|---|---|---|
| 0047–2808 | 0.49 | 3.60 | Quad | |
| Q0142–100 | 0.49 | 2.72 | Double | , |
| MG0414+0534 | 0.96 | 2.64 | Quad | |
| B0712+472 | 0.41 | 1.34 | Quad | |
| HS0818+1227 | 0.39 | 3.12 | Double | , |
| B1030+074 | 0.60 | 1.54 | Double | , |
| HE1104–1805 | 0.73 | 2.32 | Double | , |
| PG1115+080 | 0.31 | 1.72 | Quad | |
| MG1131+0456 | 0.84 | – | Ring | |
| HST14113+5211 | 0.46 | 2.81 | Quad | |
| HST14176+5226 | 0.81 | 3.40 | Quad | |
| B1422+231 | 0.34 | 3.62 | Quad | |
| SBS1520+530 | 0.72 | 1.86 | Double | , |
| MG1549+3047 | 0.11 | 1.17 | Ring | |
| B1608+656 | 0.63 | 1.39 | Quad | |
| MG1654+1346 | 0.25 | 1.74 | Ring | |
| B1938+666 | 0.88 | – | Ring | |
| MG2016+112 | 1.00 | 3.27 | Quad | |
| B2045+265 | 0.87 | – | Quad | |
| HE2149–2745 | 0.50 | 2.03 | Double | , |
| Q2237+030 | 0.04 | 1.69 | Quad | |
| B2319+051 | 0.62 | – | Double | , |
Note. — Listed for each lens are the galaxy () and source () redshifts, morphology, and relevant radii (Einstein radius for quads and rings; image radii and for doubles). Uncertainties on these radii are negligible. The image radii for B2319+051 are the estimated values from Rusin et al. (2001).
 |
 |
 |
 |
 |
 |
 |
 |
 |
 |
 |
 |
 |
 |
 |
 |
 |
 |