An AST/RO Survey of CO(4-3) in ultracompact HII regions
Abstract
The Antarctic Submillimeter Telescope and Remote Observatory (AST/RO) has been used to observe 78 of the IRAS point sources identified by Bronfman et al. (1996) as likely ultracompact HII regions. Results for the CO line at 461.041 are presented. The 74 sources detected are bright and in many cases compact, making them potentially suitable as pointing calibrators for single dish submillimeter telescopes.
1 Introduction
Most star formation (SF) occurs within the giant molecular cloud phase, and of particular interest is the behavior of the fragmented interiors of these clouds in the stages immediately before, during and after collapse into stellar objects. Both gaseous and dust components play vital roles in all SF models, and this paper presents submillimeter line observations of warm and dense gas near ultracompact HII regions, the ionized gas surrounding early-type stars. To identify the youngest stellar objects, far infrared (FIR) observations from the IRAS satellite’s near all-sky survey have been used (Wood & Churchwell, 1989) and follow-up line studies have successfully detected emission in many (sub)millimeter lines (e.g. Bronfman et al. 1996; Snell et al. 2000; Hatchell et al. 1998). Radio and IR continuum emission originates from ultracompact HII regions, while submillimeter line emission may come from hot molecular cores often found adjacent to one or more ultracompact HII regions. These objects are considered the best current tracer of ongoing SF.
An apparent problem with the understanding of ultracompact HII regions is that their dynamical ages appear to be so short ( yr) that their numbers overpredict the current rate of SF. However the expected lifetimes depend critically on the local distribution of gas and dust (cf. Hollenbach et al. (1994); de Pree et al. (1995)), of which little is known. Recent interferometric observations (Walsh et al., 1998; Koo et al., 1996; Kurtz et al., 1999) suggest that at least some of the so-called ultracompact HII regions may in fact have larger sizes and predicted ages. Thus a better understanding of the distribution and dynamics of molecular gas and dust around ultracompact HII regions is required. In this paper we present results of a survey of 78 hot cores with the Antarctic Submillimeter Telescope and Remote Observatory. This survey is toward southern (Dec. ° so as to be observable with AST/RO) sources in the list of Bronfman et al. (1996) with CS() emission and associated IRAS luminosity and colours typical of compact HII regions. The sources were further selected to have line profiles indicative of inward or outward motions (e.g., Mardones 1998) or have extended line wings which may indicate the presence of bipolar outflows. This database is likely to be representative of the early stages of massive SF. The results of this survey will be combined with observations of other submillimeter lines and continuum that will be analyzed in more detail in a subsequent paper but will also be of use to the several new southern submillimeter radiotelescopes as potential pointing and calibration sources. Published properties of bright, compact submillimeter sources in the southern sky are extremely sparse.
2 Observations
The observations were performed during the austral winter season of 2002 at the Antarctic Submillimeter Telescope and Remote Observatory (AST/RO; Stark et al., 2001), located at 2847 altitude in Amundsen-Scott South Pole Station. This site has very low water vapor, high atmospheric stability and a thin troposphere making it exceptionally good for submillimeter observations (Chamberlin et al., 1997; Lane, 1998). AST/RO is a 1.7 diameter, offset Gregorian telescope capable of observing at wavelengths between 200 and 1.3 (Stark et al., 1997). The receiver used was a dual-channel SIS waveguide receiver (Walker et al., 1992; Honingh et al., 1997) for simultaneous 461–492 and 807 observations, with double-sideband noise temperatures of 320–390 and 1050–1190, respectively. Telescope efficiency, , estimated using moon scans, skydips, and measurements of the beam edge taper, was 81% at 461–492 and 71% at 807. The 807 data will be presented, along with observations in several other bands, in a subsequent paper. Atmosphere-corrected system temperatures ranged from 700 to 4000 at 461–492.
A beam switching mode was used, with emission-free reference positions chosen at least from regions of interest, to make a small map of points surrounding each source. These maps were repeated as often as required to achieve suitable signal–to–noise. Emission from the CO and CO lines at 461.041 and 806.652, (together with the [] and [] lines at 492.262 and 809.342), was imaged over the 78 regions with a spacing of a half-beamwidth or less. The beam sizes (FWHM) were – at 461–492 and at 807 (Stark et al., 2001).
Two acousto-optical spectrometers (AOSs; Schieder et al., 1989) were used as backends. The AOSs had 1.07 resolution and 0.75 effective bandwidth, resulting in velocity resolution of 0.65 at 461 and 0.37 at 807. The data were smoothed to a uniform velocity resolution of 1. The high frequency observations were made with the CO line in the lower sideband (LSB). Since the intermediate frequency of the AST/RO system is 1.5, the [] line appears in the upper sideband (USB) and is superposed on the observed LSB spectrum. The local oscillator frequency was chosen so that the nominal line centers appear separated by 100 in the double-sideband spectra.
The standard chopper wheel calibration technique was employed, implemented at AST/RO by way of regular (every few minutes) observations of the sky and two blackbody loads of known temperature (Stark et al., 2001). Atmospheric transmission was monitored by regular skydips, and known, bright sources were observed every few hours to further check calibration and pointing. At periodic intervals and after tuning, the receivers were manually calibrated against a liquid-nitrogen-temperature load and the two blackbody loads at ambient temperature and about 100. The latter process also corrects for the dark current of the AOS optical CCDs. The intensity calibration errors became as large as % during poor weather periods.
Once taken, the data in this survey were reduced using the COMB data reduction package. After elimination of scans deemed faulty for various instrumental or weather-related reasons ( of the total dataset), linear baselines were removed from the spectra in all species by excluding regions where the CS spectra of Bronfman et al. (1996) showed emission within twice the FWHM of Gaussian fits to the CS line. This allowed known emission to be readily excluded from the baseline fitting procedure.
While the original intent was to make as uniform as possible across all source maps, this was not always possible. For the CO transition, in 1 wide channels with no spatial smoothing is on average .
3 Results
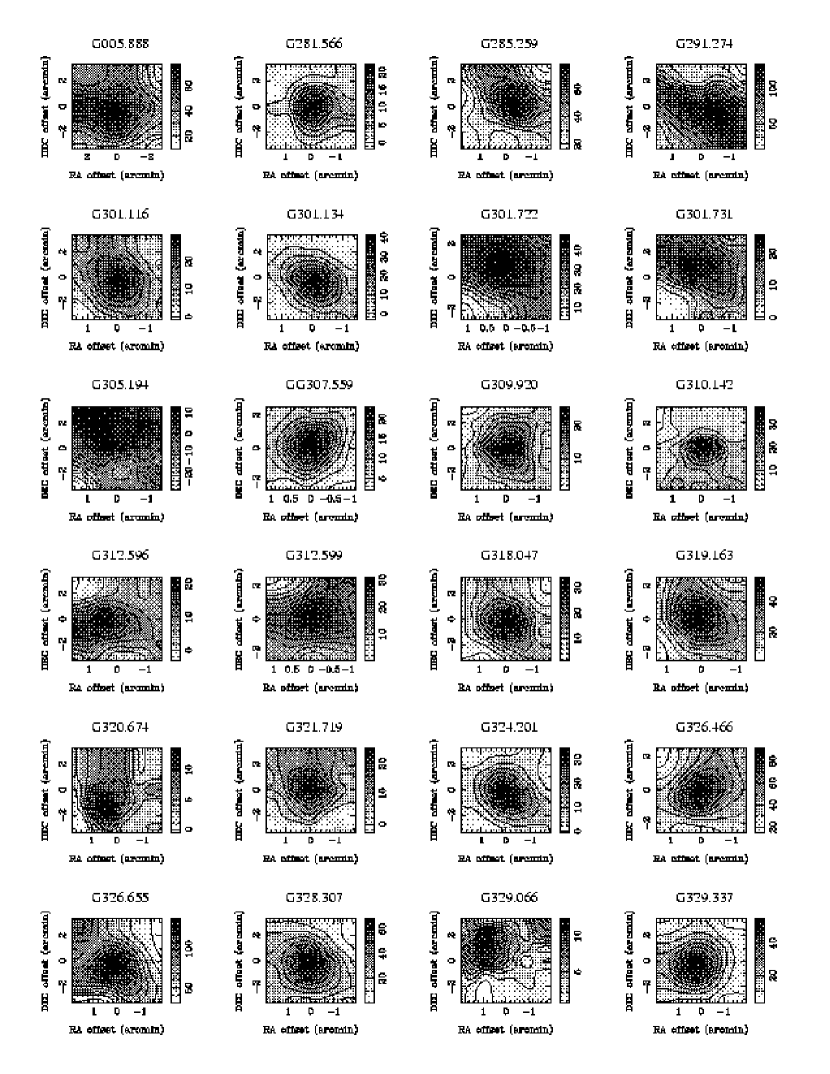
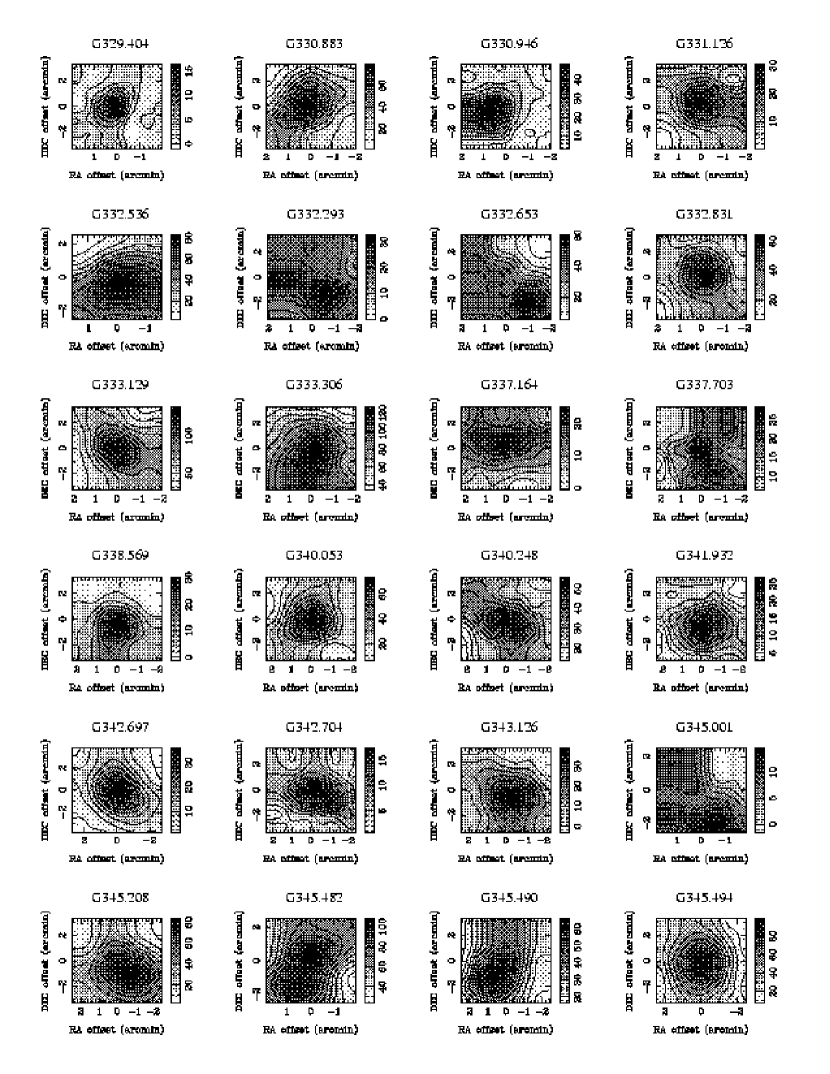
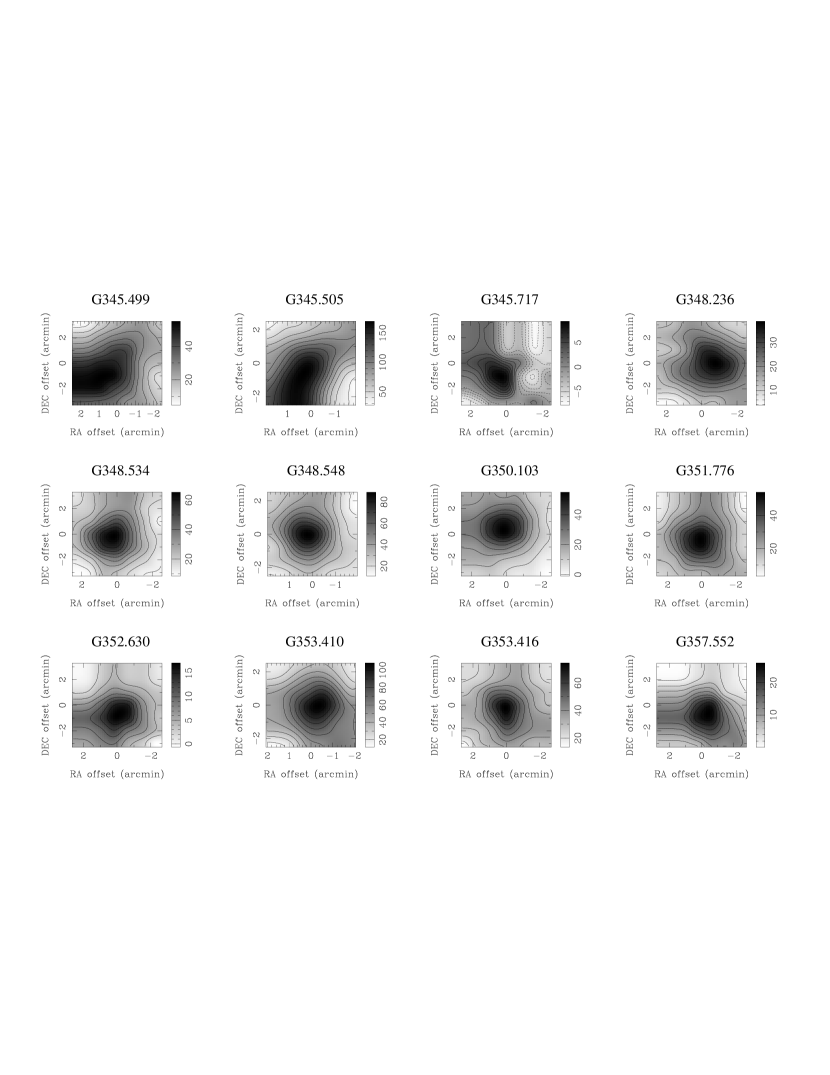
AST/RO’s pointing model (Stark et al., 2001) is currently determined by observing a small number of sources for a 24 hr period so as to obtain full coverage of the sky in azimuth. However these sources do not cover a wide range in elevation. As the residual pointing uncertainty after the application of the pointing model at AST/RO is between one beamwidth in the frequency used to determine the pointing model and one arcminute, it is a major aim of this work to identify a larger sample of compact sources, distributed over the sky, that may be used for pointing calibration. Therefore small images of a few square arcminutes were made of the sample with half-beam spacing. Fig. 1 displays the brightest spectrum observed in the vicinity of each source and Fig. 2 shows the resulting images.
Table 1 lists the results of Gaussian fits to the observed lines shown in Fig. 1. The first column is a shortened name based on the Galactic longitude, column two is the IRAS source name, columns three and four are the equinox J2000 coordinates. Column five is the peak antenna temperature as estimated by the Gaussian fit, with an uncertainty due to the fitting. The actual intensity calibration error of AST/RO is generally larger (§ 2). Columns six to eight are the central velocity, integrated line intensity (in K) and FWHM of the line as estimated by the Gaussian fitting, respectively. Fig. 1 shows that many of the line profiles can be approximately represented by a Gaussian form, leading to a reasonable estimate of the line strength, width and central velocity. The Gaussians, fit to a range of channels 10 either side of the FWHM of the Bronfman et al. (1996) Gaussian fit to the CS line, clearly do not provide a precise model of the profiles, and further analysis of the spectra should refer to the original data, available online.
Fig. 1 shows that the great majority, 95%, of the sources are detected in the CO line and 86% of them have line strengths brighter than 5 K. Thus the CO line is a readily-detectable tracer of molecular material around ultracompact HII regions, and may be used as a kinematic tracer and for distance determination. The profiles are in nearly all cases characterized by a single component, whose is in all but two cases the same as that of the CS line, within the fitting uncertainties. Those sources not detected at a level of several times the RMS noise per channel are indicated in the table as upper limits, the level of which is estimated to be 4.5 times the RMS per channel.
Images of a selection of the brightest sources detected in the CO line are shown in Fig. 2. The images were formed by simply summing the emission in channels within the FWHM of the Bronfman et al. (1996) Gaussian fit to the CS line. The images have been gridded onto a surface that over-samples the observed pointing centers by a factor of three using a Gaussian smoothing function with FWHM 30% larger than the beam, and weighted using cone interpolation with a similarly-sized interpolation radius. Bright molecular emission in the vicinity of ultracompact HII regions often originates from hot cores, which are expected to be relatively point-like compared with the AST/RO beam, except in those cases where an outflow is seen, where more than one molecular core is present, or if the dense molecular region is genuinely extended. Recent VLA results (Kurtz et al., 1999) show some ultracompact HII regions to lie within larger structures that may also contain extended molecular material. From Fig. 2 it can be seen that at least 50% of the sources in the present sample are unresolved by AST/RO and can potentially be used by single dish telescopes for pointing purposes.
The point-like images shown in fig. 2 can be used to select sub-samples for pointing purposes while extended structures may benefit from future mapping. These data will be combined with and analyzed in the light of measurements made in several other lines with a variety of opacities in a future paper.
| Name | IRAS name | R.A. (J2000) | Dec. (J2000) | T (K) | Vlsr | ||
|---|---|---|---|---|---|---|---|
| G268.522 | 9028-4837 | 08:59:29.82 | -48:13:17.31 | 2.8 0.6aaUpper limit: see text. | - | - | - |
| G269.854 | 9094-4803 | 09:11:08.40 | -48:15:59.16 | 2.9 0.5 | 78.8 0.1 | 4.1 | 1.3 |
| G281.586 | 10031-5632 | 10:04:56.23 | -56:46:36.85 | 7.3 0.1 | -1.2 0.1 | 45.2 | 5.8 |
| G285.259 | 10295-5746 | 10:31:28.36 | -58:02:07.47 | 23.3 0.1 | 4.8 0.0 | 129.9 | 5.2 |
| G291.274 | 11097-6102 | 11:11:52.66 | -61:18:35.38 | 25.3 0.2 | -20.9 0.0 | 260.7 | 9.7 |
| G297.725 | 11590-6452 | 12:03:22.80 | -64:09:57.25 | 3.1 0.8 | -9.2 0.1 | 2.3 | 0.7 |
| G301.116 | 12331-6134 | 12:36:02.05 | -61:51:05.41 | 9.6 0.2 | -39.0 0.1 | 81.6 | 8.0 |
| G301.134 | 12326-6245 | 12:35:33.87 | -63:02:29.05 | 13.0 0.2 | -37.6 0.1 | 87.0 | 6.3 |
| G301.722 | 12:41:17.43 | -61:44:10.45 | 10.9 0.2 | -38.6 0.0 | 52.6 | 4.5 | |
| G301.731 | 12383-6128 | 12:41:17.42 | -61:44:38.99 | 9.4 0.3 | -37.9 0.1 | 53.9 | 5.4 |
| G305.194 | 13:11:13.10 | -62:44:56.10 | 11.7 0.2 | -33.9 0.1 | 87.3 | 7.0 | |
| G307.559 | 13080-6229 | 13:32:30.47 | -63:04:48.90 | 6.7 0.2 | -34.8 0.1 | 28.2 | 3.9 |
| G307.560 | 13291-6249 | 13:32:30.69 | -63:05:17.36 | 7.3 0.3 | -33.4 0.1 | 32.9 | 4.2 |
| G309.920 | 13471-6120 | 13:50:41.53 | -61:35:10.53 | 8.8 0.3 | -55.6 0.1 | 31.2 | 3.3 |
| G310.142 | 13484-6100 | 13:51:57.63 | -61:15:45.78 | 7.9 0.3 | -54.9 0.1 | 78.0 | 9.2 |
| G312.599 | 14:13:13.88 | -61:16:18.26 | 6.7 0.2 | -62.6 0.1 | 47.0 | 6.6 | |
| G312.596 | 14095-6102 | 14:13:13.61 | -61:16:47.12 | 6.2 0.3 | -60.8 0.1 | 29.8 | 4.5 |
| G318.047 | 14498-5856 | 14:53:41.34 | -59:08:53.77 | 8.9 0.2 | -48.5 0.1 | 65.7 | 7.0 |
| G319.163 | 14593-5852 | 15:03:13.25 | -59:03:53.96 | 6.9 0.1 | -20.4 0.1 | 81.0 | 11.0 |
| G320.674 | 15068-5733 | 15:10:43.24 | -57:44:46.67 | 4.3 0.3 | -57.3 0.1 | 19.4 | 4.3 |
| G321.719 | 15100-5613 | 15:13:49.44 | -56:24:55.02 | 7.9 0.2 | -39.6 0.1 | 54.5 | 6.5 |
| G322.933 | 15165-5524 | 15:20:21.12 | -55:35:04.41 | 6.1 0.6 | -38.9 0.1 | 6.6 | 1.0 |
| G324.201 | 15290-5546 | 15:32:53.62 | -55:56:12.40 | 8.9 0.2 | -85.7 0.1 | 77.7 | 8.2 |
| G326.466 | 15:43:17.74 | -54:07:00.09 | 8.6 0.1 | -40.4 0.1 | 108.6 | 11.8 | |
| G326.474 | 15394-5358 | 15:43:17.83 | -54:07:32.62 | 7.5 0.2 | -38.9 0.0 | 22.9 | 2.9 |
| G326.655 | 15408-5356 | 15:44:42.79 | -54:05:56.00 | 21.4 0.2 | -38.1 0.0 | 224.8 | 9.9 |
| G328.306 | 15:54:06.03 | -53:11:07.59 | 2.0 0.6 | -8.9 0.1 | 1.7 | 0.8 | |
| G328.307 | 15502-5302 | 15:54:06.01 | -53:11:36.51 | 12.9 0.2 | -91.2 0.1 | 116.2 | 8.5 |
| G328.809 | 15520-5234 | 15:55:48.49 | -52:42:40.20 | 3.4 0.6 | -101.3 0.1 | 3.7 | 1.0 |
| G329.337 | 15567-5236 | 16:00:32.89 | -52:44:47.59 | 13.7 0.0 | -105.7 0.0 | 94.8 | 6.5 |
| G329.066 | 15573-5307 | 16:01:09.72 | -53:16:01.76 | 4.9 0.3 | -47.3 0.1 | 14.6 | 2.8 |
| G329.404 | 15596-5301 | 16:03:31.25 | -53:09:26.83 | 6.2 0.3 | -73.7 0.1 | 36.0 | 5.5 |
| G335.582 | 16272-4837 | 16:30:56.40 | -48:43:46.39 | 3.7 0.5 | -66.4 0.1 | 7.2 | 1.8 |
| G330.883 | 16065-5158 | 16:10:21.83 | -52:06:01.98 | 17.2 0.2 | -61.5 0.0 | 132.0 | 7.2 |
| G330.946 | 16060-5146 | 16:09:48.30 | -51:54:52.36 | 8.7 0.2 | -88.3 0.1 | 74.0 | 8.0 |
| G331.126 | 16071-5142 | 16:10:56.83 | -51:50:24.06 | 6.3 0.2 | -86.1 0.1 | 42.5 | 6.4 |
| G332.153 | 16:16:39.32 | -51:16:28.40 | 10.6 0.2 | -54.9 0.1 | 99.9 | 8.8 | |
| G332.293 | 16119-5048 | 16:15:45.15 | -50:56:02.83 | 9.9 0.3 | -47.7 0.0 | 31.5 | 3.0 |
| G332.653 | 16158-5055 | 16:19:40.73 | -51:03:10.97 | 11.3 0.2 | -47.4 0.1 | 103.9 | 8.6 |
| G332.831 | 16164-5046 | 16:20:14.28 | -50:53:19.87 | 8.8 0.2 | -55.3 0.1 | 117.7 | 12.6 |
| G333.129 | 16172-5028 | 16:21:00.60 | -50:35:19.84 | 22.4 0.2 | -50.5 0.0 | 224.7 | 9.4 |
| G333.306 | 16177-5018 | 16:21:30.61 | -50:25:04.40 | 21.6 0.2 | -49.0 0.0 | 225.1 | 9.8 |
| G337.164 | 16351-4722 | 16:36:20.15 | -47:24:29.43 | 4.5 0.2 | -65.0 0.2 | 55.1 | 11.6 |
| G337.703 | 16348-4654 | 16:38:33.29 | -47:01:20.00 | 4.9 0.3 | -52.7 0.2 | 34.8 | 6.7 |
| G338.569 | 16385-4619 | 16:42:14.29 | -46:25:28.13 | 10.2 0.3 | -114.6 0.1 | 54.0 | 5.0 |
| G339.622 | 16424-4531 | 16:46:06.65 | -45:36:49.42 | 5.7 0.2 | -32.6 0.1 | 40.2 | 6.6 |
| G340.053 | 16445-4516 | 16:48:11.89 | -45:21:32.25 | 9.1 0.2 | -51.0 0.1 | 77.2 | 8.0 |
| G340.248 | 16458-4512 | 16:49:30.26 | -45:17:49.66 | 8.3 0.2 | -49.5 0.1 | 71.0 | 8.0 |
| G341.932 | 16510-4347 | 16:54:37.12 | -43:51:55.92 | 7.0 0.3 | -42.0 0.1 | 33.4 | 4.5 |
| G342.697 | 16:56:04.02 | -43:04:13.54 | 6.1 0.4 | -40.9 0.1 | 25.8 | 3.9 | |
| G342.704 | 16524-4300 | 16:56:01.29 | -43:04:43.95 | 5.5 0.9 | -41.2 0.1 | 4.3 | 0.7 |
| G343.126 | 16547-4247 | 16:58:16.90 | -42:51:37.00 | 8.4 0.5 | -28.4 0.1 | 25.4 | 2.9 |
| G345.001 | 17016-4124 | 17:05:09.79 | -41:28:34.07 | 6.5 0.8 | -85.7 0.1 | 9.5 | 1.4 |
| G345.208 | 16571-4029 | 17:00:35.41 | -40:33:31.17 | 23.2 0.3 | -13.9 0.0 | 133.9 | 5.4 |
| G345.482 | 17:04:26.83 | -40:45:57.05 | 21.4 0.4 | -17.2 0.1 | 155.5 | 6.8 | |
| G345.490 | 17009-4042 | 17:04:29.50 | -40:46:25.47 | 13.2 0.3 | -16.3 0.1 | 117.2 | 8.4 |
| G345.494 | 16562-3959 | 16:59:41.88 | -40:03:44.10 | 19.3 0.2 | -10.8 0.1 | 192.6 | 9.4 |
| G345.499 | 17008-4040 | 17:04:20.41 | -40:44:25.77 | 13.1 0.3 | -16.4 0.1 | 71.1 | 5.1 |
| G345.505 | 17008-4040 | 17:04:23.06 | -40:43:56.31 | 21.9 0.4 | -17.1 0.1 | 172.8 | 7.4 |
| G345.717 | 16596-4012 | 17:03:06.30 | -40:17:08.73 | 7.1 0.6 | -9.0 0.1 | 13.6 | 1.8 |
| G348.236 | 17149-3916 | 17:18:23.91 | -39:19:10.19 | 16.6 0.3 | -10.8 0.1 | 109.7 | 6.2 |
| G348.534 | 17158-3901 | 17:19:16.17 | -39:04:26.09 | 10.3 0.2 | -11.2 0.1 | 117.0 | 10.7 |
| G348.548 | 17:19:16.05 | -39:03:55.67 | 22.9 0.5 | -11.0 0.1 | 208.2 | 8.5 | |
| G350.103 | 17160-3707 | 17:19:26.32 | -37:10:54.75 | 9.1 0.2 | -68.0 0.1 | 124.2 | 12.8 |
| G350.504 | 17136-3617 | 17:17:02.20 | -36:21:08.60 | 3.1 0.6 | 15.7 0.2 | 5.7 | 1.7 |
| G351.776 | 17233-3606 | 17:26:44.44 | -36:09:26.63 | 9.1 0.2 | -1.4 0.1 | 112.9 | 11.6 |
| G352.630 | 17278-3541 | 17:31:13.88 | -35:44:09.07 | 4.9 0.2 | -0.4 0.2 | 62.9 | 11.9 |
| G353.410 | 17:30:26.47 | -34:41:09.16 | 26.5 0.6 | -15.0 0.1 | 313.6 | 11.1 | |
| G353.416 | 17271-3439 | 17:30:28.87 | -34:41:40.53 | 11.8 0.3 | -14.6 0.1 | 153.8 | 12.3 |
| G357.552 | 17385-3116 | 17:41:49.73 | -31:18:22.66 | 14.1 0.4 | 3.4 0.1 | 54.0 | 3.6 |
| G000.665 | 17441-2822 | 17:47:19.66 | -28:23:08.21 | 4.5 1.0aaUpper limit: see text. | - | - | |
| G005.633 | 17545-2357 | 17:57:33.60 | -23:58:15.12 | 4.8 0.9aaUpper limit: see text. | - | - | - |
| G005.888 | 17574-2403 | 18:00:32.09 | -24:04:02.75 | 18.5 0.4 | 10.0 0.1 | 123.9 | 6.3 |
| G008.139 | 17599-2148 | 18:03:00.39 | -21:48:04.92 | 7.8 0.4 | 21.3 0.2 | 44.6 | 5.4 |
| G009.615 | 18032-2032 | 18:06:13.42 | -20:31:47.22 | 9.3 0.4 | 7.0 0.1 | 58.8 | 6.0 |
| G010.157 | 18064-2020 | 18:09:24.44 | -20:19:27.99 | 7.4 0.3 | 9.8 0.3 | 107.6 | 13.7 |
| G010.466 | 18056-1952 | 18:08:36.63 | -19:52:03.35 | 6.9 0.4 | 72.3 0.3 | 62.6 | 8.5 |
| G011.936 | 18110-1854 | 18:14:00.34 | -18:53:22.22 | 5.0 1.8aaUpper limit: see text. | - | - | - |
References
- Bronfman et al. (1996) Bronfman, L., Nyman, L.-A., & May, J. 1996, A&AS, 115, 81
- Chamberlin et al. (1997) Chamberlin, R. A., Lane, A. P., & Stark, A. A. 1997, ApJ, 476, 428
- de Pree et al. (1995) de Pree, C. G., Rodriguez, L. F., & Goss, W. M. 1995, Revista Mexicana de Astronomia y Astrofisica, 31, 39
- Hatchell et al. (1998) Hatchell, J., Thompson, M. A., Millar, T. J., & MacDonald, G. H. 1998, A&AS, 133, 29
- Hollenbach et al. (1994) Hollenbach, D., Johnstone, D., Lizano, S., & Shu, F. 1994, ApJ, 428, 654
- Honingh et al. (1997) Honingh, C. E., Haas, S., Hottgenroth, D., Jacobs, K., & Stutzki, J. 1997, in Eighth International Symposium on Space Terahertz Technology, 92
- Koo et al. (1996) Koo, B., Kim, K., Lee, H., Yun, M., & Ho, P. T. P. 1996, ApJ, 456, 662
- Kurtz et al. (1999) Kurtz, S. E., Watson, A. M., Hofner, P., & Otte, B. 1999, ApJ, 514, 232
- Lane (1998) Lane, A. P. 1998, in Astrophysics From Antarctica, ed. G. Novack & R. H. Landsberg, Vol. 141 (ASP Conference Series), 289
- Mardones (1998) Mardones, D. 1998, Ph.D. Thesis
- Schieder et al. (1989) Schieder, R., Tolls, V., & Winnewisser, G. 1989, Experimental Astronomy, 1, 101
- Snell et al. (2000) Snell, R. L., Howe, J. E., Ashby, M. L. N., Bergin, E. A., Chin, G., Erickson, N. R., Goldsmith, P. F., Harwit, M., Kleiner, S. C., Koch, D. G., Neufeld, D. A., Patten, B. M., Plume, R., Schieder, R., Stauffer, J. R., Tolls, V., Wang, Z., Winnewisser, G., Zhang, Y. F., & Melnick, G. J. 2000, ApJ, 539, L101
- Stark et al. (2001) Stark, A. A., Bally, J., Balm, S. P., Bania, T. M., Bolatto, A. D., Chamberlin, R. A., Engargiola, G., Huang, M., Ingalls, J. G., Jacobs, K., Jackson, J. M., Kooi, J. W., Lane, A. P., Lo, K.-Y., Marks, R. D., Martin, C. L., Mumma, D., Ojha, R., Schieder, R., Staguhn, J., Stutzki, J., Walker, C. K., Wilson, R. W., Wright, G. A., Zhang, X., Zimmermann, P., & Zimmermann, R. 2001, PASP, 113, 567
- Stark et al. (1997) Stark, A. A., Chamberlin, R. A., Cheng, J., Ingalls, J., & Wright, G. 1997, Rev. Sci. Instr., 68, 2200
- Walker et al. (1992) Walker, C. K., Kooi, J. W., Chan, M., Leduc, H. G., Schaffer, P. L., Carlstrom, J. E., & Phillips, T. G. 1992, Int. J. Infrared Millimeter Waves, 13, 785
- Walsh et al. (1998) Walsh, A. J., Burton, M. G., Hyland, A. R., & Robinson, G. 1998, MNRAS, 301, 640
- Wood & Churchwell (1989) Wood, D. O. S. & Churchwell, E. 1989, ApJS, 69, 831