The near-synchronous polar V1432 Aql (RX J1940.1–1025): Accretion geometry and synchronization time scale
The magnetic Cataclysmic Variable (mCV) V1432 Aql (RX J1940.1–1025) belongs to the four-member subclass of near-synchronous polars with a slight non-synchronism () between the spin period of the white dwarf and the binary period. In these systems the accretion geometry changes periodically with phase of the beat cycle. We present the application of a dipole accretion model for near-synchronous systems developed by Geckeler & Staubert (1997a) to extended optical and X-ray data. We detect a significant secular change of the white dwarf spin period in V1432 Aql of s/s from the optical data set alone. This corresponds to a synchronization time scale yr, comparable to the time scale of 170 yr for V1500 Cyg. The synchronization time scale in V1432 Aql is in excellent agreement with the theoretical prediction from the dominating magnetic torque in near-synchronous systems. We also present period analyses of optical CCD photometry and RXTE X-ray data, which argue against the existence of a 4000 s period and an interpretation of V1432 Aql as an intermediate polar. The dipole accretion model also allows to constrain the relevant parameters of the accretion geometry in this system: the optical data allow an estimate of the dimensionless parameter , with a lower limit for the threading radius of (68% confidence).
Key Words.:
cataclysmic variables – binaries: eclipsing – stars: individual: V1432 Aql; RX J1940.1–1025 – stars: magnetic fields – X-rays: stars1 Introduction
Polars are magnetic Cataclysmic Variables consisting of a Roche lobe-filling secondary and a white dwarf primary with a magnetic moment G cm3, exceeding those of neutron stars in low mass X-ray binaries (LMXB) with G cm3 and in high mass X-ray binaries (HMXB) with G cm3 (Cropper, 1998). The field strengths of most white dwarfs in polars are in the range of 7–70 MG (Beuermann & Burwitz, 1995). However, a few high field polars breaking the 70 MG barrier have been found, e.g., AR UMa with a reported field strength of 230 MG (Schmidt et al., 1996).
The strong magnetic field of the white dwarf in polars prevents the formation of an accretion disk and funnels the accreting matter transferred from the secondary directly onto the white dwarf photosphere near one or both of the magnetic poles. In addition, also because of the strong magnetic field, the white dwarf spin period and the orbital period are synchronized in most polars (Lamb et al., 1983, Wu & Wickramasinghe, 1993).
The post shock region of the accretion funnel emits hard X-ray bremsstrahlung radiation from a plasma heated to a few K (Lamb & Masters, 1979). A soft X-ray/EUV blackbody component with of a few K results from the reprocessing of hard X-rays and the thermalising of the kinetic energy of dense accretion blobs in the white dwarf photosphere (Kuijpers & Pringle, 1982, Frank et al., 1988, Hameury et al., 1989). Optical and near infrared spectra show cyclotron emission components also originating from the post shock flow (Chanmugam & Langer, 1991, Wickramasinghe & Meggitt, 1985). They provide an important diagnostic tool for probing the physical parameters in the accretion region and determining the accretion geometry (Schwope, 1990, 1995, and Schwope et al., 1995).
In this paper we will focus on a special subclass of polars with a slight non-synchronous rotation of the white dwarf with respect to the binary period. In these systems the orientation of the magnetic field of the white dwarf relative to the secondary changes continously with phase of the beat cycle. The varying accretion geometries in those systems and the detection of secular changes in the white dwarf spin periods (for three of the four known near-synchronous polars) offer unique insights into the accretion geometry and torques at work in polars. We will present a detailed model for the accretion geometry in near-synchronous systems and an application to our extended optical and X-ray data set on V1432 Aql.
2 V1432 Aql and the Near-Synchronous Polars
There exists a small subclass of four polars, consisting of V1432 Aql, V1500 Cyg, BY Cam (all with orbital periods near 3.4 h), and RX J2115.7–5840 ( h, the first system below the 2–3 hr period gap, Schwope et al., 1997, Ramsay et al., 1999), with a slight () but significant non-synchronous rotation of the white dwarf, see Table 1. Although the white dwarf is presumably temporarily out of synchronization, these objects clearly do belong to the group of ‘classical’ polars and not to the intermediate polars, where the spin period of the white dwarf is substantially shorter than the orbital period of the binary system (Patterson, 1994).
| Object | [yr] | Ref.b | |
| V1500 Cyg | –1.8% | (1) | |
| ′′ | ′′ | 290150 | (2) |
| ′′ | ′′ | 1708 | (3) |
| BY Cam | –1.0% | 1600500 | (4), (5) |
| RX J2115–58c | % | – | (6) |
| ′′ | –1.2% | – | (7) |
| V1432 Aql | % | (8) | |
| ′′ | 0.28% | see Table 6 |
a:
b: References:
(1) Schmidt & Stockman (1991);
(2) Pavlenko & Pelt (1991);
(3) Schmidt et al. (1995);
(4) Silber et al. (1997);
(5) Mason & Chanmugam (1992);
(6) Schwope et al. (1997);
(7) Ramsay et al. (1999);
(8) Geckeler & Staubert (1997a).
c: First system below the period gap
Through observations with Rosat, RX J1940.1–1025 has been identified as the source of the periodically modulated X-ray flux which had earlier been associated with the Active Galaxy NGC 6814, positioned 37′ from the polar (Madejski et al., 1993, Staubert et al., 1994). Rosen et al. (1993) identified the optical counterpart of the new X-ray source RX J1940.1–1025, later named V1432 Aql. Strong emission lines in the optical spectrum combined with the high X-ray flux suggested the classification of the object as a magnetic CV. Patterson et al. (1993) detected a variability in the optical flux of the source with a period of s.
Spectroscopic studies by Staubert et al. (1993) revealed a periodic variation of the radial velocity of the H emission line with a period of s. The authors suggested that V1432 Aql may be a non-synchronous polar, which has subsequently been verified by extended optical and X-ray observations (Staubert et al., 1994, Friedrich et al., 1996a, Patterson et al., 1995, Watson et al., 1995, Geckeler & Staubert, 1997a). Of the four known near-synchronous polars, V1432 Aql has the smallest separation (0.28%) between the orbital period and the spin period and, contrary to the three others, the orbital period in V1432 Aql is the shorter one, which poses an interesting theoretical problem that is not yet understood (J. Frank, priv. comm.).
In the near-synchronous polars the orientation of the magnetic field of the white dwarf primary relative to the secondary changes continously with phase of the beat cycle, with the beat period defined as . The accreting matter delivered by the secondary thus follows different field lines due to the changing magnetic geometry and impacts on the white dwarf surface at different positions relative to the magnetic pole, depending on the phase of the beat cycle. Geckeler & Staubert (1997a) have provided first results on the detection of this effect in the near-synchronous system V1432 Aql.

There are hints for at least two of the near-synchronous systems that the synchronization of the white dwarf has been broken as the result of a nova outburst. Asynchronism was observed in V1500 Cyg after it had erupted as Nova Cygni 1975 (Stockman et al., 1988) and spectra of BY Cam show anomalous line ratios in the UV, which can be explained by a non-solar chemical composition induced by a nova event (Bonnet-Bidaud & Mouchet, 1987). Therefore Friedrich et al. (1996b) performed an analysis of IUE spectra of V1432 Aql but found no evidence for an anomalous chemical composition.
The locking of the white dwarf rotation into synchronization in the near-synchronous systems may be re-established over time scales of the order of – yr, as expected from the torques caused by the accretion and the magnetic interaction of the binary components (Campbell & Schwope, 1999). Such secular changes in the spin periods have been detected for the systems V1500 Cyg, BY Cam, and V1432 Aql, see Table 1 for the corresponding synchronization time scales for the white dwarfs. From a combined analysis of optical and X-ray data Geckeler & Staubert (1997a) have first detected a marginally significant (2 level) of the white dwarf spin period of the order of s/s in V1432 Aql. The corresponding synchronization time scale of 100 yr is in excellent agreement with the theoretical prediction from the dominant magnetic torque acting on the white dwarf. Our new data verify this result and allow a more accurate determination of , see Section 7.
3 Dipole Accretion Model
Geckeler & Staubert (1997a) have developed a model for the accretion process in near-synchronous polars, where the infalling matter is captured in a centered dipole field geometry and accreted along different field lines during the beat cycle, see Fig. 1.

The magnetic moment of the white dwarf is inclined relative to the spin axis (Z′-axis) by the colatitude and positioned in the (X) Z′ half plane. We have assumed that the infalling matter (the Horizontal Stream in Fig. 1) is captured in the orbital plane of the binary system at the threading point which is at a distance from the white dwarf primary and at an azimuthal angle relative to the positive X′-axis in the X′Y′-plane. See Geckeler & Staubert (1997a) for further details about the system geometry and the definition of the equivalent threading radius which is being used as a model parameter. For systems with , and under the assumption that the threading point lies on the line of stellar centers, the azimuthal angle is associated with the beat phase (see the exact definition below) by . (We note that the definition of in Geckeler & Staubert (1997a) is not correct, it should instead read as here. The definition of beat phase is the same in both papers). It is, however, to be expected that the horizontal stream leaving the inner Lagrangian point does follow a ballistic trajectory in the orbital plane under some angle to the line of stellar centers (Lubow & Shu, 1975, Mouchet et al., 1997). In order to be independent of the geometric details, we define the beat phase through observations: (see the ephemeris given in Table 5) is the time when the deepest minimum in the optical and the X-ray light curves due to spin modulation coincides with the center of dips (assumed to be eclipses) due to binary modulation. As we will discuss below, this means physically that the observer is looking down the accretion column mostly aligned with the line of centers of the binary components. The equivalent radius , rather than the physical radius , will be used as a model parameter:
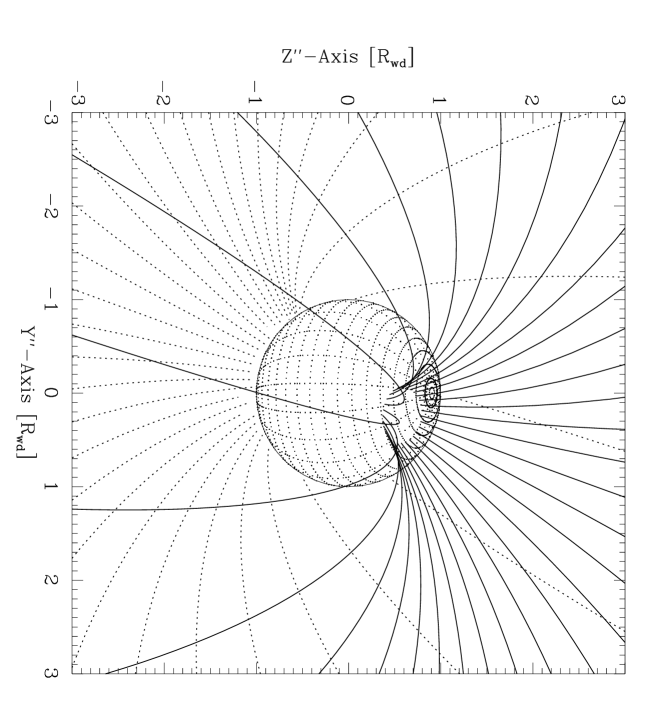
During one beat phase the threading point rotates in the orbital plane and the infalling matter is captured progressively by different field lines. Figure 2 shows the accreting field lines as seen by an observer in an arbitrary coordinate system X”Y”Z”. This corresponds to one particular observing position in the X’Y’Z’ system with assumed values of , an equivalent threading radius , and an inclination . The accretion stream follows different field lines as a function of beat phase and the impact point traces an ellipsoidal path around the magnetic pole (center of the field line bundle) on the white dwarf surface during one beat period (Fig. 3). In near-synchronous polars, the accretion rates for the two poles may vary systematically during the beat cycle and pole switching may occur. This effect depends on the location of the threading point in the coordinate system of the magnetic dipole field (Cropper, 1989). Figure 2 and Figure 3 show the accreting field lines both above and below the orbital plane of the system.
In addition to the displacement of the accretion region on the white dwarf surface, the contribution of the inclination of the field line (and thus the accretion funnel) relative to the surface normal at the accretion spot has to be taken into consideration, e.g., for cyclotron emission features in polars and absorption troughs by the funnel. These features are influenced by the orientation of the magnetic field in addition to the displacement of the accretion spot. Both effects result in shifts of the timing of light curve and polarization features against the spin ephemeris as a function of the beat phase .
4 Data
We have obtained a total of 42 nights of optical CCD photometry of V1432 Aql during the years 1993–1997: 35 nights in white light at the Tübingen 40 cm Cassegrain or the 30 cm refractor and 7 nights in R–band at the Sonneberg 60 cm Cassegrain. Standard reduction of the CCD frames (bias subtraction, dark correction, flat fielding) has been performed. The CCD frames have been analysed with our own IDL software package for aperture photometry which automatically finds the optimum extraction radii to maximize the signal-to-noise ratio for point sources in our mostly background dominated frames. We have achieved time resolutions ranging from 30 s to 160 s. Additionally, photometric data from Patterson et al. (1995) and Watson et al. (1995) have been scanned and included in the analysis. Timing data have been barycenter corrected using a software of the Northern Data Reduction Consortium (NDAC) developed for the Hipparcos project.
| ROR-ID | Date | JD of obs.b | [ks] | PI |
|---|---|---|---|---|
| 700782 | 92/04 | 48742.0–42.3 | 8.7 | Staubert |
| 701090 | 92/10 | 48904.3–26.2 | 29.6 | Staubert |
| 700923 | 93/04 | 49077.8–79.9 | 38.2 | Madejski |
| 701460 c | 93/10 | 49274.5–78.9 | 31.4 | Staubert |
a: Source integration time
b: JD–2 400 000.0
c: including 701466, 701472, 701478
With respect to X-ray observations of V1432 Aql used for this investigation, we give an observation log of the ROSAT PSPC data in Table 2. About 110 ks of energy-resolved Rosat observations with the imaging X-ray instrument PSPC (0.1–2.4 keV energy range) of the polar V1432 Aql obtained by us and other investigators have been used for this paper (see Table 2). The source was also observed with the Rosat/HRI, however, no trough timings could be determined from these data. In addition, we make use of one RXTE observation of 12 July 1996 with a total on-source time of 21.7 ks. For this observation an off-axis pointing was chosen in order to avoid contamination by the Active Galaxy NGC 6814 situated 37′ away from V1432 Aql. It places NGC 6814 at the edge of the field of view of the PCA instrument (approx. 1∘ FWHM). The light curves cover the energy range 2 to 20 keV (channels 4–53, epoch 3) and have a temporal resolution of 16 s (data mode “standard2f”). The data have been background subtracted and barycenter corrected. From these data no information about the spin ephemeris (Section 5.3) have been extracted, they have only been used for the period analysis as discussed in Section 5.2.
5 Optical and X-ray Spin Modulation
5.1 General Results
Figure 4 presents a sample optical light curve of V1432 Aql as obtained on 9 Sept. 1996 with the 40 cm Cassegrain of the Tübingen institute, demonstrating the complex intensity variations of this object in the optical waveband.

Narrow ’dips’ in the optical and X-ray light curves with full widths between half intensity at ingress and egress of s (Geckeler & Staubert, 1997b, Geckeler & Staubert, 1999, Mukai et al. 2000) and the radial velocities of the narrow emission line components (Staubert et al. 1994) follow the orbital period of the binary of s (Patterson et al., 1995). We take these ’dips’ as eclipses of the emission region by the secondary.
The fast ingress/egress of the source of the X-ray emission in the RXTE data during the dip event, the total absorption of the X-ray flux during dip totality, the non-detection of hardness variations due to energy-dependent absorption in both RXTE and Rosat data and the stable timing of the X-ray dips with respect to a linear ephemeris all support this interpretation.
The main modulation of the optical and X-ray flux is caused by the changing aspect of the accretion spot on the surface of the white dwarf, the emission characteristics of the different emission mechanisms in the optical and X-ray wavebands, and absorption by the magnetically confined accretion funnel directly above the accretion region (see Imamura & Durisen, 1983 for simulated X-ray pulse profiles). The broad modulation thus follows the spin period of the white dwarf ( s).
The broad feature in the optical light curve labeled ’trough’ with a full width of 2000–3000 s between half intensity is assumed to occur mainly due to absorption in the accretion column, when the viewing angle between the accretion funnel directly above the accretion region and the direction to the observer is at a minimum, and due to the emission characteristics of the optical cyclotron emission. It is also prominent in the X-ray waveband, where due to electron scattering and bound-free absorption in the funnel (Imamura & Durisen, 1983), see also Geckeler & Staubert (1997a) for a combined optical/X-ray pulse profile of V1432 Aql. The absorption is sufficient to produce the trough feature in the X-ray band for typical physical parameters of the accretion region in V1432 Aql.
We have observed a shift of the trough timings with a half amplitude of the order of 1000 s with respect to the spin ephemeris as a function of the phase . There are two contributions to the total time shifts: the first is due to the longitudinal displacement of the hot spot on the white dwarf surface, and the second is due to the changing orientation of the field lines guiding the accretion stream.
5.2 Period Analysis
A periodogram analysis (Scargle, 1982) has been performed on a set of optical observations of V1432 Aql consisting of data from 22 nights spread over 1996–1997 (15 nights in white light in Tübingen, 7 nights in R–band in Sonneberg). For the joint analysis the R–band data have been transformed into the Tübingen ST7-white light system using overlapping data sets. The resulting periodogram is shown in Fig. 5. Both periods, the orbital period and the spin period, are clearly separated.


Timing analyses of the X-ray flux of V1432 Aql have been presented, e.g., by Staubert et al. (1994), Friedrich et al. (1996a) and Mukai (1998). In doing such an analysis, it is quite important to use the method of Scargle (1982) for unevenly sampled data. Since the periods of interest are in the ks range, with the satellite orbit being ks, the sampling considerably influences the timing analysis. This has also been the case with earlier Rosat observations analysed by Mukai (1998).
In the following analysis we present X-ray data with high signal to noise ratio from one of our RXTE observations which was done on 12 July 1996 with a total on-source time of 21.7 ks (we concentrate on this particular observation since it is least affected by observational gaps).
Figure 6a shows the light curve in the 2–20 keV range and Figure 6b the corresponding Scargle Power Spectral Density (PSD). In order to make comparisons easier, we display frequency instead of period dependence and show the same frequency interval as Mukai, 1998.
The PSD contains several peaks well above the PSD level of , corresponding to a false alarm probability (fap), i.e., a significance of for a periodic signal in the data. The fap was computed using the statistical distribution of the peak Scargle power of simulated realizations of a Gaussian white noise process with the same variance and the same sampling as the original light curve. The peaks in the PSD are asymmetric and very broad due to the window function. The most prominent peak is centered at s with a FWHM of 3800 s. As can be expected, it is not possible to separate the s orbital period and the s period. The same has been the case for the Rosat data used by Mukai (1998), which had led to the proposal of V1432 Aql being an intermediate polar (IP) with s. A strong peak corresponding to a period of ks is apparent also in the RXTE data, but it reaches only of the peak power of the 12 ks feature in the PSD. The local maximum of the PSD near 4 ks is located at 3880 s, with 350 s FWHM of the peak. The power in the 6 ks regime is comparable to that of several smaller peaks introduced by the window function. This regime coincides with the satellite orbit of RXTE ( ks), as has also been the case with Rosat.
In order to test whether the 4 ks period is a true period, we calculated the PSD of simulated data assuming a sinusoidal light curve with a period of s and the same sampling and signal-to-noise ratio as the RXTE observation of V1432 Aql. It is clear from this PSD, given in Fig. 6c, that even with the simple assumption of a sine modulation with a single period of s, the 4 ks feature shows up as an alias of the longer period: the simulation reproduces the height and width of the peak, as well as its location in the frequency domain. We therefore conclude that the 4 ks feature is most likely not a true period. In addition to these arguments from the period analysis of our optical and X-ray observations, we will show in Section 7 that the synchronization time scale observed in V1432 Aql also strongly argues against the interpretation of the system as an Intermediate Polar.
5.3 Spin Ephemerides
In order to analyse changes in the shape and timing of the trough as a function of the varying accretion geometry in V1432 Aql, we have defined procedures to get accurate estimates of the time of trough minimum and its width. We have defined Thi as the time of half intensity between the flux at the onset of the trough and the flux at the bottom of the trough, and, equivalently, The as the time of half intensity during the phase of recovering flux. The full width of the trough profile at half intensities is given by .
| Error [s] | [s] | |
| White Light CCD Photometry Tübingen | ||
| 49543.54387 | 600 | - |
| 49567.45594 | 600 | - |
| 49568.43930 | 400 | - |
| 49638.32219 | 600 | - |
| 50281.40729 | 140 | 2200 |
| 50285.48114 | 170 | - |
| 50286.46490 | 160 | 3400 |
| 50287.44850 | 120 | 3200 |
| 50332.30930 | 170 | 2200 |
| 50332.45138 | 90 | 3000 |
| 50336.38632 | 220 | 2900 |
| 50639.56572 | 200 | - |
| R-Band CCD Photometry Sonneberg | ||
| 50285.47960 | 120 | 3000 |
| 50286.46433 | 150 | 3100 |
| 50287.44977 | 200 | 2900 |
| V-Band CCD Photometry, Patterson et al. (1995) | ||
| 49571.67324 | 270 | 4200 |
| 49572.65849 | 150 | - |
| 49577.71404 | 130 | 2900 |
| 49577.85521 | 170 | 2700 |
| 49578.69991 | 140 | 2900 |
| 49578.83958 | 200 | 2900 |
| 49579.68234 | 200 | 2700 |
| 49579.82152 | 190 | 2700 |
| 49580.66430 | 150 | 2800 |
| 49580.80703 | 140 | 3200 |
| 49581.65049 | 140 | 3300 |
| 49581.78985 | 140 | 2800 |
| 49582.77559 | 210 | 3100 |
| White Light Photometry, Watson et al. (1995) | ||
| 49238.66143 | 400 | - |
| 49239.50662 | 340 | - |
| Rosat Data | ||
| 48921.52856 | 180 | 3200 |
| 49078.74851 | 110 | 2200 |
| 49277.04638 | 170 | 2700 |
a: BJD–2 400 000
b: Error estimates, see text

| [d] | s/s] | Data | |
|---|---|---|---|
| 0.14062688(90) | –0.55(28) | 49638.32469(98) | (1) |
| 0.14062958(94) | –0.98(29) | 49549.7361(41) | (2) |
| 0.14062845(26) | –1.013(98) | 49638.32497(93) | (3) |
The 1 errors of the parameters are
given in terms of the last two significant
digits (in parentheses).
a: BJD-2 400 000.
(1) Optical trough timings in CCD photometry from Tübingen and
Sonneberg (1993–97) and the scanned photometry from
Patterson et al. (1995) and Watson et al. (1995);
(2) Geckeler & Staubert (1997a), combined fit to a subset of the
optical trough timings and X-ray trough timings;
(3) Combined fit to all available optical trough timings
from (1) plus the X-ray trough timings.
The timing of the trough minimum Tbs has been defined by the bisector method to provide an accurate estimate of the minimum. The trough profile is successively cut at different intensity levels and the mean timings between identical flux levels at decreasing and increasing flux are determined, which define the bisector line. The timing Tbs is then defined as the intersection of a straight line fit through the bisector with the flux curve during the trough minimum. This procedure refines the determination of the minimum timing when compared to a subjective estimate of the trough center. Errors of the trough minima Tbs have been estimated according to the quality and time resolution of the light curves. They are of the order of 5% of the full widths of the troughs.
Table 3 gives the resulting timings Tbs and full widths for the troughs in the CCD photometry from Tübingen and Sonneberg from 1993–97 plus the timings derived from the photometry of Patterson et al. (1995) and Watson et al. (1995). The Rosat PSPC profiles have been obtained by folding flux data in the 0.5–2.4 keV energy range with the spin period to obtain pulse profiles with a resolution of 50 phase bins. Due to gaps in our RXTE observations we were not confident in trough timings from these data. The application of the bisector method to define the timings Tbs of the trough minima improved the quality of the timings compared to the values used in Geckeler & Staubert (1997a) (note that in Table 1 of that paper entries 1, 4 and 7 are not valid).
The timings of the troughs from Table 3 have been analysed by fitting a quadratic spin ephemeris to the data:
The resulting ephemerides are given in Table 4. There is clear evidence for a secular change of the white dwarf spin period of the order of s/s, with a resulting synchronization time scale of yr, comparable to the 170 yr seen in V1500 Cyg.
Figure 7a shows the residuals of the timings of the trough minima from the optical photometry with respect to the linear component of the quadratic best fit ephemeris (1) from Table 4. The solid line represents the quadratic ephemeris, the dotted lines mark the maximum deviations of the trough timings as caused by the varying accretion geometry. Figure 7b shows the residuals of the timings from the combined optical and the X-ray data set with respect to the linear component of the best fit ephemeris (3) from Table 4.
6 Accretion Geometry in V1432 Aql
In this section, we will apply the dipole accretion model plus a quadratic spin ephemeris to the timings of the trough minima from Table 3 by means of a simultaneous best fit procedure, starting with the analysis of the optical trough data.
Figure 8a shows the residuals of the estimated timings of the optical trough minima with respect to the quadratic spin ephemeris as a function of the beat phase (solid line: dipole accretion model for the best fit parameters MO in Table 5). The for the fit (24 degrees of freedom = 30 data points minus 6 free parameters) clearly shows that the model adequately describes the trough timings over the whole five year period 1993–1997. However, we have overestimated the uncertainties of the trough timings, which leads to .
The assumption of a dipole field for the white dwarf field geometry in V1432 Aql is appropriate to describe the shifts of the trough timings, but due to the limited coverage of the beat phase it is not possible to rule out more complex field geometries. Due to the limited beat phase coverage, we also cannot rule out the presence of pole switching in the system. The accretion rates for the two poles are supposed to vary systematically during the beat cycle, or the accretion even may switch poles altogether at selected beat phases, depending on the hemispheric location of the threading point in the magnetic coordinate system of the dipole field. The model in Fig. 8 has been calculated for the magnetic pole facing the threading region at (see Fig. 1 for a visualization). The bulk of trough timings are located between beat phase 0.4 and 0.9, where a simple pole switching model would assume this pole to be the main accreting pole. Clearly, a more complete coverage of is necessary to search for the effects of pole switching.
According to this simplified pole-switching scenario, almost all trough timings observed in V1432 Aql are thus associated with the same accreting pole. We therefore conclude that we mainly observed the effects of the varying accretion geometry during the beat cycle for one pole. For an inclination , one pole will be predominantly visible throughout the spin cycle. For this pole, the observer will look directly into the accretion funnel near beat phase for geometries with . The angle is defined by the equation . It is the angle between the dipole axis and the actual location of the accretion spot at . The factor 1.5 results from the inclination of the accretion funnel relative to the surface normal, which is approximately for a dipole field geometry. An absorption of the emission from the accretion region near this pole by the funnel (assumed to cause the trough features in our model) is possible for observing geometries with . For estimating from such observations more data are needed.

| Optical Trough Timings – Parameter Set MO | |||
|---|---|---|---|
| Parameter | Best Fit | +1 | |
| 12.6 | 6.9 | - | |
| [∘] | 85.1 | - | - |
| 3.6 | 1.1 | 2.7 | |
| [d] | 0.1406271 | ||
| [s/s] | |||
| [BJD] | 2 449 638.3317 | ||
| [d] | 50.28 | 0.15 | 0.21 |
| [BJD] | 2 449 646.9 | 4.3 | 6.2 |
| Optical and X-ray Trough Timings – MXO | |||
| 11.2 | 5.0 | - | |
| [∘] | 89.2 | - | - |
| 3.5 | 0.9 | 1.9 | |
| [d] | 0.14062879 | ||
| [s/s] | |||
| [BJD] | 2 449 638.3325 | ||
| [d] | 50.062 | 0.066 | 0.064 |
| [BJD] | 2 449 646.9 | 5.9 | 3.0 |

The resulting best fit parameters for the simultaneous application of the dipole accretion model plus a quadratic ephemeris to the optical trough timings are given in Table 5, together with their jointly estimated uncertainties (+7.01 for six free parameters). The optical data allow us to determine the spin period of the white dwarf s and the resulting beat period is d (both valid for Epoch 1995.2). We have used d (12116.295 s) and the reference center of eclipse HJD 2449568.509764(1) from Patterson et al. (1995). The ephemeris for the optical trough data includes a significant secular change of the white dwarf spin period of s/s.
The parameters and are not well constrained individually by the fit, which is reflected by the large or not defined errors in Table 5, because they are related by the following, purely geometrical expression:
| (1) |
For a given amplitude of the observed shift of the trough timings, an increase in the colatitude can thus be compensated for by an increase in the size of the ellipsoid traced by the accretion region on the white dwarf surface around the magnetic pole (and thus a decrease in ).
The influence of the above relation especially affects the determination of the colatitude , which cannot be constrained by the fitting procedure. The graph of the shifts of the trough timings resulting from the dipole accretion model retains a sinusoidal shape for a wide range of colatitudes. Its amplitude is increasing as the ellipse traced by the accretion spot (Fig. 3) is nearing the rotational axis of the white dwarf with decreasing colatitude . A marked asymmetry in the graph of the shifts of the trough timings results only if the ellipse traced by the accretion region is located near the rotational axis (). The critical colatitude is defined as , separating accretion geometries in which the white dwarf spin axis is located outside of the accretion ellipse () or inside of it (). The fitting procedure is not able to produce meaningful constraints for the colatitude, it gives a formal value (which cannot be taken at face value) unconstraining errors. In interpreting the mean period between successive meridian crossings of the accretion region one needs to distinguish between the two cases () as discussed in Geckeler & Staubert (1997a).
Because the mean period of the trough timings in V1432 Aql is longer than the orbital period, we obtain . Additionally, an upper limit (68% confidence) of for the colatitude can be obtained from the analysis of the data.
To demonstrate the effect of the relationship with respect to the optical data set, the resulting elongated valley in as a function of the model parameters and is illustrated in Fig. 9a. The contour lines are for 68%, 90% and 99% confidence levels (+2.28, 4.61 and 9.21 for two free parameters). The position is marked by a cross. To emphasize the relation, the other parameters of the model have been fixed to their best fit values. This valley is narrower compared to the one resulting from a fit, where all six parameters are set free (as used in the determination of the best fit parameters).
The fitting procedure nevertheless does allow to determine the dimensionless parameter for the optical data with the constraint . Its value determines the amplitude of the shift of the trough timings in the dipole accretion model.
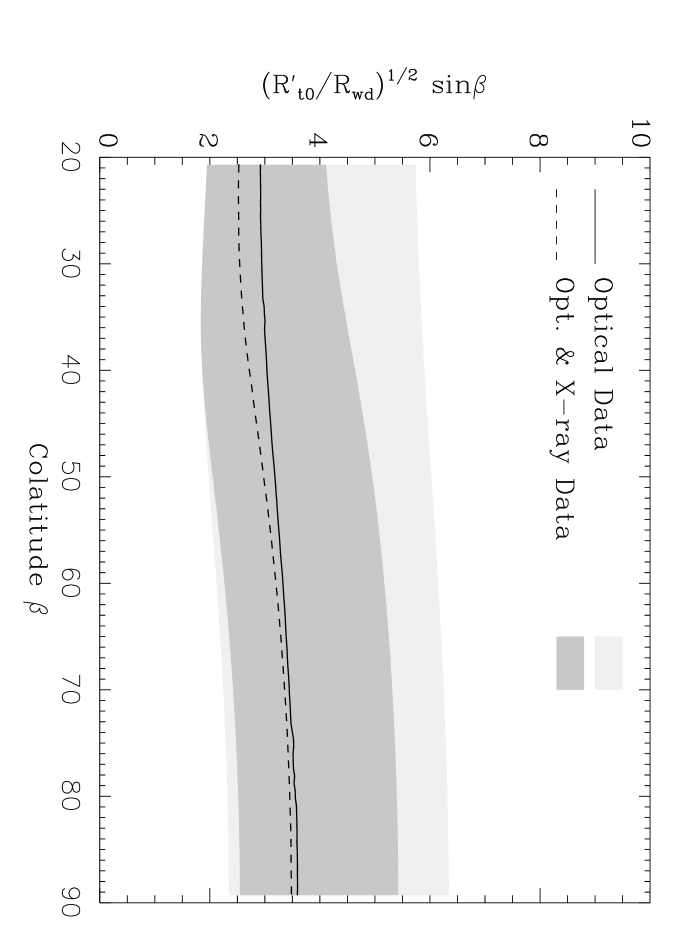
The relation between the parameters and is an approximation for , with the value being a weak function of (or alternatively). Figure 10 shows the resulting best fit values for the parameter as a function of the colatitude for the application of the dipole accretion model plus a quadratic ephemeris to the optical trough timings and to the combined optical/X-ray data set. The grey areas visualize the error ranges (68% confidence contours). As the graph shows, the values from the analysis of the optical data set and of the combined optical/X-ray data are consistent. This dimensionless parameter is the relevant parameter constraining the accretion geometry of V1432 Aql. Because it is, as a first order approximation, only a function of the observed amplitude of the shift of the trough timings with respect to the spin ephemeris, its value is constrained by the data in a robust way. With an independent estimate for (e.g. from polarimetry), could be calculated from this parameter.
The fit also results in at the 68% confidence level. Together with an estimate of as a function of the system parameters from Mukai (1988) and of the accretion rate from the – relation () from Patterson (1984) of g s-1, this results in G for the polar strength of the white dwarf magnetic field, as expected for a polar.
Since only three trough timings are available from Rosat X-ray observations, we have combined them in the analysis with the optical data set, assuming that the optical and X-ray troughs occur at exactly the same time. This assumption may not be quite correct, as the detailed discussion in Section 7 will show. We have applied the dipole accretion model plus a quadratic ephemeris to the timings of the trough minima from Table 3. The (at 27 degrees of freedom = 33 data points minus 6 free parameters) shows that the dipole accretion model adequately describes the data set, albeit with a worse fit between the model and the data compared to the fit to the coherent optical data set alone.
Figure 8b shows the residuals of the timings of the optical and X-ray trough minima with respect to the quadratic ephemeris as a function of the beat phase (model parameters MXO, see Table 5).
The resulting best fit parameters are given in Table 5, together with their errors. The combined analysis of the optical and X-ray data allows to determine the spin period of the white dwarf as s (Epoch 1995.2), consistent with the result from the optical data set within error limits. The ephemeris includes a significant s/s. The absolute value for the period change is larger than the one derived from the optical data set alone, which covers a smaller time base. We will discuss this discrepancy in the estimates of in the following Section 7 in detail.
The parameters and are not constrained individually by the fitting procedure, but the dimensionless parameter can be determined, consistent with the result from the optical data set within error limits.
The effect of the relationship is demonstrated in Fig. 9b. The contour lines are for 68%, 90% and 99% confidence levels and the remaining parameters of the model have been fixed to their best fit values. The position is marked by a cross.
7 Synchronization Time Scale and Torques
Geckeler & Staubert (1997a) provided first evidence for a secular change of the spin period of the white dwarf s/s in the system V1432 Aql, corresponding to a synchronization time scale for an adjustment of the spin period to the orbital period of the order of 100 yr.
Table 6 shows the values for and the corresponding synchronization time scales derived from the timings of the troughs in the optical data set and a combined analysis of trough timings in the optical and X-ray data. The data have either been analysed by fitting a quadratic ephemeris to the timings or the simultaneous application of the dipole accretion model for a refined fit.
| [yr] | Ref. | ||
| Optical Data Set | |||
| (1) | |||
| (2) | |||
| Optical & X-ray Data Combined | |||
| (3) | |||
| (4) | |||
| (5) | |||
| Optical & X-ray data (shift included) | |||
| (6) | |||
a: In units of s/s
(1) All optical data 1993–1997, quadratic ephemeris;
(2) Data set (1), simultaneous application of dipole accretion model;
(3) Geckeler & Staubert (1997a),
CCD photometry Tübingen 1993–1996, including scanned photometry
from Patterson et al. (1995) and Watson et al. (1995)
and the X-ray data from Rosat, dipole accretion model;
(4) All optical data from 1993–1997 and X-ray data from Rosat,
quadratic ephemeris;
(5) Data set (4), simultaneous application of dipole accretion model;
(6) Data set (4), simultaneous application of dipole accretion model
and a shift between the optical and X-ray trough timings. See text
for further details.
Due to the extended data base for this analysis as compared to the data available to Geckeler & Staubert (1997a), a significant secular change of the white dwarf spin period can now be inferred from the optical trough timings alone, without using the X-ray data set. The inclusion of the trough timings in the X-ray waveband expands the available timebase (X-ray data cover the period 1992.8–93.2) for the determination of , resulting in a lower formal error for the period change. However, the combination of the X-ray data with the optical data set consistently yields lower values for the synchronization time scale (larger values for ) than fits to the optical data only. To examine this discrepancy, we have expanded the dipole accretion model by allowing for systematic shifts of the X-ray trough timings with respect to the optical data. A shift of the X-ray trough timings with respect to the optical troughs of s is marginally significant ( and with the shift, and without). The resulting s/s, and the corresponding yr have values in between the results for the analysis of the optical data and the combined analysis of optical and X-ray data sets.
Therefore, it is most likely that the discrepancy between the values for and derived from the optical data set and the combined optical and X-ray data is caused by a systematic shift between the trough timings in both wavebands. Thus, we judge the values for for V1432 Aql from the analysis of the coherent optical data set as the more reliable and appropriate estimates of this parameter, yielding a synchronization time scale of approximately 200 yr. Still, the underlying physical cause for the troughs (absorption in the accretion funnel directly above the accretion region) is the same. Because the X-ray data precede the optical data (Fig. 7), a slightly variable (and therefore inclusion of terms of higher order into the ephemeris) also might contribute to the discrepancy.
The time scale for the synchronization in near-synchronous systems can be calculated by estimating the torques acting on the white dwarf by the infalling matter and the magnetic interaction of the binary components (Hameury et al., 1989, Campbell & Schwope, 1999). Using relations (8) and (10) from Warner & Wickramasinghe (1991) and adapting them for near-synchronous systems, we obtain:
| (2) | |||||
| (3) |
with the magnetic moments of the white dwarf and of the secondary (intrinsic plus induced components), the mass accretion rate and with the mass of the white dwarf set to .
In the unique system V1432 Aql with both torques on the white dwarf by the infalling matter and the magnetic interaction with the secondary are acting in concert towards a synchronization of the white dwarf spin period with the orbital period, resulting in a relatively short synchronization time scale. In the other near-synchronous systems BY Cam, V1500 Cyg and RX J2115–58, only the magnetic interaction will work towards a (re-) synchronization of the white dwarf spin rotation with the binary period.
Using the – relation for cataclysmic variables (, Patterson, 1984 - as already used in Section 6) we obtain an estimate of the mass accretion rate for V1432 Aql of g/s. The resulting synchronization time scale from the torque of the accreted matter is yr. With typical magnetic moments for both binary components ( G cm3 for a white dwarf primary with and MG; G cm3 for the secondary, see Warner & Wickramasinghe, 1991) the resulting synchronization time scale from the magnetic torque is yr. The magnetic torque thus dominates the synchronization process in the near-synchronous system V1432 Aql. Generally it is assumed that white dwarfs in polars are more massive. For a white dwarf with ( G cm3 with MG) we obtain yr.
The synchronization time scale observed in V1432 Aql thus can be theoretically explained by the action of the dominating magnetic torque on the white dwarf due to the interaction of the magnetic fields of both binary components. If we assume that V1432 Aql would be an intermediate polar with s, as proposed by Mukai (1998), the observed would be approximately two orders of magnitude higher than typical values for Intermediate Polars (Patterson, 1994). Therefore our results for the synchronization time scale favor the interpretation that V1432 Aql is indeed a near-synchronous system, albeit the only one known with , which places an interesting theoretical problem and is not yet understood.
8 Conclusions
Systematic studies of near-synchronous polars extending over at least one beat period provide a unique opportunity to gain insight into the not well understood interaction between the infalling accretion stream and the white dwarf magnetosphere. This allows to find tighter constraints on model parameters as in the case of locked polars.
We have presented a dipole accretion model for the description of the accretion process in near-synchronous systems in general and demonstrated its applicability to V1432 Aql. We have demonstrated how the model allows to constrain the accretion geometry in this system.
We have observed a secular change of the white dwarf spin period in V1432 Aql, resulting in a synchronization time scale of yr, comparable to the time scale for the white dwarf in V1500 Cyg. After V1500 Cyg and BY Cam, V1432 Aql is the third near-synchronous system (out of four) with a known secular change of the white dwarf spin period. The synchronization time scale is in excellent agreement with theoretical predictions from the torques in near-synchronous systems.
We put forward arguments against the alternative model of the system V1432 Aql as an intermediate polar with s (Mukai, 1998), and for the interpretation of this peculiar system as the only near-synchronous polar with .
Acknowledgements.
This work is largely based on the doctoral thesis of R.D. Geckeler, submitted to the Physics Faculty of the University of Tübingen in 1998, and an unpublished manuscript originally submitted to A&A by Geckeler et al. in 2000. We thank the referee for a very detailed and constructive report which allowed to improve the paper significantly. This work had been supported by DARA grant 50009605 and FWF grant P 11675–AST. R. Rothschild acknowledges support by NASA contract NAS5–30720 and NSF grant INT–9815741.References
- (1) Beuermann, K., Burwitz, V., 1995, In: Buckley, D.A.H. and Warner, B. (eds.), ASP Conf. Ser. 85: Magnetic Cataclysmic Variables, 99
- (2) Bonnet-Bidaud, J.M., Mouchet, M., 1987, A&A, 188, 89
- (3) Campbell, C.G., Schwope, A.D., 1999, A&A, 343, 132
- (4) Chanmugam, G., Langer, S.H., 1991, ApJ, 368, 580
- (5) Cropper, M., 1989, MNRAS, 236, 935
- (6) Cropper, M., 1998, In: Accretion Processes in Astrophysical Systems: Some Like it Hot!, American Institute of Physics, 447
- (7) Frank, J., King, A.R., Lasota J.P., 1988, A&A, 193, 113
- (8) Friedrich, S., Staubert, R., Lamer, G., et al., 1996a, A&A, 306, 860
- (9) Friedrich, S., Staubert, R., la Dous, C., 1996b, A&A, 315, 411
- (10) Geckeler, R.D., Staubert, R., 1997a, A&A, 325, 1070
- (11) Geckeler, R.D., Staubert, R., 1997b, AAS, 190, 4503
- (12) Geckeler, R.D., Staubert, R., 1999, Abstr. Ann. Meeting of the Astronomische Gesellschaft, 15, P47
- (13) Hameury, J.-M., King, A.R., Lasota, J.-P., 1989, MNRAS, 237, 39
- (14) Imamura, J.N., Durisen, R.H., 1983, ApJ, 268, 291
- (15) Kuijpers, J., Pringle, J.E., 1982, A&A 114, L4
- (16) Lamb, D.Q., Masters, A.R., 1979, ApJ, 234, 117
- (17) Lamb, F.K., Aly, J.J., Cook, M.C., Lamb, D.Q., 1983, ApJL, 274, L71
- (18) Lubow, S.H., Shu, F.H., 1975, ApJ, 198, 383
- (19) Madejski, G.M., Done, C., Turner, T.J., et al., 1993, Nat, 365, 626
- (20) Mason, P.S., Chanmugam, G., 1992, In: N. Vogt (eds.), ASP Conf. Ser. 29: Cataclysmic Variable Stars, 216
- (21) Mouchet, M., Bonnet-Bidaud, J.M., Somov, N.N., Somova, T.A., 1997, A&A 324, 109
- (22) Mukai, K., 1988, MNRAS, 232, 175
- (23) Mukai, K., 1998, ApJ, 498, 394
- (24) Mukai, K., Hellier, C., Madejski, G., 2000, AAS, 197, 0902
- (25) Patterson, J., 1984, ApJS, 54, 443
- (26) Patterson, J., Halpern, J., Skillman, D.R., 1993, IAU Circ. 5852
- (27) Patterson, J., 1994, PASP, 106, 209
- (28) Patterson, J., Skillman, D.R., Thorstensen, J., et al., 1995, PASP, 107, 307
- (29) Pavlenko E. P., Pelt J., 1991, Astrofizika, 34, 2, 169
- (30) Ramsay, G., Buckley, D.A.H., Cropper, M.S., Harrop-Allin, M.K., 1999, MNRAS,303, 96
- (31) Rosen, S., Done, C., Watson, M., Madejski, M.G., 1993, IAU Circ. 5850
- (32) Scargle J.D., 1982, ApJ 263, 835
- (33) Schmidt, G. & Stockman, H.S., 1991, ApJ, 371, 749
- (34) Schmidt, G.D., Liebert, J., Stockman, H.S., 1995, ApJ 441, 414
- (35) Schmidt, G.D., Szkody, P., Smith, P.S., et al., 1996, ApJ, 473, 483
- (36) Schwope, A.D., 1990, Rev.Mod.Astr. 3, 44
- (37) Schwope, A.D., 1995, Rev.Mod.Astr. 8, 125
- (38) Schwope, A.D., Thomas, H.-C., Beuermann, K., et al., 1995, A&A, 293, 764
- (39) Schwope, A., Buckley, D.A.H., O’Donoghue, D., et al., 1997, A&A, 326, 195
- (40) Silber, A.D., Szkody, P., Hoard, D.W., et al., 1997, MNRAS, 290, 25
- (41) Staubert, R., Friedrich, S., Bässgen, M., 1993, IAU Circ. 5901
- (42) Staubert, R., König, M., Friedrich, S., 1994, A&A, 288, 513
- (43) Stockman, H.S., Schmidt, G.D., Lamb, D.Q., 1988, ApJ, 332, 282
- (44) Warner, B., Wickramasinghe, D.T., 1991, MNRAS, 248, 370
- (45) Watson, M.G., Rosen, S.R., O’Donoghue, D., et al., 1995, MNRAS, 273, 681
- (46) Wickramasinghe, D.T., Meggitt, S.M.A., 1985, MNRAS, 214, 605
- (47) Wu, K. & Wickramasinghe, D.T., 1993, MNRAS, 260, 141