STIS spectroscopy of the emission line gas in the nuclei of nearby FR-I galaxies11affiliation: Based on observations with the NASA/ESA Hubble Space Telescope, obtained at the Space Telescope Science Institute, which is operated by the Association of Universities for Research in Astronomy, Inc., under NASA contract NAS 5-26555
Abstract
We present the results of the analysis of a set of medium resolution spectra, obtained by the Space Telescope Imaging Spectrograph on board the Hubble Space Telescope, of the emission line gas present in the nuclei of a complete sample of 21 nearby, early-type galaxies with radio jets (the UGC FR-I Sample). For each galaxy nucleus we present spectroscopic data in the region of H and the dervived kinematics.
We find that in 67% of the nuclei the gas appears to be rotating and, with one exception, the cases where rotation is not seen are either face on or have complex central morphologies. We find that in 62% of the nuclei the fit to the central spectrum is improved by the inclusion of a broad component. The broad components have a mean velocity dispersion of and are redshifted from the narrow line components (assuming an origin in H) by .
1 Introduction
A nearby radio galaxy can produce a radio jet that reaches up to Mpc, emerging from a central engine that resides in an active region pc in radius in its nucleus. The energy that powers radio jets and active nuclei is typically believed to be produced by the accretion of material onto a central supermassive black hole (Rees, 1984). Central emission line gas is detected in virtually all nearby radio galaxies that harbor kiloparsec-scale radio jets, and this gas along with nuclear dust presumably provide sources of fuel for the central black hole. However, the relationship between normal early-type galaxies and early-type galaxies that are radio-loud remains one of the mysteries in active galaxy research.
Current evidence suggests that all galaxies may have central black holes and that the size of the black hole is a strong function of the mass of the bulge (for example, Kormendy & Richstone, 1995) and and even stronger function of the central stellar velocity dispersion (Ferrarese & Merritt, 2000; Gebhardt, et al., 2000; Merritt & Ferrarese, 2001; Tremaine, et al., 2002). It is not clear what drives these relationships or whether they are the same for active and quiescent galaxies. Since black hole growth and nuclear activity are causally related, scatter in these relationship can, in principle, put limits on the frequency and duration of nuclear activity in galaxies.
Typical findings are that 60% of quiescent early-type galaxies have detections of emission line gas (e.g. Philips, et al., 1986; Goudfrooij, et al., 1994) and about 40% have nuclear dust (e.g. van Dokkum & Franx, 1995; Tran, et al., 2001). Despite the apparent presence of fuel, these galaxies fail to produce radio jets or any significant nuclear activity.
Nearby early-type galaxies with radio jets provide an opportunity to gain an understanding of the conditions in a galaxy which lead to the formation of a radio-active nucleus and of the physics of the regions which harbor the black hole and jet formation regimes. To this end, we are undertaking a coordinated, multiwavelength, study of a complete sample of the nearest radio galaxies (see §2).
Based on our imaging with the Hubble Space Telescope (HST) Wide Field and Planetary Camera - 2 (WFPC2) we found that the galaxies of our sample show ubiquitous nuclear dust and emission line gas (Verdoes Kleijn, et al., 1999). An understanding of the gas kinematics in the central region can enable us to determine the black hole masses (Harms, et al., 1994; Ferrarese, Ford, & Jaffe, 1996; Machetto, et al., 1997; van der Marel & van den Bosch, 1998; Ferrarese & Ford, 1999; Verdoes Kleijn, et al., 2000; Sarzi, et al., 2001; Barth, et al., 2001) and the ionization mechanisms at work in the nuclear regions (e.g. Dopita, et al., 1997) and relate these to other properties of the activity and of the galaxy as a whole. In order to achieve this goal we have obtained HST Space Telescope Imaging Spectrograph (STIS) medium resolution long slit spectra of the nuclear regions of our sample galaxies. We present those data here. In future work we will go on to model the kinematics and other properties of the emission line gas.
The paper is organized as follows. In section 2 we describe the sample and in section 3 we describe the STIS spectroscopic observations and the data reduction. In section 4 we describe our analysis procedures. We present our initial interpretations in section 5 and draw conclusions in section 6. We use a Hubble constant of throughout.
2 Sample selection and Properties
Our galaxy sample (the UGC FR-I sample) contains all 21 nearby (), elliptical or S0 galaxies in the declination range in the UGC catalog (Nilson, 1973, limits magnitude and angular size ) that are extended radio-loud sources (larger than 10″ at on VLA A-Array maps and brighter than 150 mJy from single dish flux density measurements at 1400 MHz)111We have slightly adjusted the sample definition since our earlier work, however the galaxies that the sample contains remain the same. The sample is complete within the definition given here as of the time of writing according to up to date data drawn from the NED database.. The source information is shown in Table 1.
This complete sample was drawn from a catalog of 176 radio-loud galaxies constructed by Condon & Broderick (1988), by position coincidence of radio identifications in the Green Bank 1400 MHz sky maps and galaxies in the UGC catalog.
All of the galaxies fall into the Fanaroff & Riley (1974) Type-I (FR-I) radio classification (see Xu, et al., 2000, for a description of the radio properties of our sample); i.e. they are low luminosity radio galaxies, with jets that are brightest nearest to the nucleus. (In contrast, FR-II galaxies are more powerful radio sources, and have bright spots at the far edges of their radio lobes.)
The primary energy source of each galaxy in the sample falls into ‘monster’ rather than ‘starburst’ classification of Condon & Broderick (1988) based on their infra-red to radio flux ratios (for example, see Heckman, et al., 1983)
| (1) |
and infra-red spectral gradients
| (2) |
A photometric analysis of the nuclei of these galaxies was performed by Verdoes Kleijn, et al. (1999), based on observations made using the WFPC2 instrument (using the F555W and F814W filters) on board the HST (the photometric analyses of UGC 7115 and UGC 12064 are presented in Appendix A of Verdoes Kleijn, et al., 2002).
3 STIS Observations
In program 8236 we used HST/STIS (see Kimble, et al., 1998) to take spectra of the 19 sample members not previously or concurrently observed by others. Observations were carried out at both medium (for 19/19 galaxies) and low (for 4/19 galaxies) resolution, with the G750M and the G430L and G750L gratings respectively. Our medium resolution observation log is shown in Table 2. We will present the low resolution spectra in a future paper. We include in our analysis similar medium resolution data obtained by R. Green and collaborators for the nucleus of M84 (program 7124, see Bower, et al., 1998) and H. Ford and collaborators for the nucleus of M87 (program 8666) to complete the data set for UGC FR-I galaxies.
In our program, we observed each galaxy in three parallel, adjacent slit positions. For each slit position we obtained two exposures with a shift of 0202800 (4 unbinned STIS Pixels) along the slit direction to enable us to more efficiently remove detector effects (bad pixels, etc.). In the case of UGC 7115 we observed in only one slit position - we sacrificed STIS observing time to make WFPC2 observations of this galaxy as it had not been included in our earlier WFPC2 program.
The data for M87 (NGC 4486) were obtained in a similar manner to our own. In the case of M84 (NGC 4374) the observation pairs were not shifted along the slit direction, thus some detector effects may remain, though will be much less significant thanks to the far greater signal to noise.
We list the instrumental properties of the STIS configurations used in Table 3. Panel (a) of Figures 2 to 22 (see key in Figure 1) shows the location of the STIS slits on each galaxy observed, along with the position angles of the galaxy major axes and radio-jet axes. For the majority of cases the STIS slits were aligned within of the galaxy major axes (Table STIS spectroscopy of the emission line gas in the nuclei of nearby FR-I galaxies11affiliation: Based on observations with the NASA/ESA Hubble Space Telescope, obtained at the Space Telescope Science Institute, which is operated by the Association of Universities for Research in Astronomy, Inc., under NASA contract NAS 5-26555), with the exceptions that we note below.
In the cases of NGC 741 [] and NGC 2892 [] more freedom in orientation was allowed to provide reasonable observing windows.
In NGC 3862 and UGC 7115 the position angles of the galaxy major axes are hard to determine, we decided to position the slits approximately perpendicular to the radio jets [, respectively]. The central major axis is also hard to determine in NGC 541, where the central isophotes rotate considerably. In this case we chose to use a slit position somewhere around the mean of the isophotal position angles with considerable leeway given to allow for reasonable observing windows.
For UGC 12064 the slits were aligned along the major axis of the prominent dust disk, which is offset from the galaxy major axis by .
The slits in M84 were positioned approximately perpendicular to the radio jet, which lies close to the major axis of the nuclear gas. For NGC 4486 (M87) the slits were positioned to follow certain morphological structures across the nuclear regions.
3.1 Data Reduction
We used the standard STIS calibration pipeline (calstis, see Brown, et al., 2002) to perform bias, dark and flat-field corrections using the best available reference files. We used calstis version 2.13 (26-April-2002) throughout the data reduction222We found that significant variations in measured parameters could be introduced by using different calstis versions. Versions 2.4 and 2.13 produce consistent results, while intermediate versions do not..
We shifted the rows of alternating observations by 4 pixels, so that they were properly aligned with their counterparts and combined them using the STSDAS routine ocrreject. We cleaned co-incident cosmic rays and negative bad pixels, which would not be caught by ocrreject, using the NOAO/IRAF task cosmicrays. At each step we carefully investigated the effects of varying task parameters to insure we were not damaging valid data while removing most cosmic rays.
We made use of the STIS calibration pipeline tasks wavecal and x2d to perform wavelength calibration and image rectification respectively. The error introduced by rectifying after shifting one of the images is pixels (which is at 6750Å).
4 Analysis
In this section we describe the line fitting that we carried out on each spectral row of each reduced CCD spectral image, firstly with a single Gaussian per spectral line (§4.1) and secondly with the inclusion of an additional free component (§4.2). In §4.3 we discuss the sizes of the errors on quoted parameters from various sources. In §4.4 we describe each of the UGC FR-I sample members in turn. For each galaxy we define the central spectrum as the row with the greatest integrated flux after the data reduction. We list the row numbers in the final x2d image corresponding to the central spectrum in Table 2.
4.1 Single Gaussian line fitting
In the G750M spectra we expect to find the emission lines in the vicinity of H that are listed in Table STIS spectroscopy of the emission line gas in the nuclei of nearby FR-I galaxies11affiliation: Based on observations with the NASA/ESA Hubble Space Telescope, obtained at the Space Telescope Science Institute, which is operated by the Association of Universities for Research in Astronomy, Inc., under NASA contract NAS 5-26555. We used wavelengths from the recent measurements of Wallerstein, et al. (2001) and converted from air to vacuum wavelengths using the IAU standard formula
| (3) |
Using one Gaussian to represent each of these five lines we obtain a set of 7 free parameters to fit: the continuum flux level, velocity (), velocity dispersion (), and the fluxes of each line. The flux of [N II]6550 was fixed in a ratio of 1:3 with the flux of [N II]6585 based on the transition probabilities derived from atomic physics (Osterbrock, 1989).
We used a minimization routine (using Levenberg-Marquardt iterations, see Press, et al., 1992) to fit the Gaussian template to the observed spectra. The application of this fitting technique and development of this routine are described by van der Marel & van den Bosch (1998). Formal errors are drawn from the covariance matrix of the fit. As we do not expect the noise in each spectrum to be normally-distributed after the steps of wavelength calibration and two-dimensional rectification, these error values should be treated strictly as the formal fit errors under the understanding that the size of the real errors may be somewhat different (see §4.3 below).
From this point on we only consider data points where the formal errors from the fits meet the following criteria, allowing us to exclude unreliable data points originating from poorly constrained fits:
| (4) | |||||
| (5) |
where and are the errors in velocity dispersion and line flux respectively. The main constraint arises from the limit on the velocity dispersion error. The very large flux error allowed is in place to remove only the few remaining bad data points where the profile very precisely fits the noise.
In Panel (e) of Figures 2 to 22 (see key in Figure 1) we show profiles of (i) radial velocity, (ii) velocity dispersion, (iii) [N II]6585 line flux and (iv) [N II] / H ratios resulting from this fitting procedure for each of our sample galaxies. These profiles are combined and visualized in 2D for each galaxy in Panel (c) of Figures 2 to 22.
We present the fit data in Tables 6 to 26, where the errors given are the formal errors from the fit. In these tables Column (1) is the row number of the portion of the spectrum fitted. Column (2) shows the offset along the slit direction in arcseconds from the row with the greatest integrated flux. Columns (3) and (4) give the radial velocities () and gas velocity dispersions () respectively. Column (5) gives the line flux of the H line and columns (6) and (7) show its ratio against the fluxes of the [N II]6585 and [S II]total (the total flux of the two [S II] lines) respectively. Column (8) gives the reduced () value of the resulting fit.
We repeated the fit for the central row of the galaxy NGC 4335 varying the set of free parameters in order to estimate the reliability of the fits that we had used. We found that the fit was stable to within one formal error on all quoted parameters when the velocities, velocity dispersions and fluxes of all parameters were fit independently. The signal to noise falls off rapidly outside of the very nuclear regions so it is not possible to consistently run fits with a large number of free parameters. The results for the nucleus of NGC 4335 satisfy us that we are justified in fixing the parameters in the manner that we have chosen, without adding any obvious biases to our results.
4.2 Fits with an additional free component
In many cases, as the very central pixels are reached the fit begins to do a poorer job of matching the observed profile. In an attempt to improve the fit to the narrow centers of the lines we tested a fit for the central spectrum of each galaxy including an additional fit component with independent velocity, velocity dispersion and flux, along with the original set of five Gaussians. The fits to the central spectra are shown in Panel (d) of Figures 2 to 22 (see key in Figure 1), (i) excluding and (ii) including the additional component.
We assessed the effectiveness of including this component in each galaxy based on (1) an improvement in the mean of the absolute value of the residuals from the fit (2) an improvement in the reduced value of the fit such that and (3) an improvement judged by eye in the fit compared to the data. We assigned a score to each galaxy, with one point available for each of the three categories. We consider scores of 2 or 3 to be indicative of the presence of a broad component, a score of 1 indicates the possibility of a broad component, while we treat a score of 0 as a none detection. The three parameters and scores are listed in Table 28.
We find an additional free component improves the fit in 62% (N = 13) of the sample galaxies. In the cases of NGC 2329 and NGC 3862 the component appears to represent a non-flat continuum. The kinematic parameters for each galaxy including the additional free component are listed in Table 29 and the flux parameters in Table 30. We present further interpretation of the nature and origin of the features fit by the additional free component in §5.3.
4.3 Quantifying error sources
The STIS data handbook (Brown, et al., 2002) gives the following absolute and relative accuracies applicable to this work: A wavelength absolute calibration error ( offset) of 0.1 to 0.3 pixels (2.6 to 7.7 at 6500Å) within an exposure, and from 0.2 to 0.5 pixels (5.1 to 12.8 at 6500Å) between exposures. An absolute photometry error of 5% and a relative photometry error of 2% within a single exposure assuming a wide slit observation. 5 variations in slit width along the slit lengths could result in variations of up to 20% in flux along the 01 slit.
In Verdoes Kleijn, et al. (2002) H + [N II] fluxes were presented for each nucleus in the sample. The values presented there agree well with the values we find here, certainly given our limited ability to extract comparable apertures and within the 20% potential flux errors noted above.
In Section 1 we indicated that a 1.3 error could be incorporated into the final data as a result of shifting the spectra for image combination and cosmic ray rejection. This shift is insignificant compared to other error sources.
In Table 27 we showed that by allowing different free parameters within the single-Gaussian-per-line fit produced changes in the measurement in velocity of and of in velocity dispersion for the nucleus of NGC 4335.
In Table 33 we show the effect on the measured velocities and velocity dispersions of the various components for each of the models described in the previous section, again for the case of NGC 4335. This illustrates that the measured velocities of the narrow lines may vary by up to (and velocity dispersions by as much as ) when additional components in the line shape are taken into account.
In the nuclei of NGC 383 and NGC 4335 (representing cases with blended and less blended lines respectively) we repeated the narrow line fit to the central spectrum with 286 different combinations of input velocity and velocity dispersion; varying the velocities over a range of 2000 and the velocity dispersions over a range of 6000 . In the case of NGC 4335 we found that the velocity varied by and the velocity dispersion by just . In the case of NGC 383 we found that the velocity varied by and the velocity dispersion by just . There was a systematic effect relating input and output velocities in both cases.
We conclude that reasonable estimates of the genuine errors on each of our measured parameters are: 5% - 10% on fluxes (dominated by the effects of variations along the narrow slits and the STIS absolute calibration); and on velocities and velocity dispersions (dominated by the fit model dependency of the results).
4.4 Individual source descriptions
Below, we give descriptions of each member of the UGC FR-I sample in turn. The galaxy classifications are taken from the NASA Extragalactic Database, which lists references in which the terms used are described. Descriptions of dust properties and radio sources are as presented by Verdoes Kleijn, et al. (1999) and Xu, et al. (2000) respectively.
NGC 193 (UGC 408)
This S0 galaxy has a complex gas morphology with two lanes apparent in the central regions (the most clearly defined lane has a ). It has a core-jet radio morphology on VLA and VLBA scales. The STIS slits were aligned parallel to the galaxy major axis. The central kinematic and flux properties are listed in Table 6; the gas does not exhibit a regular rotation curve, though it does appear dominated by systematic rather than random motions. The fit to the central spectrum is improved by the addition of a broad component. Data for this galaxy are shown in Figure 2 (see key in Figure 1 for an explanation of these plots).
NGC 315 (UGC 597)
This elliptical galaxy has a nuclear dust disk . It has a core-jet radio morphology on VLA and VLBA scales. The STIS slits were aligned parallel to the galaxy major axis. The central kinematic and flux properties are listed in Table 7; the gas appears to be in organized motion, possibly regular rotation. The fit to the central spectrum is improved by the addition of a broad component. Data for this galaxy are shown in Figure 3 (see key in Figure 1 for an explanation of these plots).
NGC 383 (UGC 689)
This S0 galaxy has a nuclear dust disk . It has a core-jet radio morphology on VLBA scales, and a twin-jet morphology on VLA scales. The STIS slits were aligned parallel to the galaxy major axis. The central kinematic and flux properties are listed in Table 8; the gas exhibits a regular rotation profile. In the negative offset side slit there is a dip in the velocity dispersion profile at a position close to the nucleus. The fit to the central spectrum is improved by the addition of a broad component. Data for this galaxy are shown in Figure 4 (see key in Figure 1 for an explanation of these plots).
NGC 541 (UGC 1004)
This cD S0 galaxy has a nuclear dust disk . It has a radio core on VLBA scales and a core-jet morphology on VLA scales. The STIS slits were aligned to a mean of the position angles of the central isophotes measured from our WFPC/2 images, which vary considerably. We allowed considerable flexibility in position angle to enable reasonable observing windows. The central kinematic and flux properties are listed in Table 9; the gas does not exhibit a regular rotation profile. The fit to the central spectrum is not significantly improved by the addition of a broad component, though the fit improves somewhat when judged by eye. Data for this galaxy are shown in Figure 5 (see key in Figure 1 for an explanation of these plots).
NGC 741 (UGC 1413)
This E0 galaxy has no apparent nuclear dust. It has a radio core on VLBA scales and a core-jet morphology on VLA scales. The STIS slits were aligned approximately parallel to the galaxy major axis, however a certain degree of freedom was allowed in slit placement to allow reasonable observing windows. The central kinematic and flux properties are listed in Table 10. Very few points had sufficient signal to noise to obtain good fits in these data, it has not been included in further analysis of global kinematic properties. The fit to the central spectrum is not improved by the addition of a broad component. Data for this galaxy are shown in Figure 6 (see key in Figure 1 for an explanation of these plots).
UGC 1841
This elliptical galaxy has a nuclear dust disk . It has a core-jet radio morphology on VLBA and VLA scales. The STIS slits were aligned parallel to the galaxy major axis. The central kinematic and flux properties are listed in Table 11; the gas does not exhibit a regular rotation profile. The fit to the central spectrum is improved by the addition of a broad component. Data for this galaxy are shown in Figure 7 (see key in Figure 1 for an explanation of these plots).
NGC 2329 (UGC 3695)
This S0 galaxy has a nuclear dust disk . It has a core-jet radio morphology on VLBA and VLA scales. The STIS slits were aligned parallel to the galaxy major axis. The central kinematic and flux properties are listed in Table 12; the gas does not exhibit a regular rotation profile. The fit to the central spectrum is improved by the addition of a broad component which appears to represent a non-flat continuum in this case. Data for this galaxy are shown in Figure 8 (see key in Figure 1 for an explanation of these plots).
NGC 2892 (UGC 5073)
This elliptical galaxy has no apparent nuclear dust. It has a radio core on VLBA scales and a twin-jet morphology on VLA scales. The STIS slits were aligned approximately parallel to the galaxy major axis, however a certain degree of freedom was allowed in slit placement to allow reasonable observing windows. The central kinematic and flux properties are listed in Table 13; the gas does not exhibit a regular rotation profile. The fit to the central spectrum is not significantly improved by the addition of a broad component. Data for this galaxy are shown in Figure 9 (see key in Figure 1 for an explanation of these plots).
NGC 3801 (UGC 6635)
This S0/a galaxy has a complex nuclear dust morphology with a large scale dust lane . It has a twin-jet radio morphology on VLA scales. The STIS slits were aligned parallel to the galaxy major axis. The central kinematic and flux properties are listed in Table 14; the gas does not exhibit a regular rotation profile. The fit to the central spectrum is not significantly improved by the addition of a broad component. Data for this galaxy are shown in Figure 10 (see key in Figure 1 for an explanation of these plots).
NGC 3862 (UGC 6723)
This elliptical galaxy has a nuclear dust disk . It has a core-jet radio morphology on VLBA and VLA scales. The STIS slits were aligned approximately perpendicular to the radio jet as the nuclear isophotal position angles are poorly constrained. The central kinematic and flux properties are listed in Table 15; the gas does not exhibit a regular rotation profile. The fit to the central spectrum is improved by the addition of a broad component which appears to represent a non-flat continuum in this case. Data for this galaxy are shown in Figure 11 (see key in Figure 1 for an explanation of these plots).
UGC 7115
This elliptical galaxy has a nuclear dust disk . It has a core-jet radio morphology on VLA scales. The STIS slit were aligned approximately perpendicular to the radio jet as the nuclear isophotal position angles are poorly constrained, a certain degree of freedom was allowed in slit placement to allow reasonable observing windows. This galaxy was observed in only one slit position, as we also required WFPC2 observations of this target in order to measure the central photometric properties (see Verdoes Kleijn, et al., 2002). The central kinematic and flux properties are listed in Table 16; the gas exhibits a regular rotation profile. The fit to the central spectrum is not significantly improved by the addition of a broad component. Data for this galaxy are shown in Figure 12 (see key in Figure 1 for an explanation of these plots).
NGC 4261 (UGC 7360)
This E2-3 galaxy has a nuclear dust disk . It has a twin-jet radio morphology on VLBA and VLA scales. The STIS slits were aligned parallel to the galaxy major axis. The central kinematic and flux properties are listed in Table 17. The nucleus of this galaxy lies closer to one of the side slits (slit one) than the central position, however it is still possible to see a clear rotation curve along that slit. The fit to the central spectrum is improved by the addition of a broad component. Data for this galaxy are shown in Figure 13 (see key in Figure 1 for an explanation of these plots).
NGC 4335 (UGC 7455)
This elliptical galaxy has a nuclear dust disk . It has a radio core on VLBA scales and a twin-jet morphology on VLA scales. The STIS slits were aligned parallel to the galaxy major axis. The central kinematic and flux properties are listed in Table 18; the gas exhibits a regular rotation profile. In the positive offset side slit there is a dip in the velocity dispersion profile at the position closest to the nucleus. See also Verdoes Kleijn, et al. (2002). The fit to the central spectrum is improved by the addition of a broad component. Data for this galaxy are shown in Figure 14 (see key in Figure 1 for an explanation of these plots).
NGC 4374 (M84; UGC 7494)
This E1 galaxy has a nuclear dust lane . It has a core-jet radio morphology on VLBA scales, and a twin-jet morphology on VLA scales. The STIS slits were aligned approximately perpendicular to the radio jets, which lies close to the major axis of the emission line gas. The central kinematic and flux properties are listed in Table 19; the gas exhibits a regular rotation profile. See also Bower, et al. (1998). The fit to the central spectrum is not significantly improved the addition of a broad component. Data for this galaxy are shown in Figure 15 (see key in Figure 1 for an explanation of these plots).
NGC 4486 (M87; UGC 7654)
This elliptical galaxy has an irregular nuclear dust morphology. It has a core-jet radio morphology on VLBA and VLA scales. The STIS slits were aligned to trace morphological features in the emission line gas across the nuclear region of this galaxy. The central kinematic and flux properties are listed in Table 20; the gas exhibits a regular rotation profile. The fit to the central spectrum is improved by the addition of a broad component. Data for this galaxy are shown in Figure 16 (see key in Figure 1 for an explanation of these plots).
NGC 5127 (UGC 8419)
This elliptical peculiar galaxy has a nuclear dust lane . It has a radio core on VLBA scales and a twin-jet morphology on VLA scales. The STIS slits were aligned parallel to the galaxy major axis. The central kinematic and flux properties are listed in Table 21; the gas exhibits a regular rotation profile. The fit to the central spectrum is not significantly improved by the addition of a broad component. Data for this galaxy are shown in Figure 17 (see key in Figure 1 for an explanation of these plots).
NGC 5141 (UGC 8433)
This S0 galaxy has a nuclear dust lane . It has a core-jet radio morphology on VLBA scales and a twin-jet morphology on VLA scales. The STIS slits were aligned parallel to the galaxy major axis. The central kinematic and flux properties are listed in Table 22; the gas exhibits a regular rotation profile. The fit to the central spectrum is improved by the addition of a broad component. Data for this galaxy are shown in Figure 18 (see key in Figure 1 for an explanation of these plots).
NGC 5490 (UGC 9058)
This elliptical galaxy has a nuclear dust lane . It has a core-jet radio morphology on VLBA scales and a twin-jet morphology on VLA scales. The STIS slits were aligned parallel to the galaxy major axis. The central kinematic and flux properties are listed in Table 23; the gas does not exhibit a regular rotation profile. The fit to the central spectrum is improved by the addition of a broad component. Data for this galaxy are shown in Figure 19 (see key in Figure 1 for an explanation of these plots).
NGC 7052 (UGC 11718)
This elliptical galaxy has a nuclear dust disk . It has a twin-jet radio morphology on VLBA scales and a core-jet morphology on VLA scales. The STIS slits were aligned parallel to the galaxy major axis. The central kinematic and flux properties are listed in Table 24; the gas exhibits a regular rotation profile. The fit to the central spectrum is not significantly improved by the addition of a broad component. Data for this galaxy are shown in Figure 20 (see key in Figure 1 for an explanation of these plots).
UGC 12064
This S0 galaxy has a nuclear dust disk . It has a twin-jet radio morphology on VLA scales. The STIS slits were aligned parallel to the dust disk major axis. The central kinematic and flux properties are listed in Table 25; the gas exhibits a regular rotation profile. The fit to the central spectrum is improved by the addition of a broad component. Data for this galaxy are shown in Figure 21 (see key in Figure 1 for an explanation of these plots).
NGC 7626 (UGC 12531)
This elliptical peculiar galaxy has a nuclear dust lane . It has a core-jet radio morphology on VLBA scales and a twin-jet morphology on VLA scales. The STIS slits were aligned parallel to the galaxy major axis. The central kinematic and flux properties are listed in Table 26; the gas exhibits a regular rotation profile. The fit to the central spectrum is improved by the addition of a broad component. Data for this galaxy are shown in Figure 22 (see key in Figure 1 for an explanation of these plots).
5 Interpretation and Discussion
In our initial interpretation we have focussed on understanding the general parameters of the data set. We will undertake more detailed analyses in future work that we outline in §6 below. Here, we first describe the categorization of sources as rotating and non-rotating systems based on the observed kinematics (§5.1). We then discuss the ionization states of the nuclear regions (§5.2). We go on to discuss the presence of broad components in these nuclei and a more detailed analysis of the line shapes (§5.3).
5.1 Rotators and non-rotators
By inspecting maps of the central kinematics and the velocity profiles along each slit (as presented above in figures 2 to 22), we have classified, by eye, the galaxies into two classes: rotators and non-rotators. Rotators are systems where we see patterns reminiscent of rotation curves; in non-rotators we find no such patterns - the kinematics seem either irregular or organized in some manner that does not represent regular rotation. We do not include NGC 741 in discussions of kinematics as very few points were well fit during our analysis. We classify 67% (N = 14/21) of the UGC FR-I galaxies as rotators. 73% of galaxies with dust disks (N = 8/11), 100% of galaxies with dust lanes (N = 5/5) and 50% of galaxies with complex dust or no dust (N = 2/4) are rotators.
We have made use of the mean velocity dispersion
| (6) |
and the difference in mean velocities on each side of the nucleus
| (7) |
within of the brightest pixel as illustrative of the global kinematic parameters along the central slit333For NGC 4261 we used the offset slit closest to the nucleus as explained above.. These parameters are shown in Table 31 for each galaxy, along with the mean properties for each class of galaxy. In Figure 23 we show the relationship between the two parameters for each galaxy. It is clear that the non-rotators lie at the bottom of the distribution, so it is conceivable that irregular motions conceal any remaining signs of rotation in these cases. We note that we detect rotation in all cases where the disk is from face on, other than those cases where the dust morphology is highly irregular. The only exception is NGC 5490 where the signal to noise was particularly poor.
In Figure 24 we show the values of plotted as a function of dust disk axis ratio, or dust lane width to length ratio; if the dust were all in circular disks this would be an indicator of disk inclination. We included lines showing an indication of the projection of several values of at different disk inclinations through the relation
| (8) |
Where is the observed parameter at a given inclination, is the presumed intrinsic rotation of the disk and b/a is the axis (or width:length) ratio. This is not a rigorously valid means of projecting these values, but it serves our purposes of illustration here.
It is easy to see that the non-rotators with face on disks would have to be intrinsically rotating very fast for their rotation to register over the random motions in these cases. From the observations of systems at greater inclinations we have no cause to expect any disks to be rotating that fast. In a similar manner we plot the values of against dust disk axis ratio, or dust lane width to length ratio in Figure 25. Here we see no clear trend in velocity dispersion with axis ratio.
We find no significant systematic differences between the typical values between the two classes. Using the Kolmogorov-Smirnov Test to assess the two groups we find a probability of 0.93 that the distributions of velocity dispersions were drawn from the same underlying distribution. Applying the same test to the parameter gives only a 0.08 probability that these were drawn from the same distribution.
This evidence suggests to us that rotators and non-rotators represent the same type of kinematic systems, with observational effects such as inclination and dust properties limiting our ability to detect the rotation of those systems where we do not. We conclude that a model of a rotating gas disk with significant random motions is compatible with all of the observations.
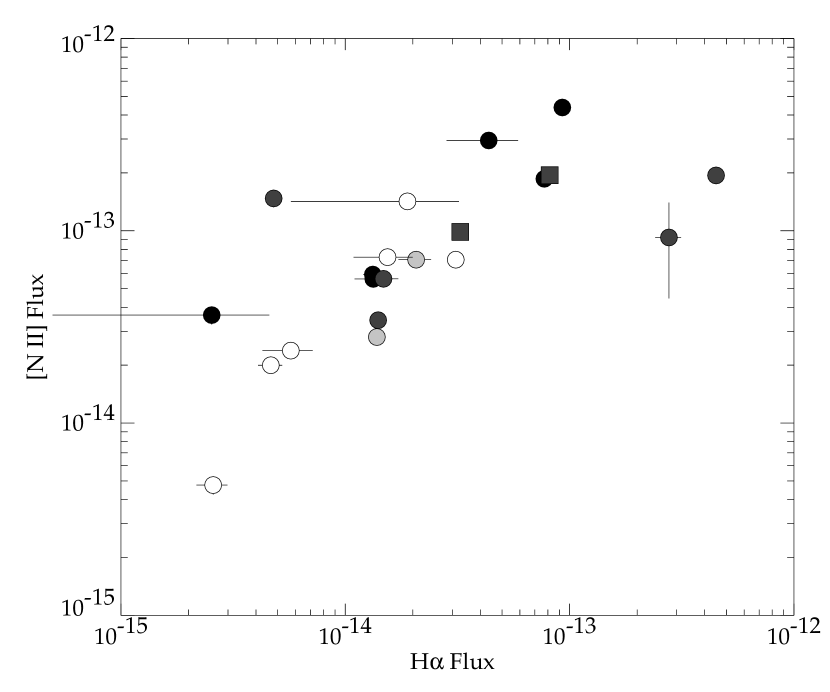
5.2 Flux ratios and ionization
In Figure 26 we show the [N II] flux as a function of H narrow line flux for each central spectrum. The values are compatible with values typically found for photo-ionization and shock models (see, for example, Dopita, et al., 1997). The unusually low ratios shown in two nuclei (NGC 383 and M84) are likely a consequence of the high degree of blending of the lines in these observations (see panel (d) of Figures 4 and 15), rather than any underlying physics.
While we are satisfied that our data have not produced any results that are incompatible with reasonable parameters, detailed modeling is required to understand the various ionization mechanisms at work in each individual case. We intend to undertake this type of modeling and present the outcomes in future work.
5.3 Are we observing broad lines?
The fit to the central spectrum is improved in 62% of the galaxies by the inclusion of an additional free Gaussian component (see §4.2). Each of these fits resulted in the supplementary component being centered redwards of the H line with a velocity dispersion between about two and ten times that of the narrow lines; thus we describe this feature as a broad fit component. We identify these broad components in 73% of galaxies with dust disks (N=8/11), 60% of galaxies with dust lanes (N=3/5), 67% of galaxies with irregular dust (N=2/3) and 0% of galaxies with no dust (N=0/2).
If we make a flux cut in H we find broad components in 40% of nuclei with , in 55% of nuclei with and in 100% of nuclei with . This detection trend with flux is reflected in Figure 26. This suggests that the detection of nuclear broad components is somewhat flux (and therefore signal to noise) dependent across the sample.
The broad components could originate either as an artifact of attempting to fit Gaussians to non-Gaussian line profiles, or from a physical source – such as a broad line region or a change in the characteristics of the gas as the inner regions of the disk are approached.
We detect broad components only in the central few pixels, this could be a consequence of either the fall in signal to noise or that the component is an unresolved source. It is important to note as a consequence of this, that fitting single Gaussians to each line samples a different part of the line shape as the central pixels are approached.
In Table STIS spectroscopy of the emission line gas in the nuclei of nearby FR-I galaxies11affiliation: Based on observations with the NASA/ESA Hubble Space Telescope, obtained at the Space Telescope Science Institute, which is operated by the Association of Universities for Research in Astronomy, Inc., under NASA contract NAS 5-26555 we show the mean properties of the broad components and compare them to the samples of LINERS by Ho, et al. (1997) and Radio Galaxies summarized by Sulentic, et al. (2000). These comparisons show that our broad components are compatible with the broad lines seen in LINERs and that the observed offsets from the narrow line components are compatible with those observed in samples of radio loud galaxies.
5.4 Constraining the line shapes
In order to better establish the line shape, we investigated the profiles from the nucleus of NGC 4335, which has a relatively good signal to noise and relatively non-blended lines (Verdoes Kleijn, et al., 2002).
We first investigated the profile of the two [S II] lines, as they are less entangled than the H + [N II] complex. We fit these two lines with a varying number of Gaussians per line. The minimum in the reduced parameter resulting from each of these fits lay between two and three Gaussians per line. We extended the two Gaussian per line model to fit the entire profile of the five emission lines. By then testing various sets of free parameters we were able to discover an optimal set.
Fitting these models quickly illustrated that the additional broad component is a very strongly favored feature; in any case where it was possible for the parameters to contrive to create a broad component they did so. Table 33 shows the kinematic parameters and reduced values from five combinations of fit parameters that produce distinct fits. These were:
-
1.
Narrow lines only: The original 5 Gaussian model (one Gaussian for each of the following 5 lines: [N II]6550, H, [N II]6585, [S II]6718, [S II]6733), with a single value of velocity and velocity dispersion for all lines.
-
2.
Additional broad component: The same as the Narrow lines only model, with an additional broad component, with an independent velocity, velocity dispersion and flux.
-
3.
Flux-constrained Broad Bases (i): The same as model 2, with an additional set of 5 Gaussians, representing the broader wings (Broad Bases). This new set of lines had a single velocity and velocity dispersion and the velocity was fixed to be the same as for the other lines. The fluxes of each line in the second set of Gaussians was fixed at a constant ratio to its counterpart in the first set, based on the mean ratio measured in the fit of two Gaussians per line to the two [S II] lines as described above.
-
4.
Flux-constrained Broad Bases (ii): The same as model 3, however in this case the velocity of the set of broad bases was allowed to vary from that of the narrow lines.
-
5.
Flux-unconstrained Broad Bases: the same as model 3, however in this case the lines in both sets were able to vary independently in flux, other than the fixed 1:3 ratio between the two [N II] lines in each set.
We conclude, as the Flux-constrained Broad Bases (ii) model not only produces the most satisfying fit judged by eye, but also the lowest reduced value, that this model is likely to most closely represent the line profile present in the central regions. The broad bases in this case are able to represent an asymmetric red wing on each line, but they do not reduce the importance of the broad component in the fit.
6 Conclusions
In this paper we presented the medium resolution spectra of the 21 galaxies in our UGC FR-I sample, obtained by ourselves and others using STIS. Data were obtained for three parallel slit positions on each nucleus (other than UGC 7115, which was observed in only one slit position).
We find that all nuclei are compatible with a single kinematic description: a rotating gas disk, where random motions are always important. We observe patterns reminiscent of rotation in 67% of the nuclei, in the remainder the non-detection can be accounted for as the systems are either face on, have complex central morphologies (as judged from the nuclear dust distribution) or, in the case of NGC 5490, particularly poor signal to noise.
We find that the inclusion of an additional fit component with unconstrained parameters improves our fit to the nuclear spectrum in 62% of the galaxies, where it fits in every case as a broad component in the vicinity of H and [N II]. The detection of the broad component is related to the line flux (and therefore the signal to noise). The broad components have a mean velocity dispersion of and are redshifted from the narrow line components (assuming an origin in H) by .
The broad component could be a consequence of non-Gaussian line profiles with broad wings, which would be biased toward the brightest [N II] line (redwards of ). However, our more detailed analysis of line shape shows that it is very hard to reproduce this effect by including broad (even asymmetric) wings on each line, suggesting the broad component may indeed have a physical origin.
The measured H to [N II] ratios for the narrow components in the central spectra are consistent with standard photo-ionization or shock-ionization models (for example, Dopita, et al., 1997) other than two examples where the lines are highly blended and may be leading us to misleading fits in the very center.
As we continue with this research we will next model the galaxies with thin disks and with spherical gas distributions (see, for example, Verdoes Kleijn, et al., 2002) in order to obtain estimates of the black hole masses for each galaxy in this complete sample. We will also extend our investigation into the ionization profiles of each nucleus; investigating the ionization properties of each nucleus and seeking the signs of jet / disk interactions.
References
- Barth, et al. (2001) Barth, A. J., Sarzi, M. R., Rix, H.-W., Ho, L. C., Filippenko, A. V., & Sargent, W. L. W. 2001, ApJ, 555, 685
- Bower, et al. (1998) Bower, G. A. et al. 1998, ApJ, 492, L111
- Brown, et al. (2002) Brown, T. et al. 2002, in HST STIS Data Handbook, version 4.0, ed. B. Mobasher, Baltimore, STScI
- Condon & Broderick (1988) Condon, J. J., Broderick, J. J. 1988, AJ, 96, 30
- Davies, et al. (1987) Davies, R. L., et al. 1987, ApJS, 64, 581
- Di Nella, et al. (1995) Di Nella H., Garcia A.M., Garnier R., & Paturel G. 1995, A&AS, 113, 151
- Dopita, et al. (1997) Doptia, M. A., Koratkar, A. P., Allen, M. G., Tsvetanov, Z. I., Ford, H. C., Bicknell, G. V., & Sutherland, R. S. 1997, ApJ, 490, 202
- Fanaroff & Riley (1974) Fanaroff, B. L., & Riley, J. M. 1974, MNRAS, 167, 31P
- Ferrarese, Ford, & Jaffe (1996) Ferrarese, L., Ford, H. C., & Jaffe, W. 1996, ApJ, 470, 444
- Ferrarese & Ford (1999) Ferrarese, L. C., & Ford, H. C. 1999, ApJ, 515, 583
- Ferrarese & Merritt (2000) Ferrarese, L., & Merritt, D. 2000, ApJ, 539, 9
- Gebhardt, et al. (2000) Gebhardt, K., et al. 2000, ApJ, 539, 13
- Goudfrooij, et al. (1994) Goudfrooij, P., Hansen, L., Jørgensen, H. E., & Nørgaard-Nielsen, H. U. 1994, A&AS, 105, 341
- Hardcastle, et al. (1998) Hardcastle, M. J., Alexander, P., Pooley, G. G., Riley, J. M. 1998, MNRAS, 296, 445
- Harms, et al. (1994) Harms, R. J., et al. 1994, ApJ, 435, 35
- Heckman, et al. (1983) Heckman, T. M., Van Breugel, W., Miley, G. K., Butcher, H. R. 1983, AJ, 88, 1077
- Ho, et al. (1997) Ho, L. C., Filippenko, A. V., Sargent, W. L. W., & Peng, C. Y. 1997, ApJS, 112, 391
- Jørgensen, Franx & Kjærgaard (1995) Jørgensen, I., Franx, M., & Kjærgaard, P. 1995, MNRAS, 276, 1341
- Kimble, et al. (1998) Kimble, R., et al. 1998, ApJ, 539, 13
- Kormendy & Richstone (1995) Kormendy, J., & Richstone, D. 1995, ARA&A, 33, 581
- Machetto, et al. (1997) Macchetto, F., et al. 1997, ApJ, 489, 579
- Maciejewski & Binney (2001) Maciejewski, W., Binney, J. 2001, MNRAS, 323, 831
- Merritt & Ferrarese (2001) Merritt, D., & Ferrarese, L. 2001, ApJ, 547, 140
- Nilson (1973) Nilson, P. 1973, The Uppsala General Catalogue of Galaxies [UGC], (Uppsala: Astronomiska Observatorium)
- Osterbrock (1989) Osterbrock, D. E. 1989, Astrophysics of gaseous nebulae and active galactic nuclei, (Mill Valley, CA: University Science Books)
- Philips, et al. (1986) Philips, M. M., Jenkins, C. R., Dopita, M. A., Sadler, E. M., & Binette, L. 1986, AJ, 91, 1062
- Press, et al. (1992) Press, W. H., Teukolsky, S. A., Vetterling, W. T., Flannery, B. P. 1992, Numerical Recipies in Fortran, 2nd Edition (Cambridge: Cambridge University Press)
- Reader & Corliss (1998) Reader, J., & Corliss, C. H., Eds. 1998, CRC Handbook of Chemistry and Physics, 79th Edition, (Boca Raton, FL: CRC)
- Rees (1984) Rees, M. 1984, ARA&A, 22, 471
- Sarzi, et al. (2001) Sarzi, M., Rix, H.-W., Shields, J. C., Rudnick, G., Ho, L. C., McIntosh, D. H., Filippenko, A. V., & Sargent, W. L. W. 2001, ApJ, 550, 65
- Shaw & Hodge (1998) Shaw, D., & Hodge, P. 1998, STIS Instrument Science Report 98-22, (Baltimore, MD: Space Telescope Science Institute)
- Sulentic, et al. (2000) Sulentic, J. W., Marziani, P., & Dultzin-Hacyan, D. 2000, ARA&A, 38, 521
- Tonry & Davis (1981) Tonry J.L., & Davis M. 1981, ApJ, 246, 666
- Tran, et al. (2001) Tran, H. D., Tsvetanov, Z., Ford, H. C., Davies, J., Jaffe, W., van den Bosch, F. C., & Rest, A. 2001, AJ, 121, 2928
- Tremaine, et al. (2002) Tremaine, S., et al. 2002, ApJ, 574, 740
- Xu, et al. (2000) Xu, C., Baum, S. A., O’Dea, C. P., Wrobel, J. M., & Condon, J. J. 2000, AJ, 120, 2950
- van der Marel & van den Bosch (1998) van der Marel, R. P., & van den Bosch, F. C. 1998, AJ, 116, 2220
- van Dokkum & Franx (1995) van Dokkum, P. G., & Franx, M. 1995, AJ, 110, 2027
- Verdoes Kleijn, et al. (1999) Verdoes Kleijn, G. A., Baum, S. A., de Zeeuw, P. T., & O’Dea, C. P. 1999, AJ, 118, 2592
- Verdoes Kleijn, et al. (2000) Verdoes Kleijn, G. A., van der Marel, R. P., Carollo, C. M., & de Zeeuw, P. T. 2000, AJ, 120, 1221
- Verdoes Kleijn, et al. (2002) Verdoes Kleijn, G. A., Baum, S. A., de Zeeuw, P. T., & O’Dea, C. P. 2002, AJ, 123, 1334
- Verdoes Kleijn, et al. (2002) Verdoes Kleijn, G. A., van der Marel, R. P., de Zeuww, P. T., Noel-Storr, J., & Baum, S. A. 2002, AJ, 124, 2524
- Wagner, Bender & Möllenhoff (1988) Wagner, S. J., Bender, R., Möllenhof, C. 1988, A&A, 195, L5
- Wallerstein, et al. (2001) Wallerstein, G., Gilroy, K. K., Zethson, T., Johansson, S., & Hamann, F. 2001, PASP, 113, 1210


| NGC | UGC | Other Names | Type | vsys | STIS Scale | Axis Ratio | ||
|---|---|---|---|---|---|---|---|---|
| (km s-1) | () | (mag) | (W Hz-1) | b/a | ||||
| (1) | (2) | (3) | (4) | (5) | (6) | (7) | (8) | (9) |
| 193 | 408 | E-S0 | 4342.5 | 15.0 | -21.0 | 23.93 | (0.18) | |
| 315 | 597 | E | 5092.5 | 17.6 | -22.6 | 24.10 | 0.23 | |
| 383 | 689 | 3C 31 | E-S0 | 4890.0 | 16.9 | -22.2 | 24.51 | 0.77 |
| 541 | 1004 | E | 5497.5 | 19.0 | -21.7 | 23.94 | 0.91 | |
| 741 | 1413 | E | 5265.0 | 18.2 | -22.6 | 23.85 | ||
| 1841 | 3C 66B | E | 6360.0 | 22.0 | -22.5 | 24.94 | ||
| 2329 | 3695 | E-S0 | 5725.0 | 19.8 | -21.9 | 23.76 | 0.68 | |
| 2892 | 5073 | E | 6810.0 | 23.6 | -21.1 | 23.36 | ||
| 3801 | 6635 | S0 | 3255.0 | 11.3 | -20.8 | 23.49 | (0.12) | |
| 3862 | 6723 | 3C 264 | E | 6330.0 | 21.9 | -21.7 | 24.75 | |
| 7115 | E | 6787.5 | 23.5 | -21.0 | 23.94 | |||
| 4261 | 7360 | 3C 270 | E | 2212.5 | 7.7 | -21.5 | 24.40 | 0.46 |
| 4335 | 7455 | E-S0 | 4672.5 | 16.2 | -21.6 | 23.11 | 0.41 | |
| 4374 | 7494 | M84, 3C 272.1 | S0 | 1155.0 | 4.0 | -20.9 | 23.35 | (0.15) |
| 4486 | 7654 | M87, 3C 274 | E | 1155.0 | 4.0 | -22.2 | 24.90 | |
| 5127 | 8419 | E | 4830.0 | 16.7 | -21.3 | 24.08 | (0.25) | |
| 5141 | 8433 | S0 | 5302.5 | 18.4 | -21.0 | 23.80 | (0.25) | |
| 5490 | 9058 | E | 5790.0 | 20.1 | -21.7 | 23.79 | (0.35) | |
| 7052 | 11718 | E | 4155.0 | 14.4 | -21.0 | 23.04 | 0.30 | |
| 12064 | 3C 449 | E-S0 | 5122.5 | 17.7 | -20.8 | 24.38 | 0.54 | |
| 7626 | 12531 | E | 3495.0 | 12.1 | -21.7 | 23.37 | (0.17) |
Note. — Col. (1): NGC number where available; Col. (2): Upsalla General Catalog (UGC) number; Col. (3): Alternative names; Col. (4): From the NASA Extragalactic Database (NED); Col. (5): Measured from the stellar kinematics (from NED); Col. (6): Parsecs per unbinned STIS pixel; Col. (7): Absolute blue magnitude from Condon & Broderick (1988); Col. (8): Radio Luminosity from Condon & Broderick (1988); Col. (9): Dust disk axis ratio from Verdoes Kleijn, et al. (1999), numbers in parentheses indicate a dust lane where the width:length ratio is given instead. All physical parameters assume
| Galaxy | Visit ID | Aperture | Offsets | Exposure times | Brightest Row |
|---|---|---|---|---|---|
| (″) | (seconds) | ||||
| (1) | (2) | (3) | (4) | (5) | (6) |
| NGC 193 | o5ee01 | 52x0.2 | -0.20, 0.00, +0.20 | 1700, 1300, 1560 | 300 |
| NGC 315 | o5ee02 | 52x0.1 | -0.10, 0.00, +0.10 | 1082, 1000, 1098 | 598 |
| NGC 383 | o5ee03 | 52x0.1 | -0.10, 0.00, +0.10 | 1082, 1000, 1098 | 599 |
| NGC 541 | o5ee04 | 52x0.2 | -0.20, 0.00, +0.20 | 1442, 1300, 1500 | 300 |
| NGC 741 | o5ee05 | 52x0.2 | -0.20, 0.00, +0.20 | 1667, 1145, 1500 | 300 |
| UGC 1841 | o5ee06 | 52x0.2 | -0.20, 0.00, +0.20 | 1870, 1300, 1560 | 300 |
| NGC 2329 | o5ee07 | 52x0.2 | -0.20, 0.00, +0.20 | 1967, 1245, 1560 | 300 |
| NGC 2892 | o5ee09 | 52x0.2 | -0.20, 0.00, +0.20 | 2037, 1300, 1560 | 299 |
| NGC 3801 | o5ee10 | 52x0.2 | -0.20, 0.00, +0.20 | 1699, 1292, 1560 | 305 |
| NGC 3862 | o5ee11 | 52x0.2 | -0.20, 0.00, +0.20 | 900, 731, 1066 | 300 |
| UGC 7115 | o5ee22 | 52x0.2 | 0.00 | 2058 | 299 |
| NGC 4261 | o5ee12 | 52x0.1 | -0.10, 0.00, +0.10 | 994, 1000, 1000 | 601 |
| NGC 4335 | o5ee13 | 52x0.2 | -0.20, 0.00, +0.20 | 2154, 1300, 1560 | 300 |
| NGC 4374 | o3wn01 | 52x0.2 | -0.20, 0.00, +0.20 | 2245, 2600, 2600 | 600 |
| NGC 4486 | o67z01/2 | 52x0.2 | -0.20, 0.00, +0.20 | 1708, 1380, 1708 | 601 |
| NGC 5127 | o5ee15 | 52x0.2 | -0.20, 0.00, +0.20 | 1660, 1000, 1500 | 303 |
| NGC 5141 | o5ee16 | 52x0.2 | -0.20, 0.00, +0.20 | 1968, 1300, 1560 | 300 |
| NGC 5490 | o5ee17 | 52x0.2 | -0.20, 0.00, +0.20 | 1590, 1300, 1560 | 299 |
| NGC 7052 | o5ee18 | 52x0.1 | -0.10, 0.00, +0.10 | 1747, 1300, 1500 | 600 |
| UGC 12064 | o5ee20 | 52x0.1 | -0.10, 0.00, +0.10 | 1532, 1000, 1500 | 599 |
| NGC 7626 | o5ee19 | 52x0.2 | -0.20, 0.00, +0.20 | 1905, 1263, 1560 | 300 |
Note. — Col. (1): NGC/UGC Number; Col. (2): Root name for the HST visit and data sets; Col. (3): HST/STIS aperture used; Col. (4): Slit positions with offsets perpendicular to the slit direction, given relative to the central slit position. UGC 7115 was observed in only one position. Further data not included here is available for NGC 4374 (M84) and NGC 4486 (M87); Col. (5): Exposure times in each offset position. For each position two observations were obtained separated by 02028 along the direction of the slit, the combined exposure time is shown; Col. (6): Row number in the final x2d file of the brightest row.
| Grating | Aperture | Slit Width | Binning | Central | Wavelength Covered | Scale | Spatial Scale |
|---|---|---|---|---|---|---|---|
| (″) | (Å) | (Å … Å) | (Å/ pixel) | (″/ pixel) | |||
| (1) | (2) | (3) | (4) | (5) | (6) | (7) | (8) |
| G750M | 52x0.1 | 0.1 | 6768 | 6482 … 7054 | 1.108 | 0.05 | |
| G750M | 52x0.2 | 0.2 | 6768 | 6482 … 7054 | 1.108 | 0.1 | |
| G750M | 52x0.2 (M84) | 0.2 | 6581 | 6295 … 6867 | 0.554 | 0.05 | |
| G750M | 52x0.2 (M87) | 0.2 | 6581 | 6295 … 6867 | 0.554 | 0.05 |
Note. — Col. (1): HST/STIS Grating Used; Col. (2): HST/STIS Aperture Used; Col. (3): The slit width of the chosen aperture; Col. (4): The degree of on chip binning used given as binaxis1binaxis2 (wavelength by spatial binning); Col. (5): The set central wavelength; Col. (6): The minimum and maximum wavelengths on the CCD chip at that central wavelength position; Col. (7) The wavelength scale per binned pixel; Col. (8) The spatial scale per binned pixel. Further details of HST/STIS configurations can be found in Kimble, et al. (1998).
| Galaxy | Major Axis | Radio Axis | Dust Axis | STIS Slits | Target | |
|---|---|---|---|---|---|---|
| () | () | () | () | (∘) | ||
| (1) | (2) | (3) | (4) | (5) | (6) | (7) |
| NGC 193 | 58 | 104 | 0 | 57.9 | M.Ax. | 0.1 |
| NGC 315 | 39 | 130 | 40 | -143.8 | M.Ax. | 2.8 |
| NGC 383 | 144 | 162 | 138 | 144.1 | M.Ax. | 0.1 |
| NGC 541 | 143 | 76 | -85.6 | |||
| NGC 741 | 92 | -107.4 | M.Ax.† | 19.4 | ||
| UGC 1841 | 91 | 50 | 90.0 | M.Ax. | 1.0 | |
| NGC 2329 | 171 | 150 | 174 | 170.8 | M.Ax. | 0.2 |
| NGC 2892 | 164 | 52 | 142.0 | M.Ax.† | 22.0 | |
| NGC 3801 | 121 | 121 | 24 | 121.1 | M.Ax. | 0.1 |
| NGC 3862 | 25 | 30 | 122.3 | Jet | 2.3 | |
| UGC 7115 | 91 | 116 | 175 | -174.4 | Jet† | 20.4 |
| NGC 4261 | 155 | 87 | 163 | 157.9 | M.Ax. | 2.9 |
| NGC 4335 | 156 | 82 | 158 | -32.5 | M.Ax. | 8.5 |
| NGC 4374 | 128 | 1 | 79 | 104.0 | Jet | 13.0 |
| NGC 4486 | 128 | 112 | 164.7 | |||
| NGC 5127 | 68 | 118 | 48 | 68.0 | M.Ax. | 0.0 |
| NGC 5141 | 65 | 12 | 88 | 71.9 | M.Ax. | 6.9 |
| NGC 5490 | 1 | 75 | 143 | -173.9 | M.Ax. | 5.1 |
| NGC 7052 | 64 | 23 | 65 | 63.6 | M.Ax. | 0.4 |
| UGC 12064 | 39 | 11 | 171 | 170.6 | Dust | 0.4 |
| NGC 7626 | 171 | 44 | 167 | 170.8 | M.Ax. | 0.2 |
Note. — Col. (1): NGC/UGC Name; Col. (2): Position angles of the major axes just outside the central dust distributions; Col. (3): Position angles of the radio jet axes on arcsecond scales or smaller; Col. (4): Position angles of the central dust distributions; Col. (5): Position angles of the STIS slits on the nucleus; Col. (6): The target orientation of the STIS slits ( M.Ax.: Parallel to the Major Axis; Dust: Parallel to the Dust Axis; Jet: Perpendicular to the radio jet; † Additional flexibility allowed to reduce scheduling constraints); Col. (7): Offset in degrees of the STIS slits from the target orientation.
References. — Data for Columns 3 - 5 taken from Verdoes Kleijn, et al. (1999)
| Ion | Ref. | Transition | ||
|---|---|---|---|---|
| (Å) | (Å) | |||
| (1) | (2) | (3) | (4) | (5) |
| [N II] | (a) | 6548.05 | 6549.86 | |
| H | (b) | 6562.80 | 6564.61 | |
| [N II] | (a) | 6583.39 | 6585.21 | |
| [S II] | (a) | 6716.44 | 6718.29 | |
| [S II] | (a) | 6730.81 | 6732.67 |
Note. — Col. (1): Ion responsible for the line; Col. (2): Wavelength reference; Col. (3): Transition configuration terms; Col. (4): Air wavelength; Col. (5): Vacuum wavelength. Note that the value for H is computed from the intensity weighted mean of fine structure lines at and with relative intensities of 120 and 180 respectively.
References. — (a) Wallerstein, et al. (2001); (b) Reader & Corliss (1998)
| Row | Y-Offset | F) | F(N II6585) | F(S IItotal) | |||
|---|---|---|---|---|---|---|---|
| (″) | () | () | () | F(H) | F(H) | ||
| Slit 1: X-Offset -0.2″ | |||||||
| 2 | -0.9128 | 3.79 | |||||
| 3 | -0.8114 | 3.17 | |||||
| 4 | -0.7099 | 3.90 | |||||
| 5 | -0.6085 | 3.23 | |||||
| 6 | -0.5071 | 2.83 | |||||
| 7 | -0.4057 | 3.67 | |||||
| 8 | -0.3043 | 3.46 | |||||
| 9 | -0.2028 | 3.28 | |||||
| 10 | -0.1014 | 3.49 | |||||
| 11 | 0.0000 | 3.66 | |||||
| 12 | 0.1014 | 3.50 | |||||
| 13 | 0.2028 | 3.11 | |||||
| 14 | 0.3043 | 2.77 | |||||
| 15 | 0.4057 | 2.52 | |||||
| 16 | 0.5071 | 3.05 | |||||
| 17 | 0.6085 | 2.96 | |||||
| 18 | 0.7099 | 2.95 | |||||
| 19 | 0.8114 | 3.50 | |||||
| 20 | 0.9128 | 3.42 | |||||
| Slit 0: X-Offset 0.0″ | |||||||
| 1 | -1.0142 | 2.62 | |||||
| 4 | -0.7099 | 2.41 | |||||
| 5 | -0.6085 | 2.58 | |||||
| 6 | -0.5071 | 2.81 | |||||
| 7 | -0.4057 | 2.86 | |||||
| 8 | -0.3043 | 2.78 | |||||
| 9 | -0.2028 | 2.61 | |||||
| 10 | -0.1014 | 3.16 | |||||
| 11 | 0.0000 | 3.89 | |||||
| 12 | 0.1014 | 2.87 | |||||
| 13 | 0.2028 | 2.33 | |||||
| 14 | 0.3043 | 2.67 | |||||
| 15 | 0.4057 | 2.50 | |||||
| 16 | 0.5071 | 2.88 | |||||
| 17 | 0.6085 | 2.97 | |||||
| 18 | 0.7099 | 2.90 | |||||
| 20 | 0.9128 | 2.96 | |||||
| 21 | 1.0142 | 2.86 | |||||
| Slit 2: X-Offset +0.2″ | |||||||
| 1 | -1.0142 | 3.19 | |||||
| 2 | -0.9128 | 3.07 | |||||
| 7 | -0.4057 | 2.81 | |||||
| 8 | -0.3043 | 2.91 | |||||
| 9 | -0.2028 | 2.83 | |||||
| 10 | -0.1014 | 2.91 | |||||
| 11 | 0.0000 | 2.78 | |||||
| 12 | 0.1014 | 2.67 | |||||
| 13 | 0.2028 | 2.56 | |||||
| 14 | 0.3043 | 2.61 | |||||
| 15 | 0.4057 | 2.66 | |||||
| 16 | 0.5071 | 2.77 | |||||
| 17 | 0.6085 | 2.96 | |||||
| 21 | 1.0142 | 3.34 | |||||
| Row | Y-Offset | F) | F(N II6585) | F(S IItotal) | |||
|---|---|---|---|---|---|---|---|
| (″) | () | () | () | F(H) | F(H) | ||
| Slit 1: X-Offset -0.1″ | |||||||
| 1 | -0.5071 | 1.67 | |||||
| 7 | -0.2028 | 1.90 | |||||
| 8 | -0.1521 | 1.93 | |||||
| 9 | -0.1014 | 1.65 | |||||
| 10 | -0.0507 | 1.84 | |||||
| 11 | 0.0000 | 1.83 | |||||
| 12 | 0.0507 | 1.90 | |||||
| 13 | 0.1014 | 1.88 | |||||
| 14 | 0.1521 | 1.64 | |||||
| 15 | 0.2028 | 1.51 | |||||
| 16 | 0.2535 | 1.45 | |||||
| 17 | 0.3043 | 1.68 | |||||
| 18 | 0.3550 | 1.46 | |||||
| 20 | 0.4564 | 1.28 | |||||
| Slit 0: X-Offset 0.0″ | |||||||
| 1 | -0.5071 | 1.36 | |||||
| 2 | -0.4564 | 1.65 | |||||
| 4 | -0.3550 | 1.55 | |||||
| 5 | -0.3043 | 1.47 | |||||
| 6 | -0.2535 | 1.62 | |||||
| 7 | -0.2028 | 1.63 | |||||
| 8 | -0.1521 | 1.38 | |||||
| 9 | -0.1014 | 1.79 | |||||
| 10 | -0.0507 | 2.39 | |||||
| 11 | 0.0000 | 3.84 | |||||
| 12 | 0.0507 | 2.94 | |||||
| 13 | 0.1014 | 1.89 | |||||
| 14 | 0.1521 | 1.37 | |||||
| 15 | 0.2028 | 1.74 | |||||
| 17 | 0.3043 | 1.84 | |||||
| 19 | 0.4057 | 1.49 | |||||
| 20 | 0.4564 | 1.58 | |||||
| 21 | 0.5071 | 1.78 | |||||
| Slit 2: X-Offset +0.1″ | |||||||
| 3 | -0.4057 | 1.60 | |||||
| 4 | -0.3550 | 1.67 | |||||
| 5 | -0.3043 | 1.67 | |||||
| 6 | -0.2535 | 1.83 | |||||
| 7 | -0.2028 | 1.69 | |||||
| 8 | -0.1521 | 1.56 | |||||
| 9 | -0.1014 | 1.96 | |||||
| 10 | -0.0507 | 1.99 | |||||
| 11 | 0.0000 | 1.90 | |||||
| 12 | 0.0507 | 2.04 | |||||
| 13 | 0.1014 | 2.30 | |||||
| 14 | 0.1521 | 1.54 | |||||
| 15 | 0.2028 | 1.68 | |||||
| 17 | 0.3043 | 1.70 | |||||
| 18 | 0.3550 | 1.94 | |||||
| 19 | 0.4057 | 1.56 | |||||
| 20 | 0.4564 | 1.71 | |||||
| 21 | 0.5071 | 1.76 | |||||
| Row | Y-Offset | F) | F(N II6585) | F(S IItotal) | |||
|---|---|---|---|---|---|---|---|
| (″) | () | () | () | F(H) | F(H) | ||
| Slit 1: X-Offset -0.1″ | |||||||
| 2 | -0.4564 | 1.40 | |||||
| 3 | -0.4057 | 1.58 | |||||
| 4 | -0.3550 | 1.62 | |||||
| 5 | -0.3043 | 1.86 | |||||
| 6 | -0.2535 | 1.91 | |||||
| 7 | -0.2028 | 1.48 | |||||
| 8 | -0.1521 | 1.68 | |||||
| 9 | -0.1014 | 1.64 | |||||
| 10 | -0.0507 | 1.65 | |||||
| 11 | 0.0000 | 1.90 | |||||
| 12 | 0.0507 | 2.04 | |||||
| 13 | 0.1014 | 1.48 | |||||
| 14 | 0.1521 | 1.34 | |||||
| 17 | 0.3043 | 1.76 | |||||
| 18 | 0.3550 | 1.58 | |||||
| 20 | 0.4564 | 1.60 | |||||
| 21 | 0.5071 | 1.70 | |||||
| Slit 0: X-Offset 0.0″ | |||||||
| 1 | -0.5071 | 1.68 | |||||
| 2 | -0.4564 | 1.68 | |||||
| 3 | -0.4057 | 1.72 | |||||
| 4 | -0.3550 | 1.71 | |||||
| 5 | -0.3043 | 1.56 | |||||
| 6 | -0.2535 | 1.76 | |||||
| 7 | -0.2028 | 1.89 | |||||
| 8 | -0.1521 | 2.08 | |||||
| 9 | -0.1014 | 2.17 | |||||
| 10 | -0.0507 | 2.99 | |||||
| 11 | 0.0000 | 2.68 | |||||
| 13 | 0.1014 | 1.83 | |||||
| 14 | 0.1521 | 1.80 | |||||
| 15 | 0.2028 | 1.69 | |||||
| 18 | 0.3550 | 1.47 | |||||
| 19 | 0.4057 | 1.53 | |||||
| 20 | 0.4564 | 1.76 | |||||
| 21 | 0.5071 | 1.36 | |||||
| Slit 2: X-Offset +0.1″ | |||||||
| 1 | -0.5071 | 1.48 | |||||
| 2 | -0.4564 | 1.74 | |||||
| 4 | -0.3550 | 2.26 | |||||
| 5 | -0.3043 | 1.77 | |||||
| 6 | -0.2535 | 1.97 | |||||
| 7 | -0.2028 | 1.79 | |||||
| 8 | -0.1521 | 1.91 | |||||
| 9 | -0.1014 | 1.67 | |||||
| 10 | -0.0507 | 1.76 | |||||
| 11 | 0.0000 | 1.53 | |||||
| 12 | 0.0507 | 1.82 | |||||
| 13 | 0.1014 | 1.65 | |||||
| 18 | 0.3550 | 1.75 | |||||
| 19 | 0.4057 | 1.66 | |||||
| 20 | 0.4564 | 1.84 | |||||
| 21 | 0.5071 | 1.81 | |||||
| Row | Y-Offset | F) | F(N II6585) | F(S IItotal) | |||
|---|---|---|---|---|---|---|---|
| (″) | () | () | () | F(H) | F(H) | ||
| Slit 1: X-Offset -0.2″ | |||||||
| 2 | -0.9128 | 2.73 | |||||
| 5 | -0.6085 | 3.11 | |||||
| 6 | -0.5071 | 3.27 | |||||
| 7 | -0.4057 | 2.86 | |||||
| 8 | -0.3043 | 2.36 | |||||
| 9 | -0.2028 | 2.66 | |||||
| 10 | -0.1014 | 2.34 | |||||
| 11 | 0.0000 | 2.61 | |||||
| 12 | 0.1014 | 2.57 | |||||
| 13 | 0.2028 | 2.34 | |||||
| 14 | 0.3043 | 2.85 | |||||
| 15 | 0.4057 | 2.70 | |||||
| 16 | 0.5071 | 3.38 | |||||
| 17 | 0.6085 | 3.38 | |||||
| 18 | 0.7099 | 2.57 | |||||
| 19 | 0.8114 | 2.49 | |||||
| 20 | 0.9128 | 3.00 | |||||
| Slit 0: X-Offset 0.0″ | |||||||
| 5 | -0.6085 | 2.10 | |||||
| 6 | -0.5071 | 2.59 | |||||
| 7 | -0.4057 | 2.98 | |||||
| 9 | -0.2028 | 2.26 | |||||
| 10 | -0.1014 | 2.78 | |||||
| 11 | 0.0000 | 2.44 | |||||
| 12 | 0.1014 | 2.54 | |||||
| 13 | 0.2028 | 2.60 | |||||
| 14 | 0.3043 | 2.73 | |||||
| 15 | 0.4057 | 2.54 | |||||
| 16 | 0.5071 | 2.51 | |||||
| 17 | 0.6085 | 2.28 | |||||
| 20 | 0.9128 | 2.62 | |||||
| Slit 2: X-Offset +0.2″ | |||||||
| 1 | -1.0142 | 3.02 | |||||
| 2 | -0.9128 | 2.87 | |||||
| 6 | -0.5071 | 3.47 | |||||
| 7 | -0.4057 | 3.15 | |||||
| 8 | -0.3043 | 2.56 | |||||
| 9 | -0.2028 | 2.62 | |||||
| 10 | -0.1014 | 2.34 | |||||
| 11 | 0.0000 | 2.79 | |||||
| 12 | 0.1014 | 2.62 | |||||
| 13 | 0.2028 | 2.63 | |||||
| 14 | 0.3043 | 2.89 | |||||
| 15 | 0.4057 | 2.85 | |||||
| 16 | 0.5071 | 2.85 | |||||
| 17 | 0.6085 | 2.60 | |||||
| 19 | 0.8114 | 2.60 | |||||
| 20 | 0.9128 | 2.37 | |||||
| Row | Y-Offset | F) | F(N II6585) | F(S IItotal) | |||
|---|---|---|---|---|---|---|---|
| (″) | () | () | () | F(H) | F(H) | ||
| Slit 1: X-Offset -0.2″ | |||||||
| 2 | -0.9128 | 2.41 | |||||
| 3 | -0.8114 | 2.69 | |||||
| 6 | -0.5071 | 3.00 | |||||
| 7 | -0.4057 | 3.08 | |||||
| 12 | 0.1014 | 2.83 | |||||
| 13 | 0.2028 | 3.50 | |||||
| 18 | 0.7099 | 3.33 | |||||
| 19 | 0.8114 | 2.94 | |||||
| Slit 0: X-Offset 0.0″ | |||||||
| 2 | -0.9128 | 2.12 | |||||
| 6 | -0.5071 | 2.45 | |||||
| 11 | 0.0000 | 2.40 | |||||
| 12 | 0.1014 | 2.22 | |||||
| 13 | 0.2028 | 2.15 | |||||
| Slit 2: X-Offset +0.2″ | |||||||
| 10 | -0.1014 | 2.40 | |||||
| 11 | 0.0000 | 2.92 | |||||
| 14 | 0.3043 | 2.63 | |||||
| Row | Y-Offset | F) | F(N II6585) | F(S IItotal) | |||
|---|---|---|---|---|---|---|---|
| (″) | () | () | () | F(H) | F(H) | ||
| Slit 1: X-Offset -0.2″ | |||||||
| 1 | -1.0142 | 4.21 | |||||
| 2 | -0.9128 | 4.16 | |||||
| 5 | -0.6085 | 4.90 | |||||
| 6 | -0.5071 | 4.45 | |||||
| 7 | -0.4057 | 4.76 | |||||
| 8 | -0.3043 | 4.34 | |||||
| 9 | -0.2028 | 3.53 | |||||
| 10 | -0.1014 | 4.58 | |||||
| 11 | 0.0000 | 4.20 | |||||
| 12 | 0.1014 | 4.32 | |||||
| 13 | 0.2028 | 4.56 | |||||
| 14 | 0.3043 | 4.48 | |||||
| 15 | 0.4057 | 5.04 | |||||
| 16 | 0.5071 | 3.89 | |||||
| 17 | 0.6085 | 5.27 | |||||
| 19 | 0.8114 | 3.96 | |||||
| 20 | 0.9128 | 4.76 | |||||
| Slit 0: X-Offset 0.0″ | |||||||
| 3 | -0.8114 | 3.40 | |||||
| 4 | -0.7099 | 2.62 | |||||
| 6 | -0.5071 | 2.43 | |||||
| 7 | -0.4057 | 3.18 | |||||
| 8 | -0.3043 | 3.83 | |||||
| 9 | -0.2028 | 3.44 | |||||
| 10 | -0.1014 | 4.16 | |||||
| 11 | 0.0000 | 4.79 | |||||
| 13 | 0.2028 | 3.46 | |||||
| 14 | 0.3043 | 2.94 | |||||
| 15 | 0.4057 | 3.10 | |||||
| 17 | 0.6085 | 3.84 | |||||
| Slit 2: X-Offset +0.2″ | |||||||
| 1 | -1.0142 | 4.02 | |||||
| 3 | -0.8114 | 3.60 | |||||
| 6 | -0.5071 | 3.62 | |||||
| 7 | -0.4057 | 3.12 | |||||
| 8 | -0.3043 | 3.54 | |||||
| 9 | -0.2028 | 4.25 | |||||
| 10 | -0.1014 | 3.76 | |||||
| 11 | 0.0000 | 3.04 | |||||
| 12 | 0.1014 | 4.05 | |||||
| 14 | 0.3043 | 4.44 | |||||
| 17 | 0.6085 | 3.44 | |||||
| 18 | 0.7099 | 3.65 | |||||
| 20 | 0.9128 | 3.41 | |||||
| 21 | 1.0142 | 3.95 | |||||
| Row | Y-Offset | F) | F(N II6585) | F(S IItotal) | |||
|---|---|---|---|---|---|---|---|
| (″) | () | () | () | F(H) | F(H) | ||
| Slit 1: X-Offset -0.2″ | |||||||
| 2 | -0.9128 | 3.27 | |||||
| 3 | -0.8114 | 2.73 | |||||
| 4 | -0.7099 | 3.24 | |||||
| 5 | -0.6085 | 3.19 | |||||
| 6 | -0.5071 | 2.98 | |||||
| 7 | -0.4057 | 3.33 | |||||
| 8 | -0.3043 | 3.04 | |||||
| 9 | -0.2028 | 2.53 | |||||
| 10 | -0.1014 | 2.67 | |||||
| 11 | 0.0000 | 2.51 | |||||
| 12 | 0.1014 | 2.94 | |||||
| 13 | 0.2028 | 2.90 | |||||
| 14 | 0.3043 | 3.03 | |||||
| 18 | 0.7099 | 3.22 | |||||
| Slit 0: X-Offset 0.0″ | |||||||
| 1 | -1.0142 | 1.93 | |||||
| 5 | -0.6085 | 2.34 | |||||
| 6 | -0.5071 | 2.50 | |||||
| 7 | -0.4057 | 2.20 | |||||
| 9 | -0.2028 | 2.17 | |||||
| 10 | -0.1014 | 3.19 | |||||
| 11 | 0.0000 | 3.82 | |||||
| 12 | 0.1014 | 4.66 | |||||
| 14 | 0.3043 | 2.64 | |||||
| 20 | 0.9128 | 2.23 | |||||
| 21 | 1.0142 | 2.25 | |||||
| Slit 2: X-Offset +0.2″ | |||||||
| 1 | -1.0142 | 2.15 | |||||
| 2 | -0.9128 | 2.48 | |||||
| 8 | -0.3043 | 2.64 | |||||
| 9 | -0.2028 | 2.69 | |||||
| 10 | -0.1014 | 2.94 | |||||
| 11 | 0.0000 | 2.44 | |||||
| 12 | 0.1014 | 2.66 | |||||
| 13 | 0.2028 | 2.25 | |||||
| 14 | 0.3043 | 2.58 | |||||
| 15 | 0.4057 | 2.59 | |||||
| 17 | 0.6085 | 2.71 | |||||
| 19 | 0.8114 | 2.43 | |||||
| 20 | 0.9128 | 2.61 | |||||
| Row | Y-Offset | F) | F(N II6585) | F(S IItotal) | |||
|---|---|---|---|---|---|---|---|
| (″) | () | () | () | F(H) | F(H) | ||
| Slit 1: X-Offset -0.2″ | |||||||
| 1 | -1.0142 | 3.48 | |||||
| 3 | -0.8114 | 3.31 | |||||
| 4 | -0.7099 | 3.43 | |||||
| 6 | -0.5071 | 3.25 | |||||
| 8 | -0.3043 | 3.19 | |||||
| 9 | -0.2028 | 3.18 | |||||
| 11 | 0.0000 | 3.17 | |||||
| 12 | 0.1014 | 2.98 | |||||
| 13 | 0.2028 | 2.94 | |||||
| 15 | 0.4057 | 2.95 | |||||
| 16 | 0.5071 | 2.74 | |||||
| 19 | 0.8114 | 3.38 | |||||
| 21 | 1.0142 | 3.43 | |||||
| Slit 0: X-Offset 0.0″ | |||||||
| 1 | -1.0142 | 2.11 | |||||
| 3 | -0.8114 | 2.21 | |||||
| 9 | -0.2028 | 2.25 | |||||
| 10 | -0.1014 | 2.24 | |||||
| 11 | 0.0000 | 2.44 | |||||
| 12 | 0.1014 | 2.96 | |||||
| 21 | 1.0142 | 1.98 | |||||
| Slit 2: X-Offset +0.2″ | |||||||
| 3 | -0.8114 | 2.70 | |||||
| 4 | -0.7099 | 1.70 | |||||
| 5 | -0.6085 | 2.70 | |||||
| 7 | -0.4057 | 2.44 | |||||
| 10 | -0.1014 | 2.22 | |||||
| 11 | 0.0000 | 2.62 | |||||
| 12 | 0.1014 | 2.52 | |||||
| 13 | 0.2028 | 2.55 | |||||
| 14 | 0.3043 | 2.42 | |||||
| 15 | 0.4057 | 2.46 | |||||
| 16 | 0.5071 | 2.17 | |||||
| 17 | 0.6085 | 2.46 | |||||
| Row | Y-Offset | F) | F(N II6585) | F(S IItotal) | |||
|---|---|---|---|---|---|---|---|
| (″) | () | () | () | F(H) | F(H) | ||
| Slit 1: X-Offset -0.2″ | |||||||
| 2 | -0.9128 | 3.00 | |||||
| 3 | -0.8114 | 3.49 | |||||
| 4 | -0.7099 | 3.59 | |||||
| 7 | -0.4057 | 3.41 | |||||
| 9 | -0.2028 | 3.78 | |||||
| 10 | -0.1014 | 3.66 | |||||
| 11 | 0.0000 | 3.01 | |||||
| 12 | 0.1014 | 3.50 | |||||
| 14 | 0.3043 | 3.23 | |||||
| 17 | 0.6085 | 3.53 | |||||
| 20 | 0.9128 | 3.17 | |||||
| Slit 0: X-Offset 0.0″ | |||||||
| 2 | -0.9128 | 2.76 | |||||
| 3 | -0.8114 | 2.43 | |||||
| 6 | -0.5071 | 2.51 | |||||
| 8 | -0.3043 | 2.02 | |||||
| 9 | -0.2028 | 2.55 | |||||
| 10 | -0.1014 | 2.56 | |||||
| 11 | 0.0000 | 2.32 | |||||
| 12 | 0.1014 | 2.72 | |||||
| 13 | 0.2028 | 2.27 | |||||
| 14 | 0.3043 | 2.20 | |||||
| 17 | 0.6085 | 2.57 | |||||
| 19 | 0.8114 | 2.43 | |||||
| 20 | 0.9128 | 2.71 | |||||
| 21 | 1.0142 | 2.66 | |||||
| Slit 2: X-Offset +0.2″ | |||||||
| 2 | -0.9128 | 2.96 | |||||
| 3 | -0.8114 | 2.64 | |||||
| 4 | -0.7099 | 2.44 | |||||
| 5 | -0.6085 | 2.43 | |||||
| 7 | -0.4057 | 2.75 | |||||
| 8 | -0.3043 | 2.62 | |||||
| 9 | -0.2028 | 2.93 | |||||
| 10 | -0.1014 | 2.70 | |||||
| 11 | 0.0000 | 2.98 | |||||
| 12 | 0.1014 | 2.93 | |||||
| 13 | 0.2028 | 2.52 | |||||
| 14 | 0.3043 | 2.43 | |||||
| 15 | 0.4057 | 2.31 | |||||
| 20 | 0.9128 | 2.90 | |||||
| Row | Y-Offset | F) | F(N II6585) | F(S IItotal) | |||
|---|---|---|---|---|---|---|---|
| (″) | () | () | () | F(H) | F(H) | ||
| Slit 1: X-Offset -0.2″ | |||||||
| 1 | -1.0142 | 2.10 | |||||
| 5 | -0.6085 | 2.22 | |||||
| 6 | -0.5071 | 1.94 | |||||
| 7 | -0.4057 | 2.25 | |||||
| 8 | -0.3043 | 2.07 | |||||
| 9 | -0.2028 | 2.30 | |||||
| 10 | -0.1014 | 2.36 | |||||
| 11 | 0.0000 | 2.41 | |||||
| 12 | 0.1014 | 2.36 | |||||
| 13 | 0.2028 | 2.26 | |||||
| 14 | 0.3043 | 2.27 | |||||
| 15 | 0.4057 | 1.96 | |||||
| 16 | 0.5071 | 2.10 | |||||
| 17 | 0.6085 | 2.31 | |||||
| 18 | 0.7099 | 1.95 | |||||
| 21 | 1.0142 | 2.23 | |||||
| Slit 0: X-Offset 0.0″ | |||||||
| 4 | -0.7099 | 1.75 | |||||
| 5 | -0.6085 | 1.70 | |||||
| 6 | -0.5071 | 1.82 | |||||
| 7 | -0.4057 | 1.81 | |||||
| 8 | -0.3043 | 1.88 | |||||
| 9 | -0.2028 | 2.34 | |||||
| 10 | -0.1014 | 3.40 | |||||
| 11 | 0.0000 | 4.21 | |||||
| 12 | 0.1014 | 4.59 | |||||
| 13 | 0.2028 | 2.01 | |||||
| 14 | 0.3043 | 1.90 | |||||
| 16 | 0.5071 | 1.96 | |||||
| 17 | 0.6085 | 1.76 | |||||
| Slit 2: X-Offset +0.2″ | |||||||
| 1 | -1.0142 | 1.90 | |||||
| 3 | -0.8114 | 2.27 | |||||
| 4 | -0.7099 | 2.43 | |||||
| 5 | -0.6085 | 2.27 | |||||
| 6 | -0.5071 | 2.32 | |||||
| 7 | -0.4057 | 2.81 | |||||
| 8 | -0.3043 | 2.32 | |||||
| 9 | -0.2028 | 2.33 | |||||
| 10 | -0.1014 | 2.61 | |||||
| 11 | 0.0000 | 1.99 | |||||
| 12 | 0.1014 | 2.45 | |||||
| 13 | 0.2028 | 2.06 | |||||
| 14 | 0.3043 | 2.12 | |||||
| 15 | 0.4057 | 1.99 | |||||
| 16 | 0.5071 | 2.44 | |||||
| Row | Y-Offset | F) | F(N II6585) | F(S IItotal) | |||
|---|---|---|---|---|---|---|---|
| (″) | () | () | () | F(H) | F(H) | ||
| Slit 0: X-Offset 0.0″ | |||||||
| 5 | -0.6085 | 2.59 | |||||
| 6 | -0.5071 | 2.90 | |||||
| 7 | -0.4057 | 2.65 | |||||
| 8 | -0.3043 | 2.84 | |||||
| 9 | -0.2028 | 2.53 | |||||
| 10 | -0.1014 | 2.48 | |||||
| 11 | 0.0000 | 2.79 | |||||
| 12 | 0.1014 | 3.86 | |||||
| 13 | 0.2028 | 2.92 | |||||
| 15 | 0.4057 | 2.78 | |||||
| 16 | 0.5071 | 2.42 | |||||
| Row | Y-Offset | F) | F(N II6585) | F(S IItotal) | |||
|---|---|---|---|---|---|---|---|
| (″) | () | () | () | F(H) | F(H) | ||
| Slit 1: X-Offset -0.1″ | |||||||
| 1 | -0.5071 | 1.62 | |||||
| 2 | -0.4564 | 1.62 | |||||
| 3 | -0.4057 | 1.54 | |||||
| 4 | -0.3550 | 1.45 | |||||
| 5 | -0.3043 | 1.83 | |||||
| 6 | -0.2535 | 1.64 | |||||
| 7 | -0.2028 | 1.91 | |||||
| 8 | -0.1521 | 2.24 | |||||
| 9 | -0.1014 | 1.96 | |||||
| 10 | -0.0507 | 2.17 | |||||
| 11 | 0.0000 | 1.68 | |||||
| 12 | 0.0507 | 1.85 | |||||
| 13 | 0.1014 | 1.59 | |||||
| 14 | 0.1521 | 1.68 | |||||
| 18 | 0.3550 | 1.90 | |||||
| 20 | 0.4564 | 1.50 | |||||
| 21 | 0.5071 | 1.73 | |||||
| Slit 0: X-Offset 0.0″ | |||||||
| 1 | -0.5071 | 1.93 | |||||
| 2 | -0.4564 | 1.89 | |||||
| 3 | -0.4057 | 1.33 | |||||
| 4 | -0.3550 | 1.64 | |||||
| 5 | -0.3043 | 1.77 | |||||
| 6 | -0.2535 | 2.05 | |||||
| 7 | -0.2028 | 1.71 | |||||
| 8 | -0.1521 | 1.77 | |||||
| 9 | -0.1014 | 1.72 | |||||
| 10 | -0.0507 | 1.98 | |||||
| 11 | 0.0000 | 1.71 | |||||
| 12 | 0.0507 | 1.67 | |||||
| 13 | 0.1014 | 1.58 | |||||
| 14 | 0.1521 | 1.79 | |||||
| 15 | 0.2028 | 1.86 | |||||
| Slit 2: X-Offset +0.1″ | |||||||
| 1 | -0.5071 | 1.74 | |||||
| 2 | -0.4564 | 1.54 | |||||
| 3 | -0.4057 | 1.44 | |||||
| 4 | -0.3550 | 1.61 | |||||
| 5 | -0.3043 | 1.83 | |||||
| 6 | -0.2535 | 1.52 | |||||
| 7 | -0.2028 | 1.54 | |||||
| 8 | -0.1521 | 1.52 | |||||
| 9 | -0.1014 | 1.59 | |||||
| 10 | -0.0507 | 1.33 | |||||
| 11 | 0.0000 | 1.48 | |||||
| 12 | 0.0507 | 1.94 | |||||
| 13 | 0.1014 | 1.39 | |||||
| 15 | 0.2028 | 1.63 | |||||
| 16 | 0.2535 | 1.63 | |||||
| 20 | 0.4564 | 1.60 | |||||
| Row | Y-Offset | F) | F(N II6585) | F(S IItotal) | |||
|---|---|---|---|---|---|---|---|
| (″) | () | () | () | F(H) | F(H) | ||
| Slit 1: X-Offset -0.2″ | |||||||
| 1 | -1.0142 | 2.80 | |||||
| 3 | -0.8114 | 2.81 | |||||
| 4 | -0.7099 | 2.37 | |||||
| 5 | -0.6085 | 2.29 | |||||
| 6 | -0.5071 | 2.15 | |||||
| 7 | -0.4057 | 1.84 | |||||
| 8 | -0.3043 | 2.20 | |||||
| 9 | -0.2028 | 2.43 | |||||
| 10 | -0.1014 | 2.06 | |||||
| 11 | 0.0000 | 2.34 | |||||
| 12 | 0.1014 | 2.14 | |||||
| 13 | 0.2028 | 2.50 | |||||
| 14 | 0.3043 | 3.17 | |||||
| 16 | 0.5071 | 2.72 | |||||
| 17 | 0.6085 | 2.99 | |||||
| 18 | 0.7099 | 3.24 | |||||
| 20 | 0.9128 | 3.04 | |||||
| 21 | 1.0142 | 3.68 | |||||
| Slit 0: X-Offset 0.0″ | |||||||
| 1 | -1.0142 | 2.16 | |||||
| 2 | -0.9128 | 2.21 | |||||
| 3 | -0.8114 | 2.18 | |||||
| 4 | -0.7099 | 2.31 | |||||
| 5 | -0.6085 | 2.01 | |||||
| 6 | -0.5071 | 1.88 | |||||
| 7 | -0.4057 | 1.62 | |||||
| 8 | -0.3043 | 1.66 | |||||
| 9 | -0.2028 | 1.56 | |||||
| 10 | -0.1014 | 2.19 | |||||
| 11 | 0.0000 | 3.21 | |||||
| 12 | 0.1014 | 2.19 | |||||
| 13 | 0.2028 | 1.72 | |||||
| 14 | 0.3043 | 1.98 | |||||
| 15 | 0.4057 | 2.11 | |||||
| 16 | 0.5071 | 2.39 | |||||
| 17 | 0.6085 | 2.28 | |||||
| 18 | 0.7099 | 2.16 | |||||
| 19 | 0.8114 | 2.54 | |||||
| Slit 2: X-Offset +0.2″ | |||||||
| 1 | -1.0142 | 2.72 | |||||
| 4 | -0.7099 | 2.69 | |||||
| 5 | -0.6085 | 2.17 | |||||
| 7 | -0.4057 | 1.95 | |||||
| 8 | -0.3043 | 1.74 | |||||
| 9 | -0.2028 | 1.72 | |||||
| 10 | -0.1014 | 1.95 | |||||
| 11 | 0.0000 | 1.74 | |||||
| 12 | 0.1014 | 1.94 | |||||
| 13 | 0.2028 | 1.70 | |||||
| 14 | 0.3043 | 1.85 | |||||
| 15 | 0.4057 | 1.75 | |||||
| 16 | 0.5071 | 1.68 | |||||
| 17 | 0.6085 | 2.24 | |||||
| 18 | 0.7099 | 2.51 | |||||
| 19 | 0.8114 | 2.20 | |||||
| 21 | 1.0142 | 3.22 | |||||
| Row | Y-Offset | F) | F(N II6585) | F(S IItotal) | |||
|---|---|---|---|---|---|---|---|
| (″) | () | () | () | F(H) | F(H) | ||
| Slit 1: X-Offset -0.2″ | |||||||
| 1 | -0.5071 | 1.33 | |||||
| 2 | -0.4564 | 1.28 | |||||
| 3 | -0.4057 | 1.36 | |||||
| 4 | -0.3550 | 1.22 | |||||
| 5 | -0.3043 | 1.34 | |||||
| 6 | -0.2535 | 1.39 | |||||
| 7 | -0.2028 | 1.42 | |||||
| 8 | -0.1521 | 1.54 | |||||
| 9 | -0.1014 | 1.50 | |||||
| 10 | -0.0507 | 1.65 | |||||
| 11 | 0.0000 | 1.58 | |||||
| 12 | 0.0507 | 1.61 | |||||
| 13 | 0.1014 | 1.33 | |||||
| 14 | 0.1521 | 1.24 | |||||
| 15 | 0.2028 | 1.23 | |||||
| 16 | 0.2535 | 1.31 | |||||
| 17 | 0.3043 | 1.42 | |||||
| 18 | 0.3550 | 1.33 | |||||
| 19 | 0.4057 | 1.24 | |||||
| 20 | 0.4564 | 1.34 | |||||
| 21 | 0.5071 | 1.26 | |||||
| Slit 0: X-Offset 0.000″ | |||||||
| 1 | -0.5071 | 1.30 | |||||
| 2 | -0.4564 | 1.30 | |||||
| 3 | -0.4057 | 1.47 | |||||
| 4 | -0.3550 | 1.40 | |||||
| 5 | -0.3043 | 1.33 | |||||
| 6 | -0.2535 | 1.45 | |||||
| 7 | -0.2028 | 1.58 | |||||
| 8 | -0.1521 | 1.78 | |||||
| 9 | -0.1014 | 2.35 | |||||
| 10 | -0.0507 | 3.95 | |||||
| 11 | 0.0000 | 5.07 | |||||
| 12 | 0.0507 | 4.03 | |||||
| 13 | 0.1014 | 2.33 | |||||
| 14 | 0.1521 | 2.12 | |||||
| 15 | 0.2028 | 1.67 | |||||
| 16 | 0.2535 | 1.30 | |||||
| 17 | 0.3043 | 1.36 | |||||
| 18 | 0.3550 | 1.37 | |||||
| 19 | 0.4057 | 1.37 | |||||
| 20 | 0.4564 | 1.28 | |||||
| 21 | 0.5071 | 1.56 | |||||
| Slit 2: X-Offset +0.2″ | |||||||
| 1 | -0.5071 | 1.27 | |||||
| 2 | -0.4564 | 1.30 | |||||
| 3 | -0.4057 | 1.30 | |||||
| 4 | -0.3550 | 1.33 | |||||
| 5 | -0.3043 | 1.40 | |||||
| 6 | -0.2535 | 1.49 | |||||
| 7 | -0.2028 | 1.41 | |||||
| 8 | -0.1521 | 1.31 | |||||
| 9 | -0.1014 | 1.41 | |||||
| 10 | -0.0507 | 1.39 | |||||
| 11 | 0.0000 | 1.42 | |||||
| 12 | 0.0507 | 1.28 | |||||
| 13 | 0.1014 | 1.27 | |||||
| 14 | 0.1521 | 1.32 | |||||
| 15 | 0.2028 | 1.22 | |||||
| 16 | 0.2535 | 1.40 | |||||
| 17 | 0.3043 | 1.55 | |||||
| 18 | 0.3550 | 1.36 | |||||
| 19 | 0.4057 | 1.27 | |||||
| 20 | 0.4564 | 1.28 | |||||
| 21 | 0.5071 | 1.28 | |||||
| Row | Y-Offset | F) | F(N II6585) | F(S IItotal) | |||
|---|---|---|---|---|---|---|---|
| (″) | () | () | () | F(H) | F(H) | ||
| Slit 1: X-Offset -0.2″ | |||||||
| 1 | -0.5071 | 1.93 | |||||
| 2 | -0.4564 | 2.10 | |||||
| 3 | -0.4057 | 2.18 | |||||
| 4 | -0.3550 | 1.89 | |||||
| 5 | -0.3043 | 1.90 | |||||
| 6 | -0.2535 | 2.33 | |||||
| 7 | -0.2028 | 2.68 | |||||
| 8 | -0.1521 | 2.81 | |||||
| 9 | -0.1014 | 3.34 | |||||
| 10 | -0.0507 | 3.37 | |||||
| 11 | 0.0000 | 2.53 | |||||
| 12 | 0.0507 | 2.89 | |||||
| 13 | 0.1014 | 2.98 | |||||
| 14 | 0.1521 | 2.42 | |||||
| 15 | 0.2028 | 1.83 | |||||
| 16 | 0.2535 | 2.20 | |||||
| 17 | 0.3043 | 1.84 | |||||
| 18 | 0.3550 | 1.69 | |||||
| 19 | 0.4057 | 1.87 | |||||
| 20 | 0.4564 | 1.81 | |||||
| 21 | 0.5071 | 1.84 | |||||
| Slit 0: X-Offset 0.0″ | |||||||
| 1 | -0.5071 | 1.64 | |||||
| 2 | -0.4564 | 1.72 | |||||
| 3 | -0.4057 | 2.01 | |||||
| 4 | -0.3550 | 1.97 | |||||
| 5 | -0.3043 | 2.11 | |||||
| 6 | -0.2535 | 2.53 | |||||
| 7 | -0.2028 | 2.63 | |||||
| 8 | -0.1521 | 3.91 | |||||
| 9 | -0.1014 | 3.38 | |||||
| 10 | -0.0507 | 3.29 | |||||
| 11 | 0.0000 | 7.08 | |||||
| 12 | 0.0507 | 7.24 | |||||
| 13 | 0.1014 | 3.91 | |||||
| 14 | 0.1521 | 1.98 | |||||
| 15 | 0.2028 | 2.13 | |||||
| 16 | 0.2535 | 2.13 | |||||
| 17 | 0.3043 | 2.07 | |||||
| 18 | 0.3550 | 1.95 | |||||
| 19 | 0.4057 | 1.70 | |||||
| 20 | 0.4564 | 1.66 | |||||
| 21 | 0.5071 | 1.47 | |||||
| Slit 2: X-Offset +0.2″ | |||||||
| 1 | -0.5071 | 1.84 | |||||
| 2 | -0.4564 | 1.90 | |||||
| 3 | -0.4057 | 1.75 | |||||
| 4 | -0.3550 | 1.82 | |||||
| 5 | -0.3043 | 2.15 | |||||
| 6 | -0.2535 | 2.03 | |||||
| 7 | -0.2028 | 1.85 | |||||
| 8 | -0.1521 | 2.05 | |||||
| 9 | -0.1014 | 2.39 | |||||
| 10 | -0.0507 | 2.10 | |||||
| 11 | 0.0000 | 2.25 | |||||
| 12 | 0.0507 | 2.23 | |||||
| 13 | 0.1014 | 2.39 | |||||
| 14 | 0.1521 | 2.26 | |||||
| 15 | 0.2028 | 2.16 | |||||
| 16 | 0.2535 | 2.23 | |||||
| 17 | 0.3043 | 2.22 | |||||
| 18 | 0.3550 | 1.87 | |||||
| 19 | 0.4057 | 1.97 | |||||
| 20 | 0.4564 | 1.79 | |||||
| 21 | 0.5071 | 1.79 | |||||
| Row | Y-Offset | F) | F(N II6585) | F(S IItotal) | |||
|---|---|---|---|---|---|---|---|
| (″) | () | () | () | F(H) | F(H) | ||
| Slit 1: X-Offset -0.2″ | |||||||
| 5 | -0.6085 | 3.61 | |||||
| 8 | -0.3043 | 3.72 | |||||
| 9 | -0.2028 | 3.01 | |||||
| 10 | -0.1014 | 3.31 | |||||
| 11 | 0.0000 | 2.99 | |||||
| 12 | 0.1014 | 3.59 | |||||
| 13 | 0.2028 | 3.65 | |||||
| 14 | 0.3043 | 3.24 | |||||
| 17 | 0.6085 | 3.17 | |||||
| 20 | 0.9128 | 3.25 | |||||
| 21 | 1.0142 | 3.50 | |||||
| Slit 0: X-Offset 0.0″ | |||||||
| 4 | -0.7099 | 2.02 | |||||
| 7 | -0.4057 | 2.07 | |||||
| 8 | -0.3043 | 2.01 | |||||
| 9 | -0.2028 | 2.15 | |||||
| 10 | -0.1014 | 1.96 | |||||
| 11 | 0.0000 | 1.97 | |||||
| 12 | 0.1014 | 1.99 | |||||
| 13 | 0.2028 | 1.92 | |||||
| 18 | 0.7099 | 1.94 | |||||
| 21 | 1.0142 | 2.29 | |||||
| Slit 2: X-Offset +0.2″ | |||||||
| 1 | -1.0142 | 2.64 | |||||
| 4 | -0.7099 | 2.37 | |||||
| 6 | -0.5071 | 2.41 | |||||
| 7 | -0.4057 | 2.36 | |||||
| 8 | -0.3043 | 2.24 | |||||
| 9 | -0.2028 | 1.91 | |||||
| 10 | -0.1014 | 2.53 | |||||
| 11 | 0.0000 | 2.49 | |||||
| 12 | 0.1014 | 2.52 | |||||
| 13 | 0.2028 | 2.50 | |||||
| 14 | 0.3043 | 2.43 | |||||
| 18 | 0.7099 | 2.47 | |||||
| 19 | 0.8114 | 2.91 | |||||
| Row | Y-Offset | F) | F(N II6585) | F(S IItotal) | |||
|---|---|---|---|---|---|---|---|
| (″) | () | () | () | F(H) | F(H) | ||
| Slit 1: X-Offset -0.2″ | |||||||
| 1 | -1.0142 | 2.78 | |||||
| 4 | -0.7099 | 2.97 | |||||
| 5 | -0.6085 | 2.27 | |||||
| 6 | -0.5071 | 2.26 | |||||
| 7 | -0.4057 | 2.35 | |||||
| 8 | -0.3043 | 2.67 | |||||
| 9 | -0.2028 | 2.21 | |||||
| 10 | -0.1014 | 2.35 | |||||
| 11 | 0.0000 | 2.43 | |||||
| 12 | 0.1014 | 2.66 | |||||
| 13 | 0.2028 | 2.44 | |||||
| 14 | 0.3043 | 1.97 | |||||
| 15 | 0.4057 | 2.10 | |||||
| 16 | 0.5071 | 2.10 | |||||
| 17 | 0.6085 | 2.36 | |||||
| 18 | 0.7099 | 2.15 | |||||
| Slit 0: X-Offset 0.0″ | |||||||
| 1 | -1.0142 | 2.24 | |||||
| 3 | -0.8114 | 2.03 | |||||
| 5 | -0.6085 | 2.20 | |||||
| 6 | -0.5071 | 2.05 | |||||
| 7 | -0.4057 | 1.77 | |||||
| 8 | -0.3043 | 1.80 | |||||
| 9 | -0.2028 | 1.99 | |||||
| 10 | -0.1014 | 2.53 | |||||
| 11 | 0.0000 | 2.39 | |||||
| 12 | 0.1014 | 1.71 | |||||
| 13 | 0.2028 | 1.65 | |||||
| 14 | 0.3043 | 1.84 | |||||
| 15 | 0.4057 | 1.81 | |||||
| 16 | 0.5071 | 2.19 | |||||
| 17 | 0.6085 | 1.84 | |||||
| 18 | 0.7099 | 2.21 | |||||
| Slit 2: X-Offset +0.2″ | |||||||
| 3 | -0.8114 | 2.46 | |||||
| 4 | -0.7099 | 2.44 | |||||
| 6 | -0.5071 | 1.85 | |||||
| 7 | -0.4057 | 2.04 | |||||
| 8 | -0.3043 | 2.22 | |||||
| 9 | -0.2028 | 1.81 | |||||
| 10 | -0.1014 | 2.06 | |||||
| 11 | 0.0000 | 2.07 | |||||
| 12 | 0.1014 | 1.98 | |||||
| 13 | 0.2028 | 1.72 | |||||
| 14 | 0.3043 | 2.47 | |||||
| 15 | 0.4057 | 2.36 | |||||
| 16 | 0.5071 | 2.15 | |||||
| 19 | 0.8114 | 2.24 | |||||
| 21 | 1.0142 | 2.74 | |||||
| Row | Y-Offset | F) | F(N II6585) | F(S IItotal) | |||
|---|---|---|---|---|---|---|---|
| (″) | () | () | () | F(H) | F(H) | ||
| Slit 1: X-Offset -0.2″ | |||||||
| 3 | -0.8114 | 2.42 | |||||
| 5 | -0.6085 | 2.05 | |||||
| 10 | -0.1014 | 2.02 | |||||
| 11 | 0.0000 | 2.29 | |||||
| 12 | 0.1014 | 2.29 | |||||
| 13 | 0.2028 | 1.94 | |||||
| 14 | 0.3043 | 2.00 | |||||
| 16 | 0.5071 | 2.07 | |||||
| 19 | 0.8114 | 2.45 | |||||
| 20 | 0.9128 | 2.51 | |||||
| Slit 0: X-Offset 0.0″ | |||||||
| 2 | -0.9128 | 2.21 | |||||
| 3 | -0.8114 | 2.37 | |||||
| 6 | -0.5071 | 2.20 | |||||
| 7 | -0.4057 | 1.79 | |||||
| 10 | -0.1014 | 2.24 | |||||
| 13 | 0.2028 | 2.18 | |||||
| 18 | 0.7099 | 1.93 | |||||
| 21 | 1.0142 | 2.43 | |||||
| Slit 2: X-Offset +0.2″ | |||||||
| 1 | -1.0142 | 2.81 | |||||
| 4 | -0.7099 | 2.38 | |||||
| 13 | 0.2028 | 1.67 | |||||
| 16 | 0.5071 | 1.91 | |||||
| Row | Y-Offset | F) | F(N II6585) | F(S IItotal) | |||
|---|---|---|---|---|---|---|---|
| (″) | () | () | () | F(H) | F(H) | ||
| Slit 1: X-Offset -0.1″ | |||||||
| 2 | -0.4564 | 2.33 | |||||
| 5 | -0.3043 | 1.94 | |||||
| 6 | -0.2535 | 2.75 | |||||
| 7 | -0.2028 | 2.97 | |||||
| 8 | -0.1521 | 2.15 | |||||
| 9 | -0.1014 | 2.62 | |||||
| 10 | -0.0507 | 2.31 | |||||
| 11 | 0.0000 | 2.94 | |||||
| 12 | 0.0507 | 2.95 | |||||
| 16 | 0.2535 | 2.29 | |||||
| 18 | 0.3550 | 3.04 | |||||
| 19 | 0.4057 | 2.56 | |||||
| Slit 0: X-Offset 0.0″ | |||||||
| 1 | -0.5071 | 1.76 | |||||
| 4 | -0.3550 | 1.65 | |||||
| 7 | -0.2028 | 2.02 | |||||
| 8 | -0.1521 | 1.46 | |||||
| 9 | -0.1014 | 1.54 | |||||
| 10 | -0.0507 | 2.09 | |||||
| 11 | 0.0000 | 1.97 | |||||
| 12 | 0.0507 | 1.91 | |||||
| 14 | 0.1521 | 1.64 | |||||
| Slit 2: X-Offset +0.1″ | |||||||
| 1 | -0.5071 | 1.91 | |||||
| 2 | -0.4564 | 1.73 | |||||
| 3 | -0.4057 | 1.82 | |||||
| 4 | -0.3550 | 2.24 | |||||
| 5 | -0.3043 | 1.99 | |||||
| 6 | -0.2535 | 1.82 | |||||
| 7 | -0.2028 | 1.87 | |||||
| 8 | -0.1521 | 2.06 | |||||
| 9 | -0.1014 | 1.91 | |||||
| 10 | -0.0507 | 1.73 | |||||
| 11 | 0.0000 | 2.11 | |||||
| 13 | 0.1014 | 1.62 | |||||
| 14 | 0.1521 | 1.50 | |||||
| 16 | 0.2535 | 2.30 | |||||
| 20 | 0.4564 | 1.96 | |||||
| Row | Y-Offset | F) | F(N II6585) | F(S IItotal) | |||
|---|---|---|---|---|---|---|---|
| (″) | () | () | () | F(H) | F(H) | ||
| Slit 1: X-Offset -0.1″ | |||||||
| 2 | -0.4564 | 2.29 | |||||
| 3 | -0.4057 | 1.88 | |||||
| 4 | -0.3550 | 2.06 | |||||
| 5 | -0.3043 | 2.24 | |||||
| 6 | -0.2535 | 2.11 | |||||
| 7 | -0.2028 | 1.77 | |||||
| 8 | -0.1521 | 2.44 | |||||
| 9 | -0.1014 | 2.36 | |||||
| 10 | -0.0507 | 2.13 | |||||
| 11 | 0.0000 | 1.81 | |||||
| 12 | 0.0507 | 1.97 | |||||
| 18 | 0.3550 | 2.26 | |||||
| Slit 0: X-Offset 0.0″ | |||||||
| 2 | -0.4564 | 1.63 | |||||
| 3 | -0.4057 | 1.63 | |||||
| 5 | -0.3043 | 1.56 | |||||
| 6 | -0.2535 | 1.41 | |||||
| 8 | -0.1521 | 1.63 | |||||
| 10 | -0.0507 | 1.25 | |||||
| 11 | 0.0000 | 1.67 | |||||
| 12 | 0.0507 | 2.28 | |||||
| 13 | 0.1014 | 1.73 | |||||
| 19 | 0.4057 | 1.68 | |||||
| 20 | 0.4564 | 1.86 | |||||
| 21 | 0.5071 | 1.71 | |||||
| Slit 2: X-Offset +0.1″ | |||||||
| 1 | -0.5071 | 1.65 | |||||
| 2 | -0.4564 | 1.81 | |||||
| 3 | -0.4057 | 1.72 | |||||
| 8 | -0.1521 | 1.73 | |||||
| 9 | -0.1014 | 1.89 | |||||
| 10 | -0.0507 | 1.88 | |||||
| 11 | 0.0000 | 1.72 | |||||
| 14 | 0.1521 | 2.36 | |||||
| 15 | 0.2028 | 2.03 | |||||
| 16 | 0.2535 | 1.69 | |||||
| 18 | 0.3550 | 1.75 | |||||
| Row | Y-Offset | F) | F(N II6585) | F(S IItotal) | |||
|---|---|---|---|---|---|---|---|
| (″) | () | () | () | F(H) | F(H) | ||
| Slit 1: X-Offset -0.2″ | |||||||
| 8 | -0.3043 | 2.25 | |||||
| 9 | -0.2028 | 2.17 | |||||
| 10 | -0.1014 | 2.46 | |||||
| 11 | 0.0000 | 2.32 | |||||
| 12 | 0.1014 | 2.51 | |||||
| 13 | 0.2028 | 2.14 | |||||
| 14 | 0.3043 | 2.25 | |||||
| 16 | 0.5071 | 2.89 | |||||
| 17 | 0.6085 | 2.61 | |||||
| 18 | 0.7099 | 3.05 | |||||
| 19 | 0.8114 | 3.42 | |||||
| Slit 0: X-Offset 0.0″ | |||||||
| 1 | -1.0142 | 2.74 | |||||
| 2 | -0.9128 | 2.33 | |||||
| 6 | -0.5071 | 2.16 | |||||
| 7 | -0.4057 | 1.83 | |||||
| 8 | -0.3043 | 1.96 | |||||
| 9 | -0.2028 | 1.97 | |||||
| 10 | -0.1014 | 2.43 | |||||
| 11 | 0.0000 | 2.64 | |||||
| 12 | 0.1014 | 2.58 | |||||
| 13 | 0.2028 | 2.08 | |||||
| 14 | 0.3043 | 2.23 | |||||
| 16 | 0.5071 | 2.32 | |||||
| 17 | 0.6085 | 2.21 | |||||
| 21 | 1.0142 | 2.29 | |||||
| Slit 2: X-Offset +0.2″ | |||||||
| 5 | -0.6085 | 2.06 | |||||
| 6 | -0.5071 | 2.84 | |||||
| 10 | -0.1014 | 1.97 | |||||
| 11 | 0.0000 | 2.36 | |||||
| 12 | 0.1014 | 1.90 | |||||
| 15 | 0.4057 | 2.42 | |||||
| 16 | 0.5071 | 2.29 | |||||
| 17 | 0.6085 | 2.33 | |||||
| 18 | 0.7099 | 2.19 | |||||
| 19 | 0.8114 | 2.65 | |||||
| 20 | 0.9128 | 2.37 | |||||
| Fit description | F([N II]6585) | |||||
|---|---|---|---|---|---|---|
| () | () | () | () | F([N II]6549) | ||
| (1) | (2) | (3) | (4) | (5) | (6) | (7) |
| initial parameters | 4620 4 | 249 3 | 3.0 | 3.21 | ||
| free | 4616 9 | 4620 3 | 249 3 | 3.0 | 3.22 | |
| free | 4619 3 | 228 9 | 256 4 | 3.0 | 3.21 | |
| free | 4618 9 | 4619 4 | 228 9 | 256 4 | 3.0 | 3.22 |
| [N II] ratio free | 4622 3 | 248 3 | 2.32 0.09 | 3.04 | ||
Note. — The measurements shown were made using the central spectral row in the central slit observed for NGC 4335. Col. (1): Parameters made free, Initially a set of lines with one velocity and one velocity dispersion was used, with the ratio of the two [N II] lines fixed to 3.0. The two [S II] lines are fixed in velocity and width to the [N II] lines in every case; Col. (2-3): The radial velocities of the H and [N II] lines; Col. (3-4): The velocity dispersions of the H and [N II] lines; Col. (5): The ratio of the [N II]6585 and [N II]6549 lines; Col. (6): The reduced value of the resulting fit.
| Galaxy | By eye | Score | Broad Cpt. | ||
|---|---|---|---|---|---|
| (%) | |||||
| (1) | (2) | (3) | (4) | (5) | (6) |
| NGC 193 | 9.6 | 0.19 | 3 | Yes | |
| NGC 315 | 25.0 | 0.46 | 3 | Yes | |
| NGC 383 | 8.7 | 0.16 | 2 | Yes | |
| NGC 541 | 4.6 | 0.12 | 1 | No | |
| NGC 741 | 1.9 | 0.01 | 0 | No | |
| UGC 1841 | 14.7 | 0.35 | 3 | Yes | |
| NGC 2329 | 9.4 | 0.32 | 2 | * | |
| NGC 2892 | 2.8 | 0.09 | 0 | No | |
| NGC 3801 | 0.1 | 0.01 | 0 | No | |
| NGC 3862 | 8.0 | 0.22 | 2 | * | |
| UGC 7115 | 2.6 | 0.09 | 0 | No | |
| NGC 4261 | 7.8 | 0.22 | 3 | Yes | |
| NGC 4335 | 8.0 | 0.40 | 3 | Yes | |
| NGC 4374 | 2.4 | 0.12 | 0 | No | |
| NGC 4486 | 3.4 | 0.15 | 2 | Yes | |
| NGC 5127 | -1.5 | -0.01 | 0 | No | |
| NGC 5141 | 3.7 | 0.16 | 2 | Yes | |
| NGC 5490 | 5.2 | 0.23 | 3 | Yes | |
| NGC 7052 | 4.9 | 0.04 | 1 | No | |
| UGC 12064 | 6.7 | 0.11 | 2 | Yes | |
| NGC 7626 | 2.5 | 0.13 | 2 | Yes |
Note. — Col. (1): NGC/UGC Identification; Col. (2): Difference in the mean of the absolute values of the residuals from the fits including and excluding the additional component; Col. (3): Relative change in reduced value between fits with the narrow lines alone (N) and with the additional component (A); Col. (4): Could an improvement in the fit be judged by eye?; Col. (5): Additional component ‘score’, one point available from each of columns 2 to 6, see text for criteria; Col. (6) Is an additional broad component useful in the fit based on these results? An asterisk (*) indicates the component appears to represent a non-flat continuum.
| Galaxy | Row | (NL) | (BL) | (NL) | (BL) | |
|---|---|---|---|---|---|---|
| () | () | () | () | |||
| (1) | (2) | (3) | (4) | (5) | (6) | (7) |
| NGC 193 | 11 | 4417 7 | 5128 36 | 277 6 | 967 21 | 3.15 |
| NGC 315 | 11 | 4830 9 | 5738 55 | 406 9 | 1790 67 | 2.06 |
| NGC 383 | 11 | 5278 54 | 5568 29 | 669 39 | 1367 79 | 2.25 |
| UGC 1841 | 11 | 6409 8 | 6585 20 | 436 7 | 1254 35 | 3.11 |
| NGC 4261† | 11 | 2056 9 | 2703 68 | 366 12 | 1079 55 | 1.69 |
| NGC 4335 | 11 | 4618 3 | 4893 37 | 188 4 | 1299 51 | 1.93 |
| NGC 4486 | 11 | 1417 14 | 1408 28 | 534 12 | 1479 42 | 6.01 |
| NGC 5141 | 11 | 5229 3 | 5356 86 | 121 4 | 1223 96 | 2.01 |
| NGC 5490 | 11 | 4733 16 | 5621 61 | 377 22 | 1336 56 | 1.94 |
| UGC 12064 | 11 | 5195 16 | 5417 90 | 423 19 | 1321 168 | 1.49 |
| NGC 7626 | 11 | 3432 7 | 4083 76 | 287 10 | 1126 73 | 2.29 |
Note. — †For NGC 4261 slit 1 (offset -0.1 arcsec) was used; Col. (1): NGC/UGC Number; Col. (2): Central pixel row number referenced from the earlier data tables for each galaxy; Col. (3): The line of sight velocities of the narrow line components; Col. (4): The line of sight velocities of the broad components (where present); Col. (5): The line of sight velocity dispersions of the narrow line components; Col. (6): The line of sight velocity dispersions of the broad components (where present); Col. (7): The reduced value of the fit. The parameters were measured by fitting a models with 5 narrow lines, fixed to each other in velocity and velocity dispersion and one free broad component, except as noted above. Errors quoted are the formal errors on the various parameters from the fit.
| Galaxy | F(H) | F([N II]6585) | F([S II]total) | F(Broad Line) | F([S II]6733) |
|---|---|---|---|---|---|
| () | F(H) | F(H) | F(H) | F([S II]6718) | |
| (1) | (2) | (3) | (4) | (5) | (6) |
| NGC 193 | 1.33 0.23 | 4.21 0.77 | 3.86 0.71 | 7.60 1.46 | 1.18 0.07 |
| NGC 315 | 9.28 0.77 | 4.72 0.42 | 1.81 0.21 | 4.40 0.51 | 1.80 0.14 |
| NGC 383 | 27.72 3.65 | 0.33 0.18 | 0.56 0.63 | 2.14 0.50 | 0.11 0.12 |
| UGC 1841 | 7.71 0.46 | 2.41 0.16 | 1.39 0.11 | 2.57 0.28 | 1.09 0.06 |
| NGC 4261 | 4.36 1.53 | 6.76 2.42 | 3.37 1.23 | 7.22 2.93 | 1.55 0.15 |
| NGC 4335 | 1.33 0.13 | 4.46 0.44 | 2.63 0.32 | 7.54 0.87 | 1.04 0.08 |
| NGC 4486 | 44.96 1.53 | 0.43 0.04 | 0.59 0.60 | 1.37 0.11 | 0.03 0.03 |
| NGC 5141 | 0.91 0.07 | 2.95 0.25 | 1.38 0.22 | 3.11 0.45 | 0.97 0.14 |
| NGC 5490 | 0.25 0.20 | 14.34 11.64 | 9.12 7.56 | 40.54 32.95 | 1.94 0.38 |
| UGC 12064 | 0.48 1.14 | 30.72 72.97 | 11.16 26.60 | 32.31 77.41 | 0.58 0.12 |
| NGC 7626 | 1.48 0.24 | 3.80 0.66 | 1.98 0.38 | 4.00 1.01 | 0.95 0.09 |
Note. — Col. (1): NGC/UGC Number; Col. (2): H narrow line flux; Col. (3): Ratio of the broad line flux to the H narrow line flux; Col. (4) Ratio of the [N II]6585 narrow line flux to the H Narrow line flux; Col. (5) Ratio of the total [S II] flux to the H Narrow line flux; Col. (6) Ratio of the [S II]6733 narrow line to the [S II]6718 narrow line. The parameters were measured by fitting a models with 5 narrow lines, fixed to each other in velocity and velocity dispersion and one free broad component, except as noted above. Errors quoted are the formal errors on the various parameters from the fit.
| Galaxy | ||||
|---|---|---|---|---|
| (pc) | () | () | () | |
| (1) | (2) | (3) | (4) | (5) |
| Rotators | ||||
| NGC 315 | 528 | 290 | 353 | |
| NGC 383 | 924 | 342 | 434 | |
| NGC 2329 | 302 | 145 | 84 | |
| UGC 7115 | 497 | 287 | 337 | |
| NGC 4261 | 78 | 459 | 238 | 319 |
| NGC 4335 | 249 | 166 | 307 | |
| M 84 | 41 | 883 | 229 | 669 |
| NGC 4486 | 41 | 612 | 313 | 607 |
| NGC 5127 | 157 | 148 | 69 | |
| NGC 5141 | 149 | 146 | 196 | |
| NGC 7052 | 303 | 226 | 945 | |
| UGC 12064 | 497 | 308 | 361 | |
| NGC 7626 | 350 | 175 | 391 | |
| Mean | 463 254 | 236 72 | 390 250 | |
| Non-Rotators | ||||
| NGC 193 | 437 | 228 | 253 | |
| NGC 541 | 336 | 182 | 266 | |
| UGC 1841 | 593 | 378 | 16 | |
| NGC 2892 | 453 | 338 | 118 | |
| NGC 3801 | 163 | 143 | 113 | |
| NGC 3862 | 303 | 182 | 130 | |
| NGC 5490 | 680 | 240 | 358 | |
| Mean | 381 147 | 242 95 | 149 95 | |
Note. — Col. (1): Galaxy ID; Col. (2): Where the radius away from the central pixel used was less than 100 pc the radius is indicated here; Col. (3): The velocity dispersion of the very central spectrum; Col. (4): The mean velocity dispersion within 100 pc of the central position; Col. (5): The difference in mean velocities within 100 pc to either side of the central spectrum. The galaxies are grouped into two classes ‘rotators’ and ‘non-rotators’ judged by eye as discussed in the text, mean values of each parameter are given for each class.
| Parameter | UGC FR-I sample | Sy/LINERs | Radio Loud |
|---|---|---|---|
| (1) | (2) | (3) | (4) |
| () | |||
| () | |||
| () |
Note. — The mean velocity dispersions of broad and narrow lines and offsets of broad and narrow lines for three different galaxy samples: Col.(2) the data presented in this work; Col. (3) A sample of Seyferts and LINERs; Col. (4) A summary of properties of several sample of radio galaxies.
| Model ID | Description | (NL) | (BB) | (BC) | (NL) | (BB) | (BC) | |
|---|---|---|---|---|---|---|---|---|
| () | () | () | () | () | () | |||
| (1) | (2) | (3) | (4) | (5) | (6) | (7) | (8) | (9) |
| 1 | Narrow lines only | 4620 | 249 | 3.21 | ||||
| 2 | Model 1 + Extra Broad Component | 4618 | 4893 | 188 | 1299 | 1.93 | ||
| 3 | Model 2 + Constrained Broad Bases (i) | 4616 | = 4616 | 4767 | 139 | 354 | 1565 | 1.73 |
| 4 | Model 2 + Constrained Broad Bases (ii) | 4595 | 4724 | 4680 | 139 | 319 | 1417 | 1.60 |
| 5 | Model 2 + Unconstrained Broad Bases | 4616 | = 4616 | 4764 | 128 | 319 | 1389 | 1.68 |
Note. — Col. (1) Model ID (see text); Col. (2): Brief description of the fit; Cols. (3-5): The radial velocities of the narrow line (NL), broad base (BB) and broad components (BC) respectively; Cols. (6-8): The velocity dispersions of the narrow line (NL), broad base (BB) and broad components (BC) respectively. Fits were performed on the central row of the central slit of the observations of NGC 4335; Col. (9): The reduced value of the fit.