A deep Chandra observation of the Perseus cluster: shocks and ripples
Abstract
We present preliminary results from a deep observation lasting almost 200 ks, of the centre of the Perseus cluster of galaxies around NGC 1275. The X-ray surface brightness of the intracluster gas beyond the inner 20 kpc, which contains the inner radio bubbles, is very smooth apart from some low amplitude quasi-periodic ripples. A clear density jump at a radius of 24 kpc to the NE, about 10 kpc out from the bubble rim, appears to be due to a weak shock driven by the northern radio bubble. A similar front may exist round both inner bubbles but is masked elsewhere by rim emission from bright cooler gas. The continuous blowing of bubbles by the central radio source, leading to the propagation of weak shocks and viscously-dissipating sound waves seen as the observed fronts and ripples, gives a rate of working which balances the radiative cooling within the inner 50 kpc of the cluster core.
1 Introduction
The Perseus cluster, A426, is the X-ray brightest cluster of galaxies in the sky. The giant central galaxy, NGC 1275, hosts the radio source 3C84 (Pedlar et al 1990), from which jets have blown two diametrically-oppposed bubbles in the hot intracluster medium (Böhringer et al 1993; Fabian et al 2000). Surrounding NGC 1275 is a spectacular H nebulosity with filaments extending over 100 kpc (Lynds 1970; Conselice et al 2001).
The radiative cooling time of the hot gas drops inward to yr around NGC 1275, and the temperature drops down from from to about 3 keV. As has been found for many clusters with Chandra and XMM-Newton data (Peterson et al 2001, 2002; Tamura et al 2001), there is little gas at lower temperatures. A standard cooling flow (Fabian 1994) is not taking place despite the short cooling times, presumably due to some balancing heat source. Plausible heat sources are an active galactic nucleus (Tucker & Rosner 1983, Tabor & Binney 1993; Churazov et al 2000; Böhringer et al 2002) and the hot atmosphere surrrounding the AGN (Bertschinger & Meiksin 1986; Narayan & Medvedev 2001). The jets and bubbles may heat the surrounding gas from the centre (Brüggen & Kaiser 2001; Quilis et al 2001; Reynolds et al 2001; Basson & Alexander 2003) or thermal conduction may heat it from the outside (Voigt et al 2002; Fabian, Voigt & Morris 2002a; Zakamska & Narayan 2003). Combinations of heating and conduction have also been proposed (Ruszkowski & Begelman 2002). It has proven difficult in many models to match the observed temperature profiles (Brighenti & Mathews 2003). Other possibilities involving inhomogeneous metallicity (Fabian et al 2001; Morris & Fabian 2002) and mixing with cooler gas (Fabian et al 2001; 2002c) remain.
We observed the core of the Perseus cluster with Chandra for about 25 ks in 2001 (Fabian et al 2000; Schmidt, Fabian & Sanders 2002). Here we report on a recent Chandra observation which was almost ten times deeper ( ks). The complex two-dimensional temperature distribution of the hot gas is now clear, and subtle structures are revealed. These may be dissipating sound waves caused by the bubbles. The power from the sound waves is consistent with the radiative losses of the cluster core.
The Perseus cluster is at a redshift of 0.0183. We assume that so that 1 kpc corresponds to about 2.7 arcsec.
2 Analysis
Two observations of the cluster were made using Chandra with its ACIS-S detector, on 2002 Aug 8 (exposure 95.8 ks) and 10 (exposure 95.4 ks). The datasets show no evidence for contamination by flares and were merged into a single events file since the nominal roll angle of the spacecraft was essentially identical. The analysis presented here was made on this merged events file, which was processed with the acisD1999-09-16gainN0004 gain file.
The spectral analysis was made on the data from the S3 chip, although the neighbouring chips were used for imaging. The datasets were processed using ciao 2.3, and xspec 11.2 was used to analyse the spectra.
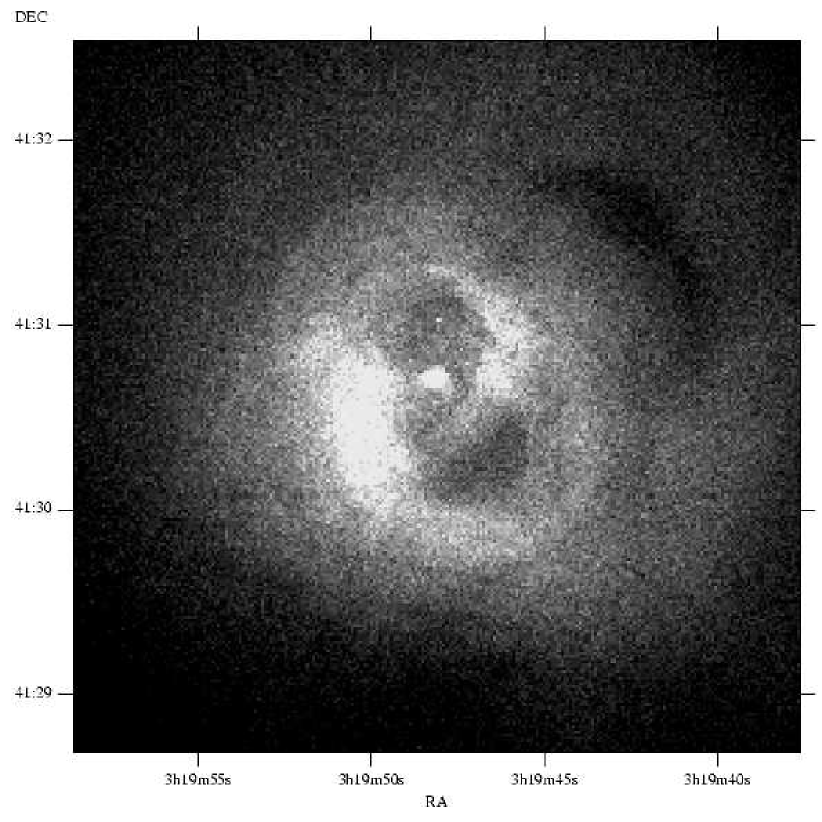
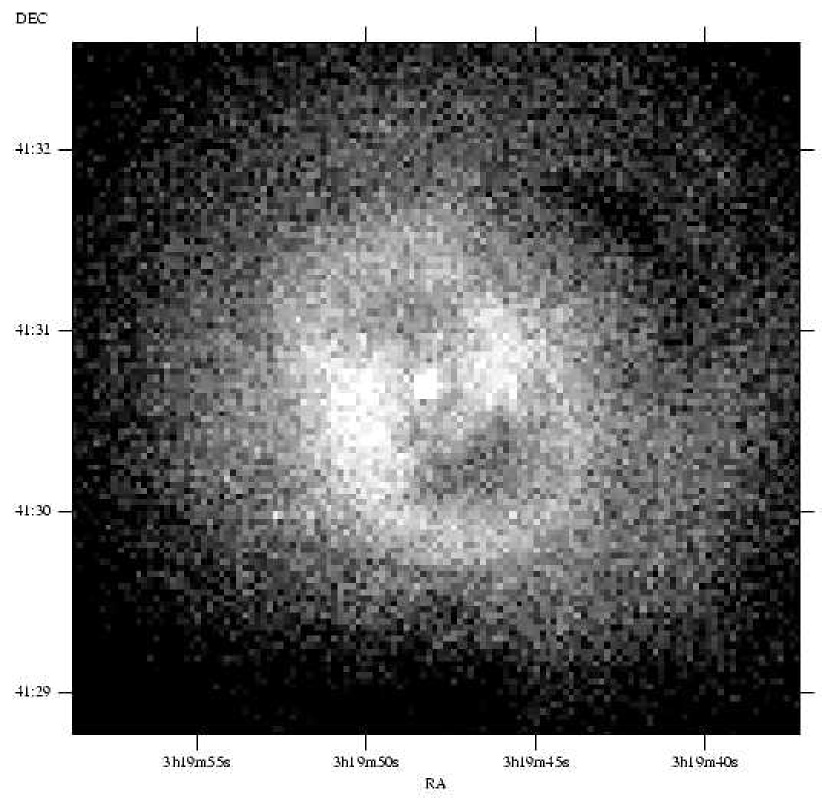
We show in Fig. 1 an image of the 0.3-1.5 keV emission from the central arcmin with 0.49 arcsec pixels. The image was corrected for two linear nodal structures (at position angle 80 deg near the top and the lower third of the image), by dividing by an exposure map generated using the ciao merge_all script. Similar images in the 1.5–3.5 and 3.5–7 keV bands are shown in Fig. 2, binned on 0.98 and 1.96 arcsec pixels respectively. The radio bubbles are surrounded by a thick region of hard X-ray emission (Fig. 3b) and by structured softer patches and rims (Figs. 1 and 8).
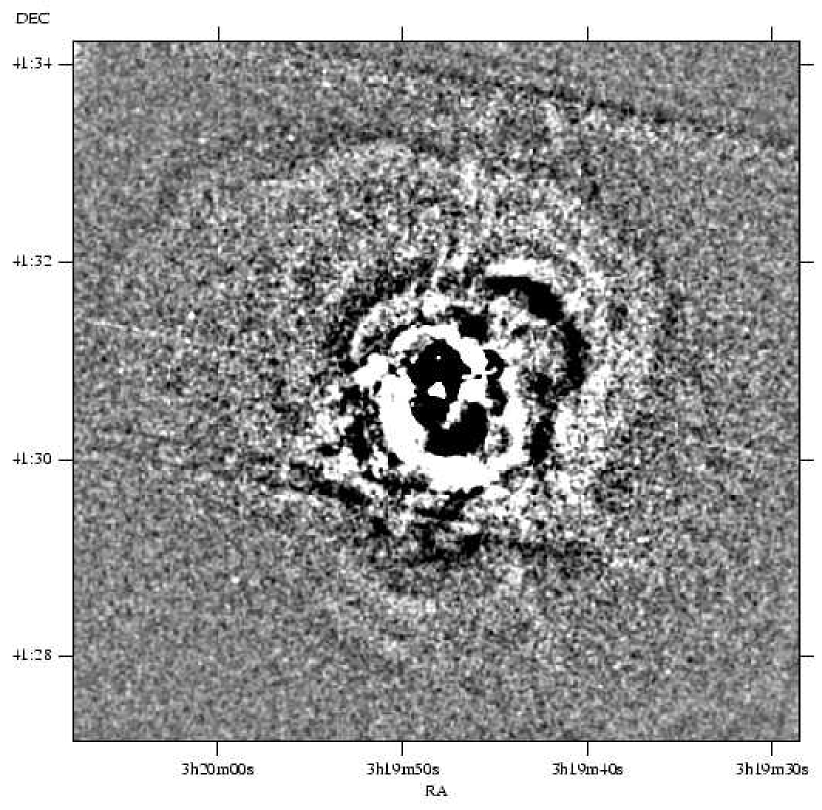
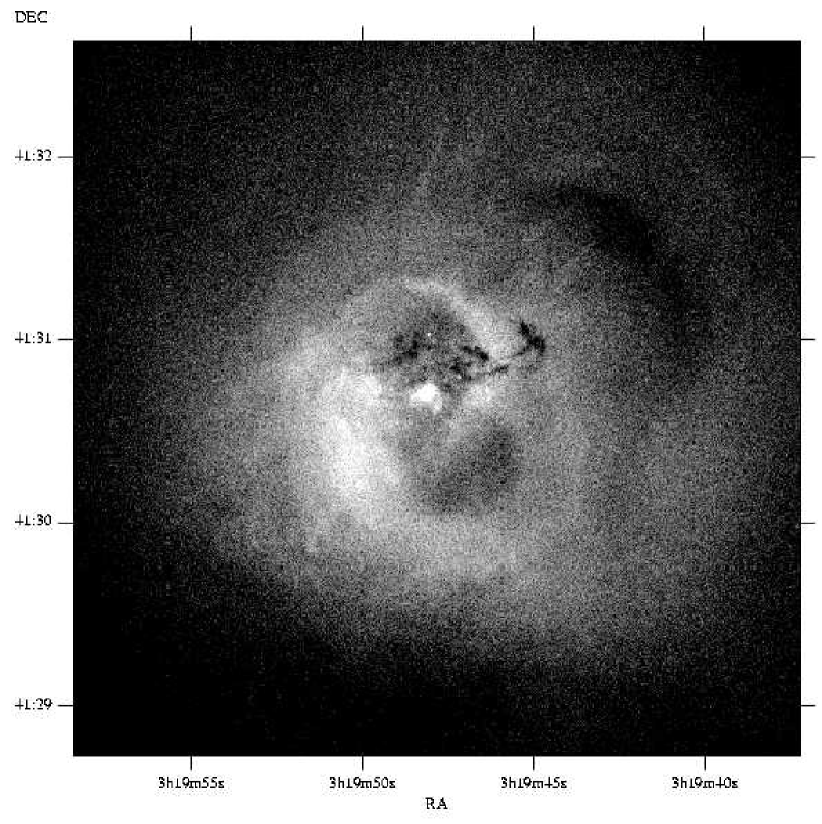
To reveal the larger scale structure in the cluster we used unsharp masking. A 0.3-7 keV exposure-map corrected image was smoothed with Gaussians of fixed width 0.98 arcsec and 9.8 arcsec, the two smoothed images were then subtracted, the result of which is shown in Fig. 3. Areas in which there were a deficit of counts relative to the larger-scale are shown as black, and areas which showed a surplus are shaded white. It can be seen that there are a number of ripple-like structures which lie outside of the outer radio lobes. We have investigated a range of smoothing lengths; the smaller one must be less than a few arcsec and the larger one about half a ripple wavelength. When their location is known, the ripples can be discerned by eye in the original raw image. The implication of the ripples is discussed in a later section.

To quantify the level of these fluctuations in the unsmoothed image we generated a radial profile between PAs 300 to , across the North-West (NW) outer radio lobe. The flux per pixel in 0.98 arcsec wide annuli is shown in Fig. 4. Between these angles, the positive maxima (relative to the local mean) of the fluctuations are at radii of and arcsec. We also show the profile to the NE, across the interesting, sharp-edged, emission region just outside rim of the inner N bubble. Its edge, or front, is at a radius of about 60 arcsec.
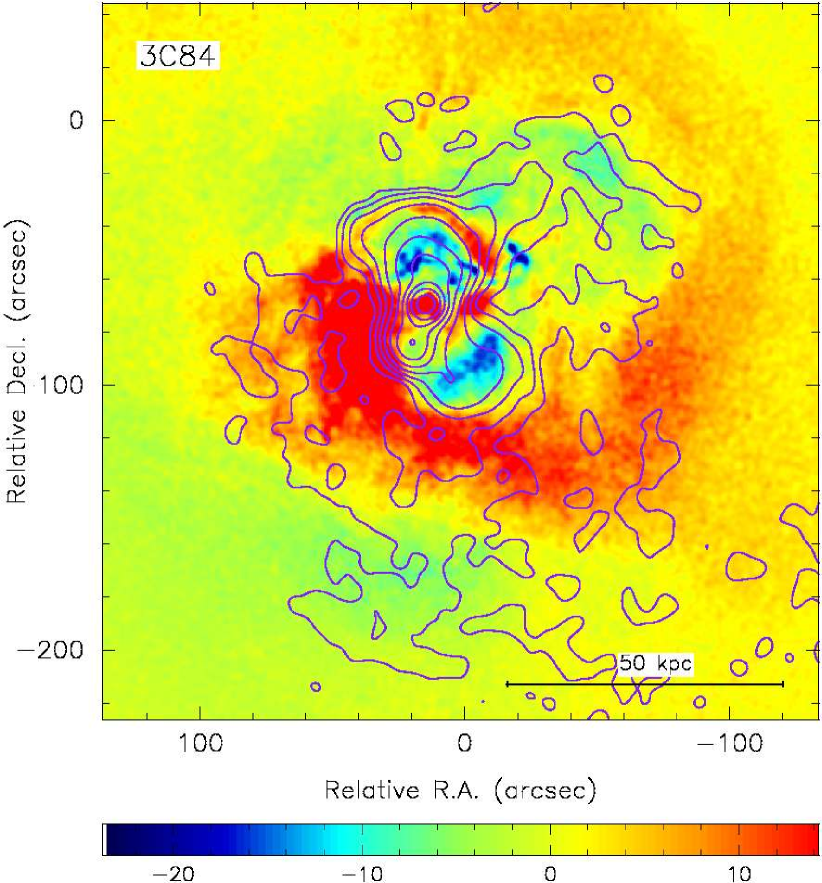
In Fig. 5 we show contours from the 328 MHz VLA image. This image has been made from combining VLA observations taken in the A, B and C configurations to produce an image with 8 arcsec resolution and good sensitivity to extended emission. To produce the deprojected X-ray image, the average contribution to the emission from outer shells was subtracted from the pixels within a pixel-width shell, assuming spherical symmetry around the central source. This procedure highlights non-radial features in the intensity map.
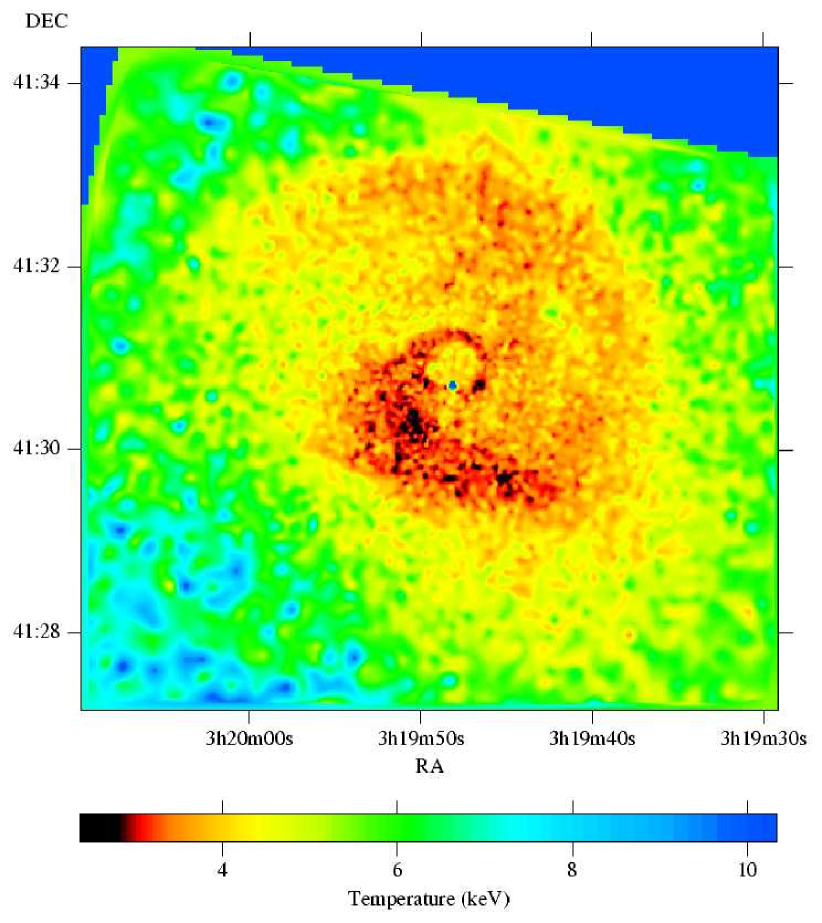
To create a temperature map of the cluster, we extracted spectra from regions containing counts between 0.5 and 7 keV (), produced using the bin-accretion algorithm of Cappellari & Copin (2003). The spectra were binned to contain at least 20 counts per spectral bin. The spectra were then fit between 0.5 and 7 keV with a mekal spectral model (Mewe, Gronenschild & van den Oord 1985; Liedahl, Osterheld & Goldstein 1995) absorbed by a phabs model (Balucinska-Church & McCammon 1992). When fitting the spectra, the temperature, abundance (assuming ratios of Anders & Grevesse 1989) and column density were allowed to be free. Ancillary-response matrices and response matrices were made using the ciao mkwarf and mkrmf programs, weighting the responses to regions based on the number of counts between 0.4 and 7 keV. The ancillary-response matrix was then corrected using the corrarf routine to correct for the ACIS low energy degradation111http://cxc.harvard.edu/cal/Links/Acis/acis/Cal_prods/qeDeg/, applying the acisabs absorption profile of Chartas & Getman (2002). When fitting, we used a background spectrum generated from a blank-sky observation in caldb for this period of observation.
Finally, we made a temperature map (Fig. 6) by smoothing the best-fitting temperatures (accurate to around 10 per cent, providing the spectral model is correct) using the natgrid natural-neighbour interpolation library222http://ngwww.ucar.edu/ngdoc/ng/ngmath/natgrid/nnhome.html, assuming the best-fitting temperature to lie at the centroid of each bin. The temperatures are emission-weighted, and not corrected for the effects of projection.
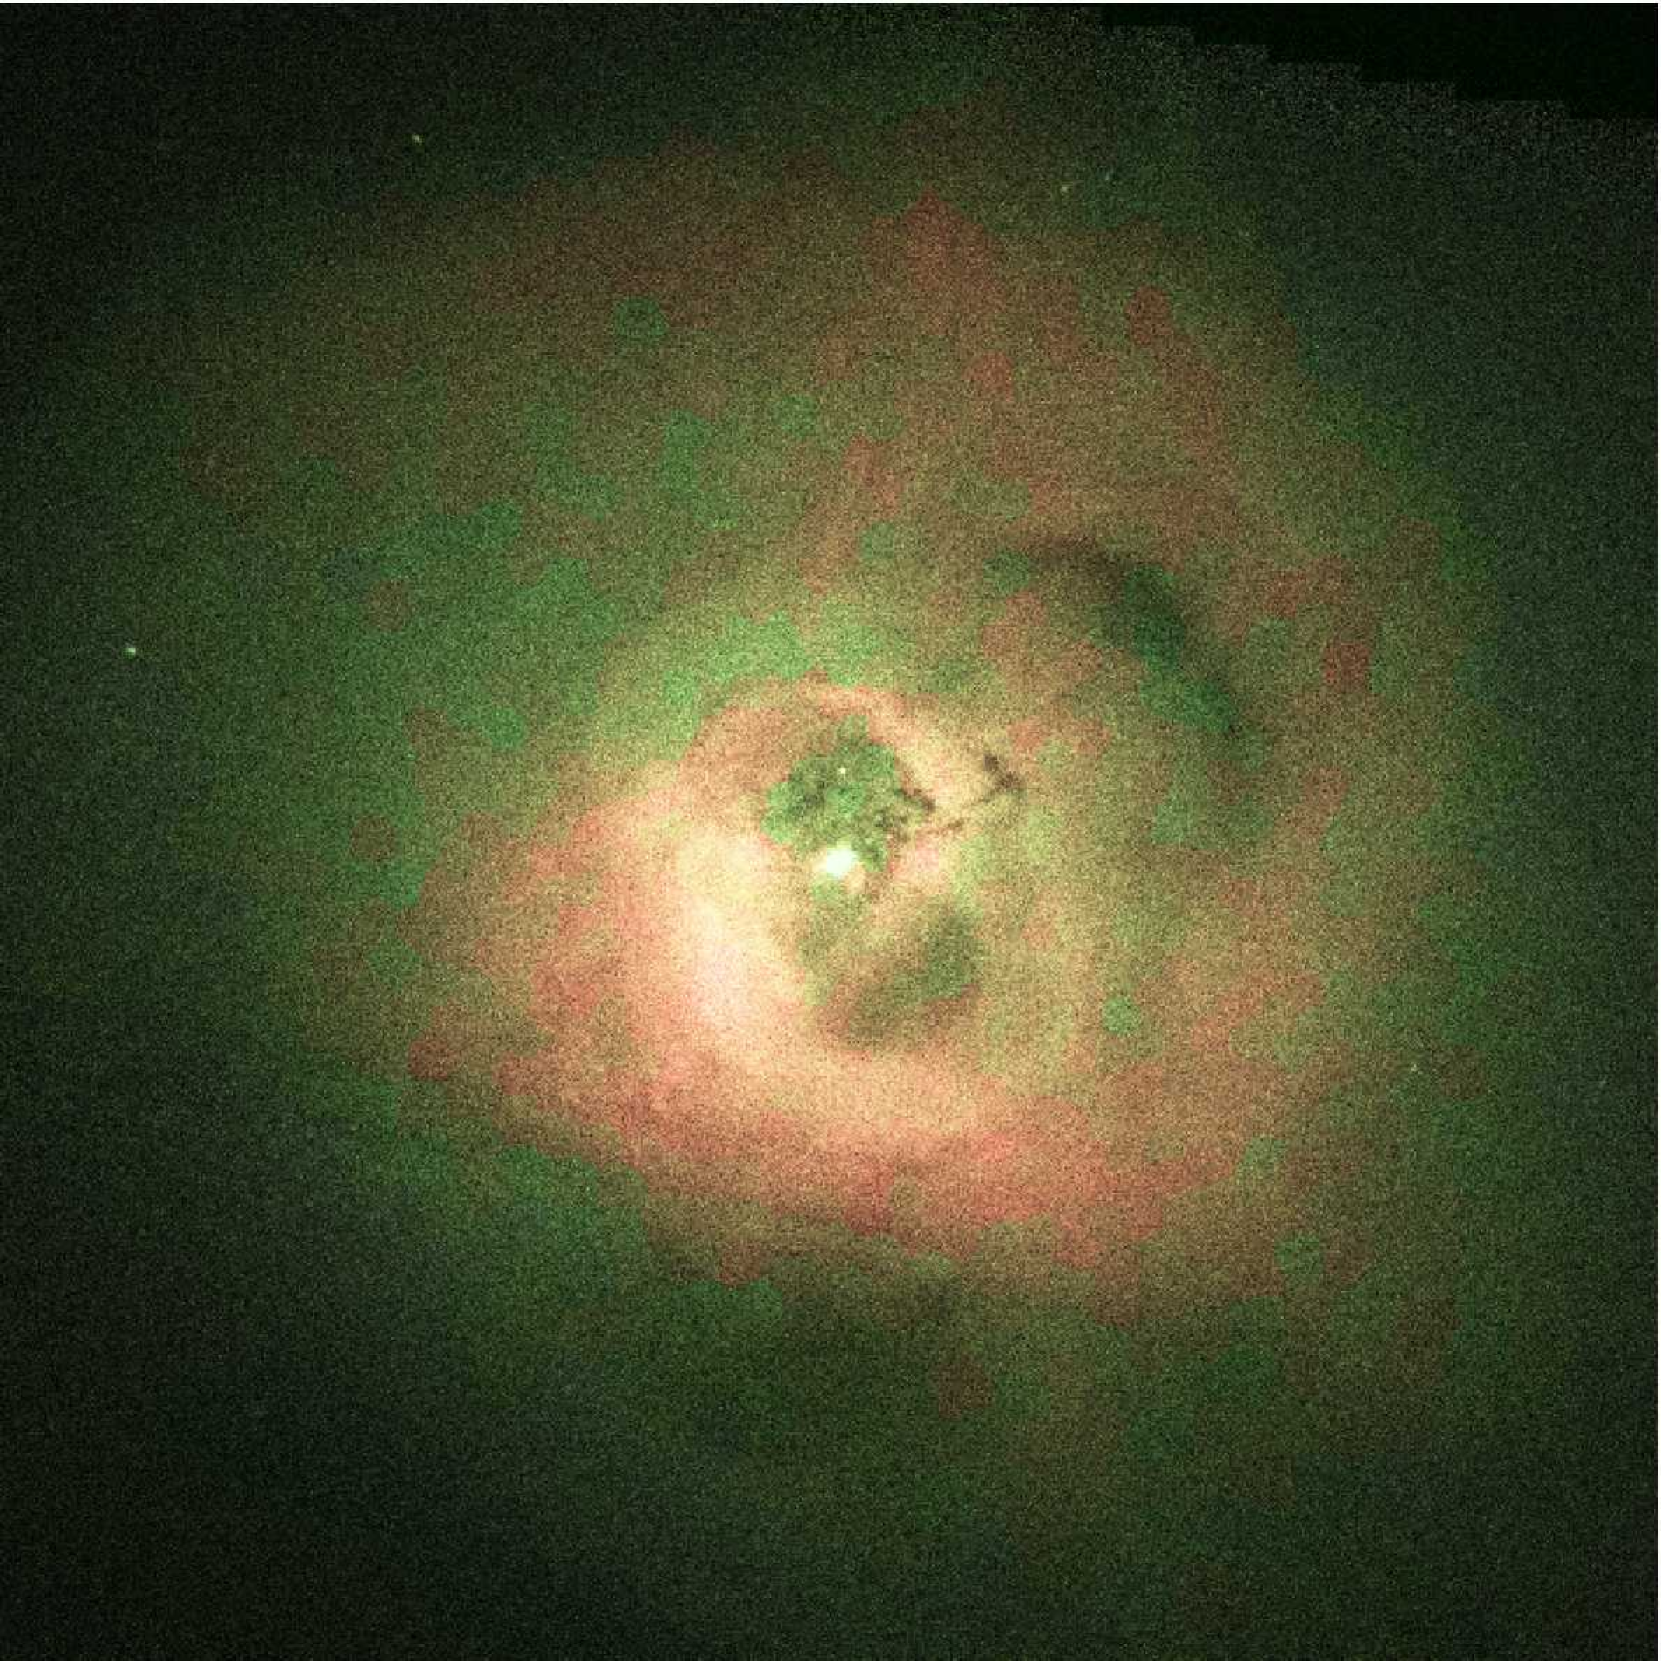
In order to demonstrate how the temperature of the cluster changes over its core, we show in Fig. 8 an intensity image of the cluster between 0.3 and 7 keV colour-coded using a temperature map. The temperature map was generated by fitting spectra to bins containing counts between 0.5 and 7 keV using the same procedure as above (temperatures accurate from 2 to 4 per cent). The lower temperature regions are coded red, rising through green, to the hotter blue regions (which are hard to see as the brightness of the object drops dramatically to the outer parts of the image).

3 Discussion
The swirl seen in the gross temperature structure is probably due to some angular momentum remaining from the merger history of the Perseus cluster (Fabian et al 2000; Churazov et al 2003; Motl et al 2003). Otherwise, apart from the ripples discussed below, the gas distribution beyond the obvious bubbles (2 inner and 2 outer) and their rims appears to be very smooth. No further bubbles are seen. The bubbles, discussed by Böhringer et al (1993), Churazov et al (2000) and Fabian et al (2000, 2002b), are inflated by the N-S radio jets from the nucleus of NGC 1275. When large enough they detach and rise buoyantly in the intracluster medium.
The ripples seen in the unsharp-masked image (Fig. 3) are intriguing. They appear to be quasi-spherical. A prominent inner one to the NE, immediately outside the northern bubble, has a sharpish edge. The surface brightness drops by about 20–30 per cent at its edge (Fig. 4). No obvious temperature or abundance changes occur at this point, so it is best explained as a density and pressure change. The amplitude of the first ripple outside the NW hole, which is about 50 per cent further out than the NE one, is much smaller at about 10 per cent (Fig. 4), and quantifying the other ripples is difficult.
If the ripples are pressure (sound) waves moving at constant speed (about for a temperature of 5 keV) then their separation (wavelength) of about 11 kpc means a period of about . If the power is constant, the energy flux where and are the gas pressure and density respectively, should drop with increasing radius as . Since the density of the intracluster medium drops approximately as in this region (Fabian et al 2000) then should vary as and the relative amplitude of ripples as (since the emissivity mainly depends on the density squared). The observed ripples appear to drop off faster than this, but a much deeper observation is required to confirm it.
The ripples or sound waves may disperse energy throughout the cooling region, which is one important criterion for a successful heat source with which to balance radiative cooling (Johnstone et al 2002; Fabian 2002). An important issue is whether they dissipate energy throughout this region or not. We have previously assumed that they do not (Fabian et al 2000). Begelman (2001) and Ruszkowski & Begelman (2002) assume that sound waves and small rising bubbles dissipate their energy on a pressure scale length in their effervescent model for heating but give no details of the mechanism. Churazov et al (2002) argue that rising bubbles are responsible for most of the heating.
First we note that ion viscosity can lead to dissipation of the sound energy within the core. Taking the simple formula of Lamb (1879, Hydrodynamics, also Landau & Lifshitz 1959), the distance over which the energy of a plane sound wave is reduced by is given by
where the wavelength sound speed and viscosity is taken to be (Spitzer 1962, Braginskii (1958). The ion density and temperature . Thus if the apparent wavelength of about 10 kpc is maintained then the waves dissipate much of their energy within the inner 100 kpc of the cooling region. The viscosity assumed here is high and may of course be significantly affected by magnetic fields in the gas, so the above estimate is uncertain. The H filaments around NGC 1275 do however provide evidence that the effective Reynolds number is low and therefore that the viscosity is high (Fabian et al 2003).
Heating will also result from the initial high amplitude of the sound waves, which makes them develop rapidly into weak shocks. The sound speed of the compressed gas is higher (by ) than that in the rarified part, so the wave will steepen in a few wavelengths. The sharp edge or front to the NE ripple (Fig. 1, 4 and 8) indicates that this disturbance is already a weak shock.
In order to study the NE front in detail we have looked carefully at the density profile in this direction. The density jump across the edge is best determined from a straight surface-brightness deprojection (e.g. Fabian et al 1981) and is shown in Fig. 7. The ratio of densities at the edge (inner/outer) is . The projected temperature map (Fig. 6) shows no marked temperature change in this region, although there are a few wisps of cooler gas (red in Fig. 6). There is therefore a large pressure increase going inward over the front and it is not a simple ’cold front’ (Markevich et al 2000); the inner region is at a higher pressure and the front must be expanding. This is the condition for a weak shock to form. Given the above density jump, continuity over the shock front implies that the temperature should jump by 28 per cent to about
To see whether the temperature does jump by this amount, we have deprojected the spectra from 3 radial zones within a sector across the front. Assuming a single temperature component within each zone we find that the temperature drops from to going inward across the edge. This is inconsistent with a weak shock, which should heat the gas, unless the gas in the inner region was already cooler or turbulence behind the shock is mixing in much cooler gas.
The addition of a some cooler gas in the innermost zone allows for hotter gas to be present. When added, there is a small reduction in , but it is too small to mean that it is statistically required. We obtain a limit on the volume filling fraction of a 5.8 keV component at 79 per cent (90 percent confidence level). Despite the high quality of our data we are therefore unable to measure the temperature jump at the NE front if there is more than a single (deprojected) temperature component present, even if it occupies more than half the volume.
Unfortunately this means that we have no temperature confirmation of the shock. However the sharp increase in density combined with the temperature measurements does mean that the inner region is at a higher pressure and should expand outward. The Mach number is 1.5 and the pressure increases by 84 per cent across the shock.
We note that the edge at the shock front is not perfectly sharp; the surface brightness decreases over about 5 arcsec or nearly 2 kpc (we estimate that up to half of this could be due to the point-spread function of the telescope at this off-axis location). This may indicate that the mean-free path, , is of that order meaning that the gas is viscous (if ). The front is also seen to the SW in Fig. 1 and shocked gas probably accounts for all the thick surround to the inner bubbles seen in the hardest image (Fig. 2b). Projection effects and the multicomponent nature of the emission preclude making any useful spectral analysis of the hotter component.
The above discussion assumes purely hydrodynamical processes. Magnetic fields and cosmic rays in the intracluster gas will complicate many issues, introducing several more wave modes and also tapping the shock energy (which could also contribute to the lack of an observed temperature jump). Particle acceleration will also contribute to the mini-halo radio source (Gitti et al 2002).
The rate of work is similar to that required to balance cooling if the bubbles are formed continuously over a Gyr or more at a mean rate of one per , i.e. the rate deduced from the ripple separation. If we assume that most of the work done on the surrounding gas in inflating each bubble propagates as a sound wave, then the energy of about 270 bubbles, each of 7 kpc radius, is needed to replace the energy radiated by the inner 50 kpc of the cluster, at which radius the radiative cooling time is . (A factor of 2 drop in pressure from 12 to 50 kpc is included in this estimate.) It takes to produce this number of bubbles if the production rate is on average the same as now. Therefore the rate of bubble production determined from the separation/wavelength of the ripples, is close to that required within 50 kpc in order to balance heating and cooling, provided that most of the sound energy is dissipated within that radius by strong viscosity and weak shocks. The bubbles, with the relativistic particles and magnetic fields contained within them, are assumed to rapidly rise beyond this region and become undetectable.
An important problem raised by the heating mechanism proposed here is the significant rims of cool gas around the bubbles. They may however just be a collection of cooler blobs which have been swept up and not shocked (Fabian et al 2001). Such blobs may be magnetically uncoupled from the hotter phase, and therefore not conductively evaporated, and are on a scale which is much smaller than the wavelength of the sound waves. This means that any pressure differences caused by these waves across vary more slowly than the internal sound crossing time and no shock occurs.
In summary, the deep Chandra observation of the Perseus cluster has revealed subtle ripples which could be the sound waves which transport and dissipate the energy of the bubbles which continuously form at the centre. The process is not due to effervescence of many small bubbles (Begelman 2002), to rare major eruptions (Kaiser & Binney 2002; Soker et al 2001) or to the buoyant bubbles themselves (Churazov et al 2001), but to a more continuous dissipation of acoustic energy as the (attached) bubbles grow. More study is needed to determine whether further heating is required at larger radii and whether this process can account for the heating in more luminous objects which (currently) do not have any major central radio source (e.g. A1835, Fabian et al 2002c; sound waves, generated in the outer hot gas by subcluster mergers, are refracted inward, Pringle 1989, by the denser core gas, and may provide the explanation here). The much-sought detailed connection between the active nucleus, which is possibly fuelled by the hot surrounding gas, and the required distributed heat source in the inner intracluster medium has come to light in the Perseus cluster.
Acknowledgements
We thank the referee and Jeremy Goodman for helpful comments and the Chandra Observatory team for such superb data. ACF, SWA and CSC thank the Royal Society for support.
References
- [1] Anders E., Grevesse N., 1989, Geochimica et Cosmochimica Acta, 53, 197
- [2] Balucinska-Church M., McCammon D., 1992, ApJ, 400, 699
- [3] Basson J.F., Alexander P., 2003, MNRAS, 339, 353
- [4] Begelman M.C., 2002, in Gas & Galaxy Evolution, ASP Conference Series Vol. 240, J.E. Hibbard, M.P. Rupen and J.H. van Gorkom, eds. (San Francisco: Astron. Soc. Pacific, 2001), 363
- [5] Bertschinger E., Meiksin A., 1986, ApJ, 306, L1
- [6] Böhringer H., Voges W., Fabian A.C., Edge A.C., Neumann D.M., 1993, MNRAS, 264, L25
- [7] Böhringer H., Matsushita K., Churazov E., Ikebe Y., Chen Y., 2002, A&A, 382, 804
- [8] Braginskii S.L., 1958, Sov. Phys., JETP, 6, 358
- [9] Brighenti F., Mathews W.G., 2003, ApJ, 587, 580
- [10] Brüggen M., Kaiser C.R., 2001, MNRAS, 325, 676
- [11] Cappellari M., Copin Y., MNRAS, 2003, in press, astro-ph/0302262
- [12] Chartas G., Getman K., 2002, http://www.astro.psu.edu/users/chartas/xcontdir/xcont.html
- [13] Churazov E., Forman W., Jones C., Böhringer H., 2000, A&A, 356, 788
- [14] Churazov E., Brüggen M., Kaiser C.R., Böhringer H., Forman W., 2001, ApJ, 554, 261
- [15] Churazov E., Sunyaev R., Forman W., Böhringer H., 2002, MNRAS, 332, 729
- [16] Churazov E., Forman W., Jones C., Böhringer H., 2003, submitted to ApJ, astro-ph/0301482
- [17] Conselice C.J., Gallagher J.S., Wyse R.F.G., 2001, AJ, 122, 2281
- [18] Fabian A.C., Hu E.M., Cowie L.L., Grindlay J., 1981, ApJ, 248, 47
- [19] Fabian A.C., 1994, ARA&A, 32, 277
- [20] Fabian A.C. et al., 2000, MNRAS, 318, L65
- [21] Fabian A.C., Fabian A.C., Mushotzky R.F., Nulsen P.E.J., Peterson J.R., 2001, MNRAS, 321, L20
- [22] Fabian A.C., Voigt L.M., Morris R.G., 2002a, MNRAS, 335, L71
- [23] Fabian A.C., Celotti A., Blundell K.M., Kassim N.E., Perley R.A., 2002b, MNRAS, 331, 369
- [24] Fabian A.C., Allen S.W., Crawford C.S., Johnstone R.M., Morris R.G., Sanders J.S., Schmidt R.W., 2002c, MNRAS, 332, L50
- [25] Fabian A.C., Sanders J.S., Crawford C.S., Conselice C.J., Gallagher J.S., Wyse R.F.G., 2003, MNRAS, submitted
- [26] Gitti M., Brunetti G., Setti G., A&A, 2002, 386, 456
- [27] Kaiser C.R., Binney J., 2002, MNRAS, 338, 837
- [28] Johnstone R.M., Allen S.W., Fabian A.C., Sanders J.S., 2002, MNRAS, 336, 299
- [29] Lamb H., 1879, Hydrodynamics, Camb. Univ. Press
- [30] Landau L.D., Lifshitz E.M., 1959, Fluid Dynamics, Pergamon Press
- [31] Liedahl D.A., Osterheld A.L., Goldstein W.H., 1995, ApJ, 438, L115
- [32] Lynds R., 1970, ApJ, 159, L151
- [33] Markevitch M., et al 2000, ApJ, 541, 542
- [34] Mewe R., Gronenschild E.H.B.M., van den Oord G.H.J., 1985, A&AS, 62, 197
- [35] Morris R.G., Fabian A.C., 2003, MNRAS, 338, 824
- [36] Motl P.M., Burns J.O., Loken C., Norman M.L., Bryan G., 2003, ApJ, in press, astro-ph/0302427
- [37] Narayan R., Medvedev M.V., 2001, ApJ, 562, L129
- [38] Pedlar A., Ghataure H.S., Davies R.D., Harrison B.A., Perley R., Crane P C., Unger S.W., 1990, MNRAS, 246, 477
- [39] Peterson J. et al., 2001, A&A, 365, L104
- [40] Peterson J. et al., 2002, ApJ, astro-ph/0210662
- [41] Pringle J.E., 1989, MNRAS, 239, 474
- [42] Quilis V., Bower R.G., Balogh M.L., 2001, MNRAS, 328, 1091
- [43] Reynolds C.S., Heinz S., Begelman M.C., 2001, ApJ, 549, L179
- [44] Ruszkowski M., Begelman M.C., 2002, ApJ, 581, 223
- [45] Schmidt R.W., Fabian A.C., Sanders J.S., 2002, MNRAS, 337, 71
- [46] Soker N., White R.E., David L.P., McNamara B.R., 2001, ApJ, 549, 832
- [47] Spitzer L., 1962, The Physics of Fully Ionized Gases, Interscience Publishers
- [48] Tabor G., Binney J., 1993, MNRAS, 263, 323
- [49] Tamura T. et al., 2001, A&A, 365, L87
- [50] Tucker W., Rosner R., 1983, ApJ, 267, 547
- [51] Voigt L.M., Schmidt R.W., Fabian A.C., Allen S.W., Johnstone R.M., 2002, MNRAS, 335, L7
- [52] Zakamska N.L., Narayan R., 2003, ApJ, 582, 162