Is the Pre-WMAP CMB Data Self-consistent?
Abstract
Although individual observational groups vigorously test their data sets for systematic errors, the pre-WMAP CMB observational data set has not yet been collectively tested. Under the assumption that the concordance model is the correct model, we have explored residuals of the observational data with respect to this model to see if any patterns emerge that can be identified with systematic errors. We found no significant trends associated with frequency, frequency channels, calibration source, pointing uncertainty, instrument type, platform and altitude. We did find some evidence at the to level for trends associated with angular scale ( range) and absolute galactic latitude. The slope of the trend in galactic latitude is consistent with low level galactic contamination. The residuals with respect to may indicate that the concordance model used here needs slight modification. See Griffiths & Lineweaver (2003) for more detail.
1 Motivation and Method
The ever-tightening network of constraints from CMB and non-CMB observations favors a concordant cold dark matter (CDM) model that is commonly accepted as the standard cosmological model. As long as the systematic errors associated with CMB observations are small, the CMB power spectrum can play an increasingly large role in establishing and refining this model. Thus, it is crucial to check the CMB data for possible systematic errors in as many ways as possible.
Systematic errors and selection effects are notoriously difficult to identify and quantify. Calibration and/or beam uncertainties dominate CMB measurements and there may be lower level systematic errors of which we are not aware. Individual experimental groups have developed various ways to check their CMB observations for systematic effects (e.g. Kogut et al., 1996; Miller et al., 2002), including the use of multiple calibration sources, multiple frequency channels and extensive beam calibrating observations. Internal consistency is the primary concern of these checks.
Testing for consistency with other CMB observations is another important way to identify possible systematic errors. When the areas of the sky observed overlap, this can be done by comparing CMB temperature maps (e.g. Ganga et al., 1994; Lineweaver et al., 1995; Xu et al., 2001). When similar angular scales are being observed one can compare power spectra (e.g. Sievers et al. 2002). and, for example, check for frequency-dependent discrepancies (Odman 2003).
To calibrate a data set, one needs a trusted external calibrator. In this work we take the point of view that the CDM concordance model, that has emerged over the past 5 years due to its compatibility with dozens of observations with independent systematic errors, can be used as a calibrator. These independent observations are the Hubble Key Project constraint on (Freedman et al 2001), the constraints from observations of type Ia supernovae (Riess et al. 1998, Perlmutter et al. 1999), big bang nucleosynthesis constraints on the baryon content (Burles et al. 2001), and large scale structure constraints on the amplitude and shape of the matter power spectrum from the 2-degree Field Galaxy Redshift Survey (Peacock et al. 2001). Recent joint likelihood analyses of this data and the CMB (as summarized in Griffiths & Lineweaver 2003) suggest the observationally concordant cosmology; , (), , and with , and taken to be zero.
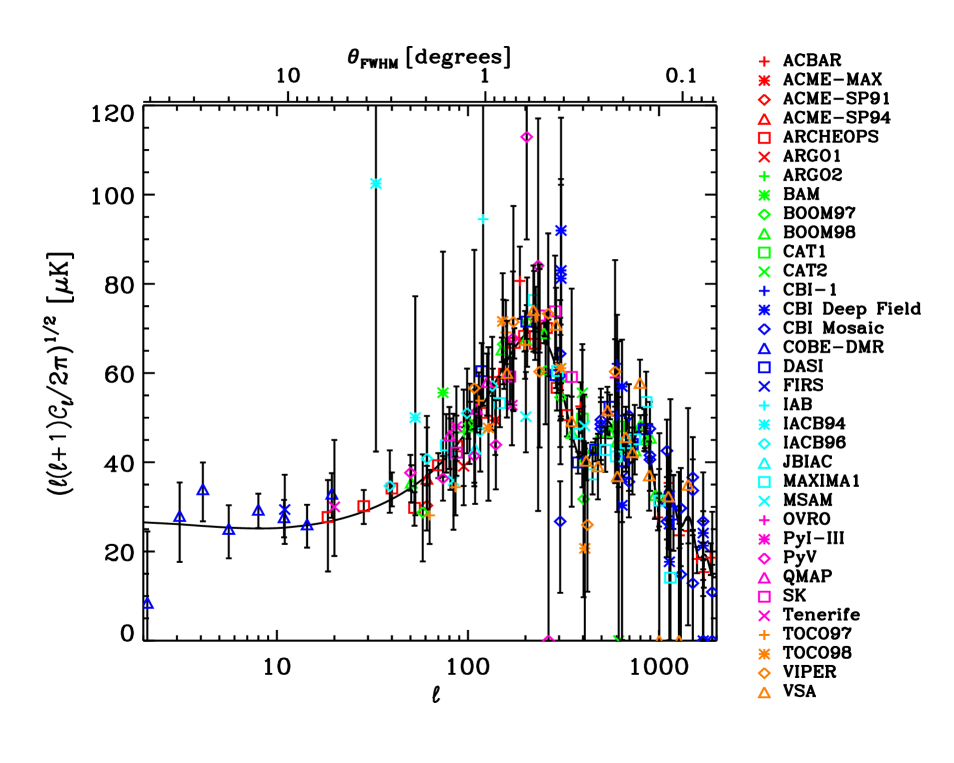
Our analysis is based on the assumption that the combined cosmological observations used to determine the concordance model are giving us a more accurate estimate of cosmological parameters, and therefore of the true spectrum, than is given by the CMB data alone. Under this assumption, the residuals of the individual observed CMB band powers and the concordance CDM model become tools to identify a variety of systematic errors. We look for any linear trends that may identify systematic effects that are correlated with the details of the observations.
A prerequisite for the extraction of useful estimates for cosmological parameters from the combined CMB data set is the mutual consistency of the observational data points. However, for the sake of a clean interpretational story, systematic errors in a data set are sometimes ignored or explained away. David Wilkinson was fond of explicitly showing the systematic errors, or warts as he called them, in his data. In a similar spirit we went looking for warts in the pre-WMAP data.
2 Discussion and Summary
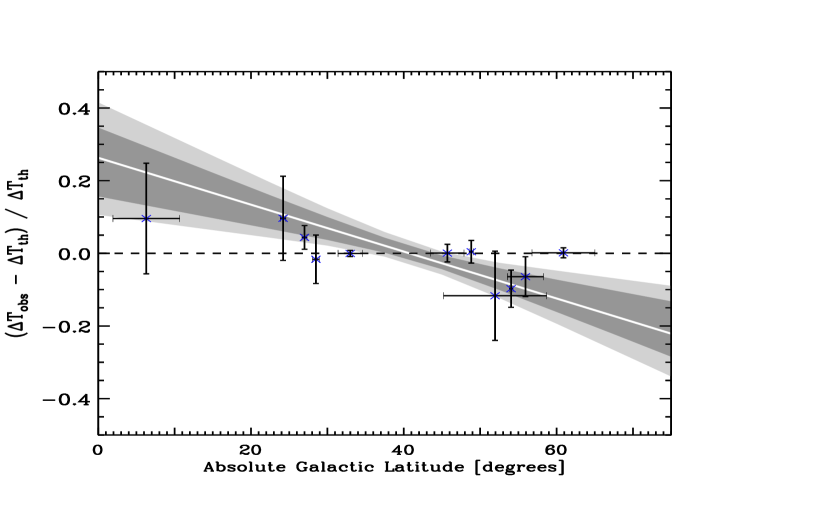
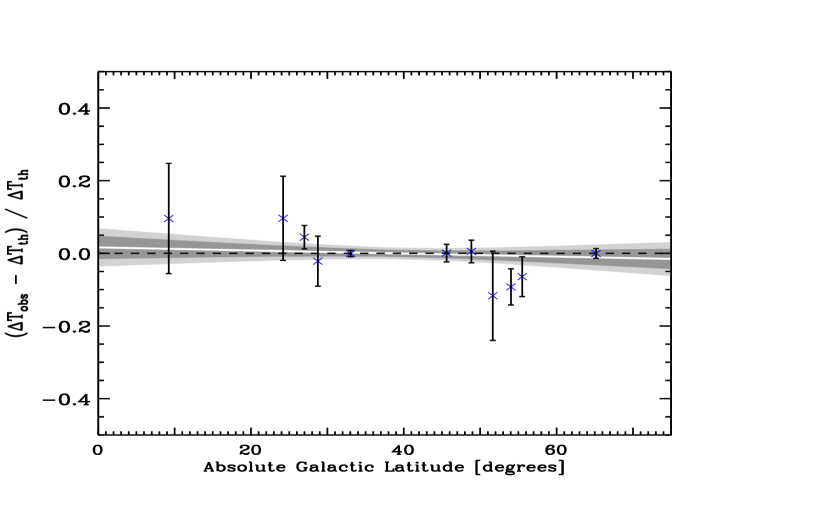
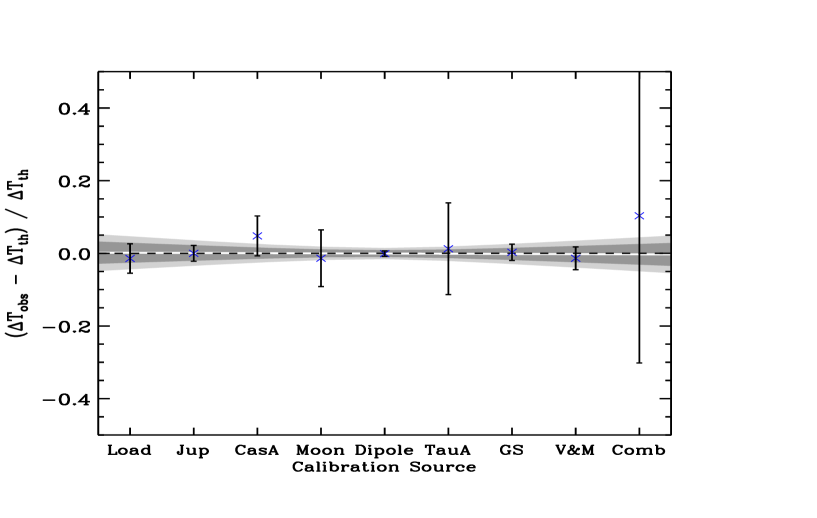
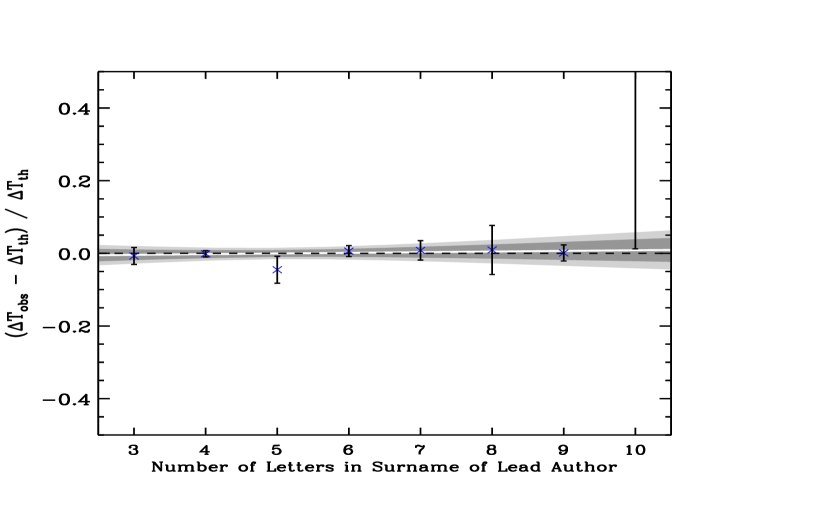
We have performed linear fits on the residual data with respect to angular size (), galactic latitude, frequency, frequency channels, frequency bandwidth, galactic longitude, instrument type, platform and altitude, pointing uncertainty and area of sky observed (Griffiths & Lineweaver 2003). For the majority, we find little or no evidence for any trend. The most significant linear trend observable in the residuals is with respect to the absolute galactic latitude of the observations. The top panel of Fig. 3 shows a linear trend that is inconsistent at more than 95% confidence with a zero gradient line through the residuals. This trend is not eliminated by the removal of any one experiment and may be indicative of a source of galactic emission that has not been appropriately treated. The best-fit line to the data suggests that CMB observations made closer to the galactic plane may be over-estimated by approximately 2%. The weighted average of points with is , while it is for . If this is due to galactic contamination, then the normalization Q10 may have to be reduced or by from K to K. A more detailed analysis of galactic dust and synchrotron maps may reveal the source of this trend.
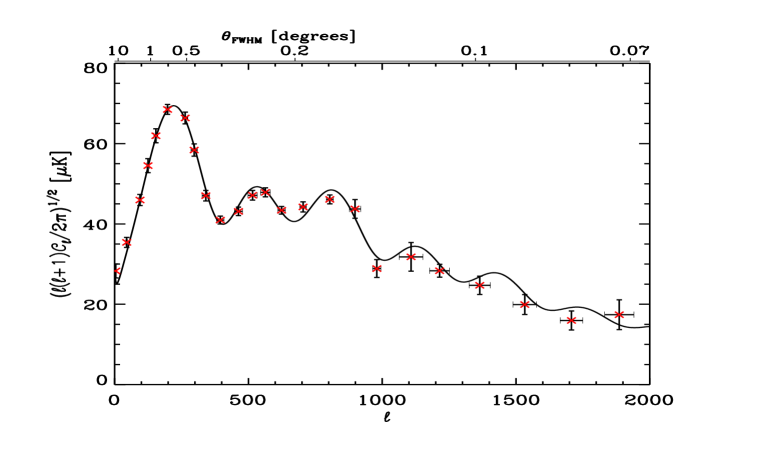
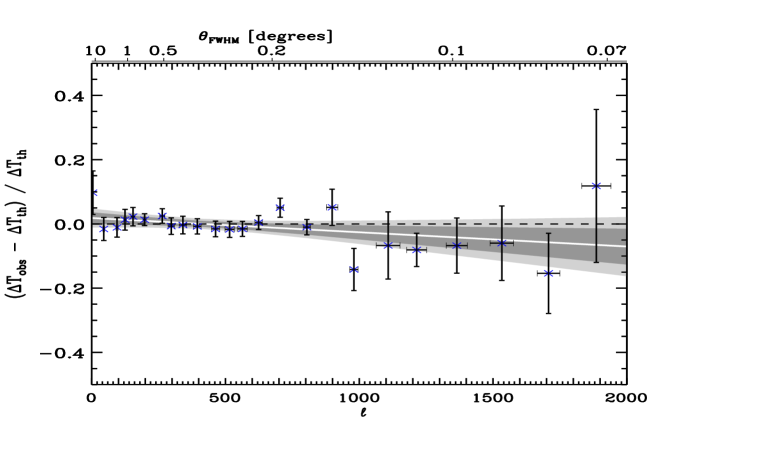
At the level of to we find trends in the residuals with respect to (angular size). Figure 2 indicates that the 6 bins between prefer a lower normalization. This could be due to underestimates of beam sizes or pointing uncertainties or unidentified beam smearing effects at high for small beams. Although we see no significant evidence for trends associated with beam size or pointing uncertainty, limiting the pointing uncertainty analysis to the 5 points with the largest uncertainties yields a trend, suggesting that the largest pointing uncertainties may have been underestimated.
To analyze various experiments, knowledge of the calibration uncertainty of the measurements is necessary. Independent observations that calibrate off the same source will have calibration uncertainties that are correlated at some level and therefore a fraction of their freedom to shift upward or downward will be shared. In this analysis we have marginalized over the calibration uncertainties associated with the observations, treating them as independent free parameters with Gaussian distributions about their nominal values.
Over the past 10 years, successive independent and semi-independent data sets have extended the angular scale, calibration precision and freedom from galactic contamination of the CMB power spectrum. The WMAP measurements (Bennett et al. 2003) are a milestone in this direction. More WMAP data and the results of other CMB experiments are eagerly awaited. Each CMB measurement contains useful cosmological information and no data set is immune to contamination. It is therefore important to compare data sets and check for systematics. Our results indicate that the pre-WMAP data set is consistent with the concordant model although the model seems to need slight modifications around the scale of the first peak and at high (Fig. 2). We find no significant evidence for inter-experiment inconsistencies other than an indication of low-level galactic contamination (Fig. 3). We are now extending our analysis to include the WMAP data.
LMG thanks Martin Kunz for useful discussions and is grateful to the University of Sussex where part of the work was carried out. LMG acknowledges support from the Royal Society and PPARC. CHL acknowledges a research fellowship from the Australian Research Council.
References
- Bennett et al. (2003) Bennett, C.L.et al. 2003, Astrophys. J. Lett. submitted astro-ph/0302207
- Burles et al. (2001) Burles, S., Nollett, K.M. & Turner, M.S., 2001, Astrophys. J. Lett. 552, L1
- Freedman et al. (2001) Freedman, W.L. et al., 2001, Astrophys. J., 553, 47
- Ganga et al. (1994) Ganga K., Page L., Cheng E. & Meyer S., 1994, Astrophys. J. Lett., 432, L15
- Griffiths & Lineweaver (2003) Griffiths, L. & Lineweaver, C.H. 2003 astro-ph/0301490
- Kogut et al. (1996) Kogut, A. et al., 1996, Astrophys.J., 470, 653
- Lineweaver et al. (1995) Lineweaver, C.H. et al., 1995, Astophys. J., 448, 482
- Linewaver & Barbosa (1998) Lineweaver, C.H. & Barbosa, D., 1998, Astrophys. J., 496, 624
- Miller et al. (2002) Miller, A. et al., 2002, Astrophys. J., 140, 115
- Odman (2003) Odman, C.J. New Astronomy Reviews, Proceedings of the CMBNET Meeting, 20-21 February 2003, Oxford, UK astro-ph/0305254
- Peacock et al. (2001) Peacock, J.A. et al., 2001, Nature, 410, 169
- Perlmutter et al. (1999) Perlmutter, S. et al., 1999, Astrophys. J., 517, 565
- Riess et al. (1998) Riess, A.G. et al., 1998, Astron. J., 116, 1009
- Sievers et al. (2002) Sievers, J.L. et al., 2002, Astrophys. J., submitted, 0205387
- Xu et al. (2001) Xu, Y. et al., 2001, Phys. Rev. D, 63, 10, 103002