Chapter 1 Observation of M87 with the Whipple 10m telescope
Abstract
The Whipple 10-m telescope was used to observe M87 since 2000. No significant gamma-ray signal was found and upper limits compared to the HEGRA detection suggest the source may be variable. We found weak evidence for a correlation with the X-ray activity in 2000-2001 but this tendency did not persist in 2002-2003.
1. Introduction
The giant radio galaxy M87 has been proposed as a gamma-ray emitting candidate through various mechanisms. At a distance of only 16Mpc, the central region is driving a very extended jet [12] probably powered by accretion onto the central super massive [9] black hole. The high energy jet has been considered as a possible source of gamma rays. Bai & Lee [4] predicted a gamma-ray flux at a detectable level. Very recently, Protheroe et al. 2002, gave a range of gamma-ray flux predictions in the context of the Synchrotron Blazar Model. In both cases, M87 is considered as a misaligned BL-Lac object. In the case of M87, the jet is seen at an angle of [6] and the detection of gamma rays from M87 would open up a new class of AGN for TeV studies. M87 is also interesting as a potential source of Ultra High Energy Cosmic Rays. It was suggested that most cosmic rays with energies larger than could be coming from M87 after having been deflected by our galactic wind [2]. M87 has also been proposed as a target toward which one could search for gamma-rays from annihilating super-symmetric dark matter[5].
2. Observation with the Whipple 10-m telescope
M87 has been recently observed both by the HEGRA collaboration and by the Whipple 10-m telescope collaboration. Both collaborations originally reported upper limits [8,11]. The HEGRA collaboration, after applying a more sensitive analysis method, recently reported a standard deviation () detection above [1]. The HEGRA observations (83.4 hours) were carried out before 2000. The original Whipple 10-m upper limit came from observations in 2000 and 2001. We continued observing M87 in 2002 and 2003. In total we have now 29 hours of data accumulated over the last four years. The standard analysis with a range of energy thresholds was applied to this data set. No significant excess was found and upper limits were derived.

This is compared to the detection by HEGRA on figure 1. The disagreement is marginal, but it suggests that the gamma-ray activity of M87 may have reduced since the HEGRA observations taken mostly in 1999. We note that the 2000-2001 data shows a excess.
3. Correlation between gamma rays and X-rays
For each 28 minute run taken in the direction of M87 from 2000 until 2003 we recorded the one day average rate measured with ASM (http://xte.mit.edu). The data set was subdivided into two sub-sets corresponding to the periods 2000-2001 (34 runs) and 2002-2003 (30 runs). On figure 2, the gamma-ray rate is shown for each run as a function of the X-ray rate for the two subsets. We noticed that some of the points with the largest X-ray rates have abnormally large error bars, making the X-ray detection low in significance. These points are shown in dashed lines on figure 2 and were eliminated from this preliminary analysis as they result from dwell numbers of less than 5 while corresponding to more than 2 . It must be stressed that no single run shows a significant gamma-ray excess. Nevertheless it seems that the small excess observed in 2000-2001 results mostly from the runs obtained on days for which the average ASM X-ray rates were significantly the highest. The curve superimposed on figure 2 is an eye-ball fit of a quadratic function to guide the eye. The correlation coefficient [3] resulting from the 2000-2001 points is while it is only in 2002-2003.
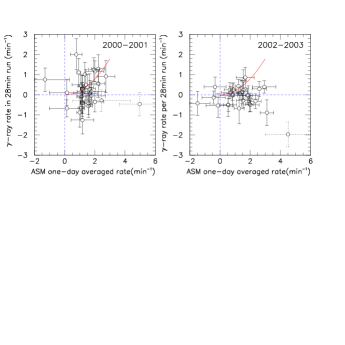
The average X-ray rate in the 2000-2001 data set is . We constructed the distribution of the angle for runs taken on days on which the X-ray rate was smaller (16 runs) and respectively larger (15 runs) than . When M87 was in a low X-ray state we record a excess while we observe a excess when the source was in a higher X-ray state. This indication of correlation has been a strong motivation for prolonging our observation program in 2002 but we could not confirm this tendency with the data we recorded in 2002 and 2003.
4. Conclusion
The 29 hours of data accumulated in the direction of M87 during the last 4 years do not show any significant gamma-ray excess. The upper limits we derived suggest that the gamma-ray activity may have decreased since it was observed and detected by the HEGRA collaboration in 1998 and 1999. A small excess () is noticeable in the data recorded in 2000 and 2001 with a weak positive correlation with the X-ray activity in M87 as measured by ASM. This could not be confirmed in our 2002-2003 data which does not show any noticeable excess while the activity in M87 core and jet was higher [10,13]. If the 2000-2001 excess were interpreted as a gamma-ray signal, the absence of excess in 2002-2003 could be seen as resulting from an absorption by the infra-red radiation emitted by the heated low temperature torus as suggested by Donea and Protheroe [15].
5. Acknowledgments
We acknowledge the technical assistance of E. Roache and J. Melnick. This research is supported by grants from the U.S. Department of Energy, by Enterprise Ireland and by PPARC in the UK.
6. References
1. Aharonian et al., 2003, subm. to Astron. and Astrophys., astro-ph/0302155
2. Ahn, E., et al., 1999, astro-ph/9911123
3. T. Alexander, 1997, in Astronomical Time Series, Eds. D. Maoz, A. Sternberg, and E.M. Leibowitz, (Dordrecht: Kluwer), 163.
4. Bai, J.M., and Lee, M.G., 2001, ApJ, 549, L173.
5. Baltz, E.A., et al., 2000, Phys. Rev. D61 023514
6. Bicknell,G.V., and Begelman, M.C., 1996, ApJ, 467,597.
7. Donea, A.C., and Protheroe, R.J., 2003, astro-ph/0303522
8. Götting et al., 2001, Proc. of the 27th ICRC, OG 2.3.199, Vol 7, 2669.
9. Harms, R.J., et al., 1994, ApJ, 435, L35.
10. Harris, D.E., 2003, astro-ph/0302290.
11. LeBohec et al., 2001, Proc. of the 27th ICRC, OG 2.3.191, Vol 7, 2643.
12. Owen, F.N., et al., 2000, ApJ, 543,611.
13. Perlman, E., et al., Central Bureau for Astronomical Telegrams, Circ. No. 8075
14. Protheroe, R.J., et al., 2002 subm. to Astropart.Phys., astro-ph/0210249.
15. Donea, A.C., and Protheroe, R.J., 2003, astro-ph/0303522