Chapter 1 Observations of H1426+428 from 1999 to 2002 with The Whipple Observatory 10 m Telescope
Abstract
The BL Lacertae object H1426+428 is the most distant, confirmed source of TeV gamma rays. At a redshift of 0.129, its detection at TeV energies has important implications for estimating the density of the extragalactic infra-red background radiation. H1426+428 was observed extensively during the 2001/2002 observing season with the Whipple 10 m gamma-ray telescope. The results of these observations are presented here and are combined with the results of previous observations made between 1999 and 2001 at Whipple.
1. Introduction
First discovered in the 2-6 keV band by HEAO 1 [12], and classified as a BL Lacertae type object in 1989 [11], H1426+428 (H1426) has recently been classified as an “extreme” blazar because the peak of its synchrotron emission occurs at energies greater than 100 keV. Such blazars are prime candidates for TeV emission if they have a sufficient level of soft seed photons [5]. Indeed, H1426 was among four blazars singled out by Costamante et al. [4] as likely TeV emitters. This prediction was borne out when H1426 was detected in the VHE band by Whipple in 2000 [8]. This detection was subsequently confirmed by other ground-based atmospheric Čerenkov experiments [1,7] firmly establishing H1426 as a source of TeV gamma rays. Since then, many observations of H1426 have been carried out at TeV energies. Information about its energy spectrum have been derived [1,10], and the implications that its detection has on the density of the extragalactic IR background have been discussed [6,10]. In this paper, the Whipple observations of H1426 between 1999 and 2002 are summarised.
2. Observations
H1426 had been observed extensively with the Whipple telescope since March 1999 when the first evidence for a VHE signal was seen [8]. Throughout this time, the sensitivity of the Whipple instrument varied due to changes in camera configuration, mirror reflectivity, triggering conditions and pointing accuracy. The main characteristics of the instrument during this time period are summarised in Table LABEL:009123-2:camera A combined total of 110.5 useful hours of H1426 data were taken in both the PAIRS and the TRACKING modes [3] at Whipple during the 2001/2002 observing season; these are summarised in Table 2.
| Observing | Number | Spacing | FOVa | Epeakb |
|---|---|---|---|---|
| Season | of Pixels | [deg] | [deg] | [GeV] |
| Mar. 1999 - Jun. 1999 | 331 | 0.24 | 4.8 | 500 |
| Sep. 1999 - Jul. 2000 | 490 | 0.12c | 3.8d | 430 |
| Oct. 2000 - Jun. 2001 | 490 | 0.12c | 3.8d | 390 |
| Oct. 2001 - Jul. 2002 | 490 | 0.12c | 3.8d | 400 |
a Field of View [FOV].
b The peak response energy; this is the energy at which the
collection area folded with an E-2.5 spectrum reaches a maximum.
c The spacing between the outer tubes is 0.24∘.
d The outer ring of tubes was not used in this analysis, hence the
FOV here is effectively 2.6∘.
| Observation Mode: | PAIRS | TRACKINGa |
| No. ON source scans taken: | 91 | 326 |
| No. ON source scans included in this analysis: | 73 | 247 |
| Total useful exposure [hrs]: | 33.3 | 110.5 |
| Total significance []: | 2.1 | 2.4 |
a All data taken ON source are included here, i.e. ON source
data taken in the PAIRS mode and data taken in the TRACKING mode.
3. Results and Discussion
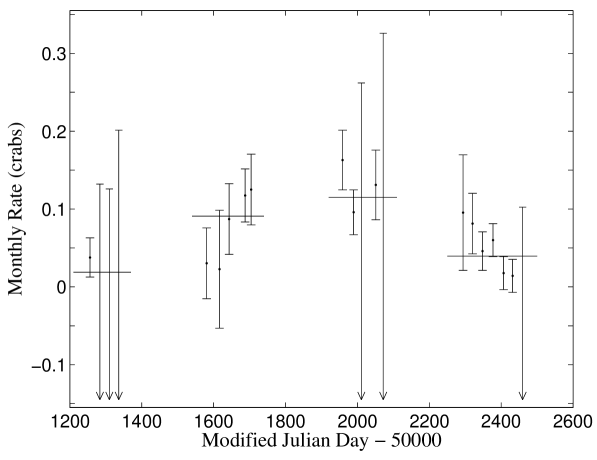
The results of the H1426 observations between 1999 and 2001 have been described in detail by Horan et al. 2002 [9] and are summarised here in Table LABEL:009123-2:results The gamma-ray flux from H1426 during the 2001/2002 observing season was found to be weaker than during the previous years. This is consistent with reports from the HEGRA collaboration [2], who also found H1426 to be in a lower emission state during this time period. The lightcurve for H1426 from March 1999 to July 2002 is shown in Figure 1. The rates are plotted for each month during which H1426 was observed at Whipple and are expressed in terms of the Crab rate for that observing season. The combined rate for each period is also shown and can be seen to be lowest for the observations taken during 1999 and 2002.
The average flux from H1426 in the soft X-ray band as recorded by the All Sky Monitor was also found to be lower than in other years during the time that H1426 was observed at Whipple in 2002. This is consistent with results from other TeV blazars which reveal the average X-ray and TeV gamma-ray flux levels to be correlated.
Due to its large redshift (=0.129), spectral measurements of H1426 are of particular importance in determining the density of the extragalactic infra-red background radiation. A detailed spectral analysis by Petry et al. [10] revealed H1426 to have a spectrum steeper than that of any other TeV blazar. The large dataset accumulated during 2002 is being incorporated into this spectral analysis and an update will be presented at the conference.
| Period of | Exposure | Total | Max. | Fpeakb |
|---|---|---|---|---|
| Observations | [hrs] | Montha | [x 10-11 cm-2 s-1] | |
| Mar. 1999 - Jun. 1999 | 24.35 | 0.9 | 1.6 | 0.2 |
| Feb. 2000 - Jun. 2000 | 26.37 | 3.1 | 3.4 | 0.35 |
| Jan. 2001 - Jun. 2001 | 31.12 | 5.5 | 5.0 | 0.88 |
| Jan. 2002 - Jul. 2002 | 110.54 | 2.4 | 2.7 | 0.30 |
a The maximum statistical significance of the signal recorded from
H1426 when the data are grouped by the month during which they were
recorded.
b The integral flux above Epeak for that year as given in Table 1.
4. Acknowledgments
We acknowledge the technical assistance of E. Roache and J. Melnick. This research is supported by grants from the U. S. Department of Energy, by Enterprise Ireland and by PPARC in the UK. The ASM quicklook results were provided by the ASM/RXTE team (http://xte.mit.edu).
5. References
1. Aharonian F. A. et al. 2002, A&A 384, L23
2. Aharonian F. A. et al. 2003, A&A in press astro-ph/0301437
3. Catanese M. A. et al. 1998, ApJ 501, 616
4. Costamante L. et al. 2000, Mem. Soc. Astron. Italia 72, 153
5. Costamante L. et al. 2002, A&A 384, 56
6. Costamante L. et al. 2003, A&A in press astro-ph/0301211
7. Djannati-Atai A. et al. 2002, A&A 391, L25
8. Horan D. et al. 2001, AIP Conf. Proc. 587, 324
9. Horan D. et al. 2002, ApJ 571, 753
10. Petry D. et al. 2002, ApJ 580, 104
11. Remillard R. A. et al. 1989, ApJ 345, 140
12. Wood K. S. et al. 1984, ApJS 56, 507