Chapter 1 Search for Very High Energy Gamma Rays from an X-ray Selected Blazar Sample
Abstract
In recent years, blazar surveys at radio and X-ray energies have greatly increased our understanding of this type of active galaxy. The combination of multi-wavelength data has shown that blazars follow a well defined sequence in terms of their broad band spectral properties. Together with increasingly detailed emission models, this information has provided not only tools with which to identify potential sources of TeV emission but also predictions of their gamma-ray flux. A list of such candidates has been used in this work to investigate the best targets for TeV observations. Observations reported here have resulted in upper limits which do not conflict with the latest model predictions.
1. Introduction
BL Lac objects, a blazar subclass, are the preferred targets of ground-based observations with atmospheric Čerenkov telescopes since they have the second peak of their spectral energy distribution (SED) extending well into the TeV domain. The limited field of view of Čerenkov telescopes and their low duty cycles require a priori selection of target objects. Here our candidates have been selected following the work of Costamante Ghisellini [2]. Their BL Lac catalogue is the first to provide estimates of TeV fluxes based on model predictions. It consists of objects bright in both the X-ray and radio bands and includes the TeV sources already detected. The gamma-ray flux at TeV energies has been estimated by applying a homogeneous one-zone SSC model [3], and by using the phenomenological parameterisation of the blazar SED developed by Fossati [1] and modified by Costamante [2] to better describe the SEDs of low power blazars.
| Source | z | Obs. Time | IR(b) | Flux Pred.(c) | Req. Time(d) | |
|---|---|---|---|---|---|---|
| (h) | (c.u.) | () | (c.u.) | (h) | ||
| 1ES0033+595 | 0.086 | 12.02 | 0.11 | 57 | 0.17/0.021 | 23/1482 |
| 1ES0120+340 | 0.272 | 5.05 | 0.12 | 94 | 0.02/0.025 | 1135/1047 |
| RGBJ0214+517 | 0.049 | 6.05 | 0.17 | 38 | 0.48/0.006 | 2.8/18107 |
| 1ES0229+200 | 0.139 | 14.69 | 0.11 | 74 | 0.08/0.026 | 101/968 |
| 1ES0806+524 | 0.138 | 18.70 | 0.08 | 74 | 0.11/ | 50/— |
| RGBJ1117+202 | 0.139 | 3.26 | 0.21 | 74 | 0.09/0.008 | 68/10189 |
| 1ES1553+113 | 0.360 | 2.82 | 0.19 | 98 | 0.02/0.035 | 2260/535 |
| RGBJ1725+118 | 0.018 | 2.33 | 0.23 | 17 | 1.04/0.001 | 0.67/651240 |
2. Observations and Analysis
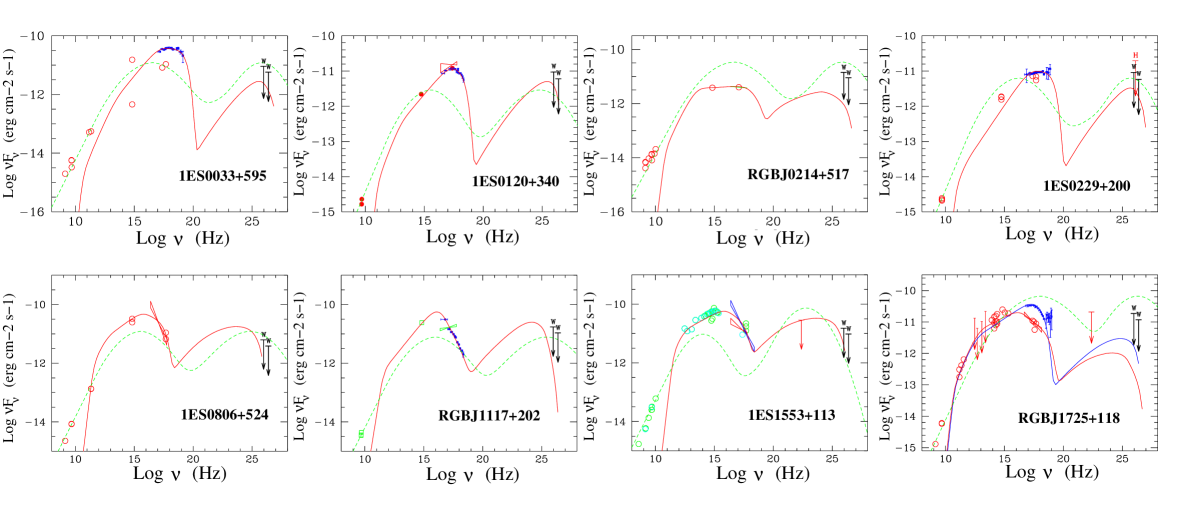
Eight objects from this BL Lac sample were observed with the Whipple 10-m gamma-ray telescope [5] during 2001-2002. The selection was based mainly on the source redshift (z ) and requiring the predicted flux above 300 GeV, according to [1], to be of the Crab Nebula flux to keep observing times below 50 hours. 1ES0120+340 and 1ES1553+113, although at a larger redshift and with flux predictions at the Crab Nebula flux, were also included on the basis of their extreme nature [6], both having many similar broadband properties to 1ES1426+428. Table LABEL:009273-1:results_tab lists the predicted flux values as taken from [2]. Data for which only ON source observations are available have been analysed using a background estimate obtained from OFF source data from different regions of the sky, which are ’matched’ to the ON source data [8]. This analysis includes software padding. A set of image parameter cuts [5], optimized on Crab Nebula data, has been applied to select gamma-ray candidate events [7]. A combination of genuine and matched ON/OFF pairs are used to establish the statistical significance of any excess as described in [9].
3. Results
No evidence for TeV emission was found from any of the eight objects over short or long time scales. Source flux upper limits were derived using the Helene method [10] and referred to contemporaneous Crab Nebula observations as described in [11]. Our upper limits in terms of energy density are presented in Fig.LABEL:009273-1:SSC_models These upper limits apply only to the epoch of the reported observations.
4. Summary
Our flux upper limits are consistent with current SSC models and for 4 of the objects are below the flux predicted by the Fossati approach. Due to the high variability that this type of object presents, our non-detections should not discourage future observations of objects selected from this sample, as the detection of 1ES1959+650 at TeV energies indicates [4]. This object was predicted as a TeV source, and although its predicted flux 0.3 TeV was only 3 mCrab according to the SSC model (630 mCrab using the Fossati approach), it was detected at TeV energies at a level of up to 5 Crab. With the VERITAS-4 telescope array, with a sensitivity to a Crab-like source of 5 mCrab in 50 hours (5 detection), the model predictions will be strongly tested in just a few hours.
5. Acknowledgments
We acknowledge the technical assistance of E. Roache and J. Melnick. This research is supported by grants from the U. S. Department of Energy, by Enterprise Ireland and by PPARC in the UK.
6. References
1. Fossati G. et al. 1998, MNRAS 299, 433
2. Costamante L. Ghisellini G. 2002, AA 384, 56
3. Ghisellini G., Celotti A. Costamante L. 2002, AA 386, 833
4. Holder J. et al. 2002, ApJL 583, L9
5. Finley P. J. et al. 2001, in Proc. 27 ICRC 7, 2827, Hamburg, Germany
6. Ghisellini G. 1999, Astroparticle Physics 11, 11
7. Reynolds P. T. et al. 1993, ApJ 404, 206
8. de la Calle Perez I. et al. in preparation
9. Catanese M. et al. 1998, ApJ 501, 616
10. Helene O. 1983, NIM 212, 319
11. Aharonian F. A. et al. 2000, AA 353, 847
12. de Jager O. C. Stecker F. W. 2002, ApJ 566, 738