11email: boeker@stsci.edu 22institutetext: Instituto de Astrofísica de Andalucía (CSIC), Camino Bajo de Huetor 24, 18080 Granada, Spain
22email: ute@iaa.es 33institutetext: National Radio Astronomy Observatory, P.O. Box 0, Socorro, NM 87801, U.S.A.
33email: eschinne@nrao.edu
Molecular gas in the central regions of the latest-type spiral galaxies
Using the IRAM telescope, we have surveyed an unbiased sample of 47 nearby spiral galaxies of very late (Scd-Sm) Hubble-type for emission in the and lines. The sensitivity of our data (a few mK) allows detection of about 60% of our sample in at least one of the CO lines. The median detected mass is within the central few kpc, assuming a standard conversion factor. We use the measured line intensities to complement existing studies of the molecular gas content of spiral galaxies as a function of Hubble-type and to significantly improve the statistical significance of such studies at the late end of the spiral sequence. We find that the latest-type spirals closely follow the correlation between molecular gas content and galaxy luminosity established for earlier Hubble types. The molecular gas in late-type galaxies seems to be less centrally concentrated than in earlier types. We use Hubble Space Telescope optical images to correlate the molecular gas mass to the properties of the central galaxy disk and the compact star cluster that occupies the nucleus of most late-type spirals. There is no clear correlation between the luminosity of the nuclear star cluster and the molecular gas mass, although the CO detection rate is highest for the brightest clusters. It appears that the central surface brightness of the stellar disk is an important parameter for the amount of molecular gas at the galaxy center. Whether stellar bars play a critical role for the gas dynamics remains unclear, in part because of uncertainties in the morphological classifications of our sample.
Key Words.:
galaxies: spiral – galaxies: ISM – galaxies: nuclei1 Introduction
Spiral galaxies of the latest Hubble types (between Scd and Sm) are considered dynamically simple systems: they are “pure” disk galaxies, often with only weak spiral arm structure, ill-defined stellar bars, and no obvious central bulges. Their stellar disks often are extremely thin, as evidenced by a large ratio of radial to vertical disk scale lengths in edge-on images (Dalcanton & Bernstein 2000). In many cases the thin disks are embedded in a red stellar envelope that most plausibly formed before the thin disk (Dalcanton & Bernstein 2002). The undisturbed morphology of these systems indicates that they have not experienced any significant merger events after the formation of the red envelopes ( ago). Late-type spirals thus provide important constraints on galaxy formation scenarios that invoke hierarchical merging.
In addition, the featureless stellar disks, shallow surface brightness profiles, and lack of bulge-like structures apparent in optical images of many such galaxies (Matthews & Gallagher 1997; Böker et al. 2003) suggest an uneventful star formation history within their central few kpc. It is unclear whether this lack of past star formation activity in the central region is simply due to a lack of cold molecular gas (which provides the raw material for star formation), or whether dynamical effects prevent the gas from reaching a critical density. Unfortunately, late-type spirals are under-represented in many samples because of observational biases. This is especially true for surveys of their molecular gas content. For example, a literature compilation of the CO emission in 582 galaxies by Casoli et al. (1998) contains only 55 spirals with Hubble type Scd or later, only 26 of which have actual detections. With the data presented in this paper, we more than double the amount of available CO observations of late-type spirals. More specifically, we present spectra of the emission from 47 objects in both the and lines, 30 of which have reliable detections in at least one of the CO lines.
Our study is further motivated by an apparent conundrum that has recently emerged from high-resolution images of this galaxy class. Over the last few years, Hubble Space Telescope (HST) images have revealed that the photocenter of many late-type spirals is occupied by a compact, luminous stellar cluster (Phillips et al. 1996; Carollo et al. 1998; Matthews et al. 1999). In a recent paper (Böker et al. 2002, hereafter paper I), we have shown that at least 75% of spiral galaxies with Hubble types later than Sc harbor such a nuclear star cluster. It thus appears that even in the most shallow disks, the nucleus is a well-defined location. This is difficult to explain, given the fact that the slowly rising rotation curves observed in most late-type spirals indicate a nearly homogenous mass distribution over much of the central disk (e.g. Matthews & Gallagher 1997), and hence gravity does not provide a strong force towards the nucleus.
Even more surprising is the fact that many of the nuclear clusters for which spectroscopic information exists are dominated by a relatively young () stellar population (Gordon et al. 1999; Böker et al. 1999, 2001; Davidge & Courteau 2002). The dynamical masses for these nuclear star clusters are in the range (Kormendy & McClure 1993; Böker et al. 1999; Matthews & Gallagher 2002; Walcher et al. 2003), and it is unclear how the high gas densities required for the formation of such dense and massive star clusters could have been achieved in the centers of late-type spirals. One possible scenario is that the clusters are formed over time by a series of modest starburst events, rather than in a single, massive collapse. This model is difficult to confirm observationally, because the cluster spectrum is always dominated by the youngest stellar population which contains the most massive and brightest stars. The purpose of this paper is to provide a “sanity check” of this scenario by quantifying the amount of molecular material in the central few kpc of late-type spirals. Clearly, if repetitive starbursts are a viable model for nuclear cluster formation, one would expect to find a central reservoir of molecular gas from which gas can be transported into the central few pc.
In Sect. 2, we describe our galaxy sample, the details of the CO observations, and the data reduction procedure. The resulting CO spectra and their quantitative analysis are presented in Sect. 3. In Sect. 4, we compare the results for our sample to those derived for early-type disk galaxies. In addition, we use the HST images of paper I to investigate possible dependencies between the molecular gas content and galaxy parameters such as luminosity, bar class, or surface brightness, as well as the luminosity of the nuclear star clusters. We summarize and conclude in Sect. 5.
2 Sample Selection, Observations and Data Reduction
2.1 The galaxy sample
Our galaxy sample was selected according to the criteria described in paper I:
-
1.
Hubble type between Scd and Sm ().
-
2.
Line-of-sight velocity .
-
3.
Axis ratio parameter , i.e. inclination close to face-on.
The NASA Extragalactic Database, (NED) contains 120 galaxies that meet the above criteria. In this paper, we present new IRAM observations for a subset of 47 objects. The galaxy names and some selected properties of our IRAM sample are listed in Table 1.
| (1) | (2) | (3) | (4) | (5) | (6) | (7) | (8) | (9) | (10) |
|---|---|---|---|---|---|---|---|---|---|
| Galaxy | R.A. | Dec. | Type | ||||||
| (J2000) | (J2000) | [Mpc] | [mag] | [] | [arcmin] | [] | |||
| NGC 337a | 01 01 33.90 | -07 35 17.7 | 14.3 | SAB(s)dm | 13.38 | 5.0 | 19.9 | -10.02 | |
| MCG 1-3-85 | 01 05 04.88 | -06 12 45.9 | 14.6 | SAB(rs)d | 12.62 | 4.3 | na | na | |
| NGC 428 | 01 12 55.60 | -00 58 54.4 | 16.1 | SAB(s)m | 12.03 | 3.6 | 18.7 | -13.15 | |
| UGC 3574 | 06 53 10.60 | +57 10 39.0 | 23.4 | SA(s)cd | 14.59 | 3.4 | 18.4 | -11.90 | |
| UGC 3826 | 07 24 32.05 | +61 41 35.2 | 27.8 | SAB(s)d | 15.00 | 3.5 | 19.1 | -10.76 | |
| NGC 2552 | 08 19 20.14 | +50 00 25.2 | 9.9 | SA(s)m? | 12.81 | 3.4 | 19.7 | -12.04 | |
| UGC 4499 | 08 37 41.43 | +51 39 11.1 | 12.5 | SAdm | 14.82 | 2.4 | 19.8 | -8.59 | |
| NGC 2805 | 09 20 24.56 | +64 05 55.2 | 28.1 | SAB(rs)d | 11.93 | 5.9 | 18.0 | -13.32 | |
| UGC 5015 | 09 25 47.89 | +34 16 35.9 | 25.7 | SABdm | 15.60 | 1.8 | 19.1 | -11.37 | |
| UGC 5288 | 09 51 17.00 | +07 49 39.0 | 8.0 | Sdm: | 15.55 | 0.8 | 19.8 | nc | |
| NGC 3206 | 10 21 47.65 | +56 55 49.6 | 19.7 | SB(s)cd | 13.94 | 2.8 | 18.8 | nc | |
| NGC 3346 | 10 43 38.90 | +14 52 18.0 | 18.8 | SB(rs)cd | 12.72 | 2.7 | 18.1 | -11.78 | |
| NGC 3423 | 10 51 14.30 | +05 50 24.0 | 14.6 | SA(s)cd | 11.59 | 3.9 | 17.4 | -11.84 | |
| NGC 3445 | 10 54 35.87 | +56 59 24.4 | 32.1 | SAB(s)m | 12.90 | 1.5 | 17.6 | -13.42 | |
| NGC 3782 | 11 39 20.72 | +46 30 48.6 | 13.5 | SAB(s)cd: | 13.13 | 1.6 | 18.2 | -10.07 | |
| NGC 3906 | 11 49 40.46 | +48 25 33.3 | 16.7 | SB(s)d | 13.72 | 1.6 | 18.6 | -10.01 | |
| NGC 3913 | 11 50 38.77 | +55 21 12.1 | 17.0 | SA(rs)d: | 13.37 | 2.4 | 17.6 | -9.96 | |
| UGC 6931 | 11 57 22.79 | +57 55 22.5 | 20.7 | SBm: | 15.14 | 1.3 | 20.1 | -9.72 | |
| NGC 4204 | 12 15 14.51 | +20 39 30.7 | 13.8 | SB(s)dm | 14.01 | 3.8 | 19.4 | -10.26 | |
| NGC 4242 | 12 17 30.10 | +45 37 07.5 | 10.5 | SAB(s)dm | 11.69 | 4.8 | na | -11.33∗ | |
| NGC 4299 | 12 21 40.90 | +11 30 03.0 | 16.8 | SAB(s)dm: | 13.01 | 1.6 | 17.7 | -11.73 | |
| NGC 4395 | 12 25 48.92 | +33 32 48.4 | 7.1 | SA(s)m | 11.40 | 12.2 | na | -12.33∗ | |
| NGC 4416 | 12 26 46.72 | +07 55 07.9 | 20.7 | SB(rs)cd: | 13.24 | 1.6 | 17.9 | -8.81 | |
| NGC 4411B | 12 26 47.30 | +08 53 04.5 | 19.1 | SAB(s)cd | 13.24 | 2.4 | 16.9 | -12.57 | |
| NGC 4487 | 12 31 04.36 | -08 03 13.8 | 14.6 | SAB(rs)cd | 12.21 | 3.7 | 17.0 | -12.97 | |
| NGC 4496A | 12 31 39.32 | +03 56 22.7 | 25.3 | SB(rs)m | 12.12 | 3.8 | 18.6 | -11.99 | |
| NGC 4517A | 12 32 28.15 | +00 23 22.8 | 22.2 | SB(rs)dm: | 13.19 | 3.8 | 19.8 | nc | |
| NGC 4519 | 12 33 30.27 | +08 39 17.0 | 18.5 | SB(rs)d | 12.50 | 2.9 | na | na | |
| NGC 4534 | 12 34 05.44 | +35 31 08.0 | 14.2 | SA(s)dm: | 13.04 | 2.9 | na | na | |
| NGC 4540 | 12 34 50.90 | +15 33 06.9 | 19.8 | SAB(rs)cd | 12.54 | 2.1 | 17.6 | -12.29 | |
| NGC 4618 | 12 41 32.74 | +41 09 03.8 | 10.7 | SB(rs)m | 11.45 | 4.3 | 18.0 | -11.45 | |
| NGC 4625 | 12 41 52.61 | +41 16 26.3 | 11.7 | SAB(rs)m pec | 13.08 | 2.2 | 16.8 | -10.61 | |
| NGC 4688 | 12 47 46.77 | +04 20 08.8 | 14.9 | SB(s)cd | 13.52 | 3.7 | na | na | |
| NGC 4701 | 12 49 11.71 | +03 23 21.8 | 11.0 | SA(s)cd | 12.91 | 2.6 | 15.9 | -13.45 | |
| NGC 4775 | 12 53 45.79 | -06 37 20.1 | 22.4 | SA(s)d | 12.20 | 2.2 | 16.8 | -13.77 | |
| UGC 8516 | 13 31 52.50 | +20 00 01.0 | 16.5 | Scd: | 14.37 | 1.1 | 18.1 | -10.97 | |
| NGC 5477 | 14 05 31.25 | +54 27 12.3 | 8.1 | SA(s)m | 14.62 | 1.4 | 20.4 | nc | |
| NGC 5584 | 14 22 23.65 | -00 23 09.2 | 24.2 | SAB(rs)cd | 12.51 | 3.3 | 17.7 | -9.47 | |
| NGC 5669 | 14 32 44.00 | +09 53 31.0 | 21.2 | SAB(rs)cd | 13.11 | 4.1 | 18.5 | -10.03 | |
| NGC 5668 | 14 33 24.30 | +04 27 02.0 | 23.8 | SA(s)d | 12.51 | 2.8 | 17.8 | -13.10 | |
| NGC 5725 | 14 40 58.30 | +02 11 10.0 | 24.4 | SB(s)d: | 14.73 | 1.0 | na | na | |
| NGC 5789 | 14 56 35.52 | +30 14 02.5 | 28.6 | Sdm | 14.44 | 1.1 | 19.9 | nc | |
| NGC 5964 | 15 37 36.30 | +05 58 26.0 | 22.2 | SB(rs)d | 13.23 | 4.1 | 18.4 | -12.62 | |
| NGC 6509 | 17 59 25.36 | +06 17 12.4 | 27.5 | SBcd | 13.37 | 1.5 | 17.4 | -13.08 | |
| UGC 12082 | 22 34 11.54 | +32 52 10.3 | 13.9 | Sm | 14.14 | 2.8 | 20.7 | nc | |
| UGC 12732 | 23 40.39.80 | +26 14 10.0 | 12.4 | Sm: | 14.26 | 3.3 | 20.1 | -11.29 | |
| NGC 7741 | 23 43 53.65 | +26 04 33.1 | 12.5 | SB(s)cd | 12.09 | 4.1 | 18.6 | nc |
Columns 1-3: Galaxy name and coordinates. Column 4: Galaxy distance (in Mpc), calculated from the measured recession velocities, corrected for Virgo-centric infall, and assuming . Column 5: morphological type as listed in the RC3. Columns 6-8: galaxy total apparent blue magnitude, line width (measured at the 20% level), and apparent optical diameter as listed in LEDA. Column 9: central I-band surface brightness of the stellar disk, derived from the analysis of HST images described in paper I. Galaxies marked ‘na’ are not in the sample of paper 1. Column 10: absolute I-band magnitude of the nuclear star cluster, taken from paper 1 except for NGC 4242 and NGC 4395 (flagged by a ) which are taken from Matthews et al. (1999). Galaxies in which no nuclear cluster could be identified are marked ‘nc’.
We point out that the sample selection criteria are unbiased (within the limits of the catalogs that form the basis of NED) with respect to galaxy size, stellar or gaseous mass, total magnitude, star formation efficiency, or any other quantity that might reasonably be expected to favor or disfavor nuclear star formation. It should therefore be well suited to provide a representative measure of the molecular gas content in late-type galaxies in the local universe.
Of the 47 IRAM targets, all but 7 (MCG-1-3-85, NGC 4242, NGC 4395, NGC 4519, NGC 4534, NGC 4688, and NGC 5725) have HST I-band observations that were presented in paper I. We use these images to search for possible correlations of the molecular gas content both with the central surface brightness of the stellar disk and the luminosity of the nuclear star cluster (Sect. 4.2 and 4.3). The spatial resolution afforded by HST is essential for this purpose because the emission from the luminous central star cluster is difficult to separate from the underlying disk, even in the best seeing conditions.
2.2 Observations and data reduction
All objects were observed with the IRAM telescope on Pico Veleta, Spain between December 2001 and August 2002. We used dual polarization receivers at the (redshifted) frequencies of the and lines at 115 and , respectively, employing the filterbanks for the line and the autocorrelator for the line. All observations were done in wobbler switching mode with a wobbler throw of in azimuth. The galaxies were observed at their central positions listed in Table 1, with one beam position per galaxy. The telescope pointing accuracy was monitored on nearby quasars every 60 – 90 minutes, the rms offset being . Due to relatively poor weather conditions and anomalous refraction during most of our observations, the pointing accuracy is less than optimal. However, given the half-power beam width (HPBW) of the telescope of at and at , this is adequate to measure the nuclear CO emission. At the median distance of our galaxy sample (), the beam size corresponds to () at ().
Typical on-source integration times were 0.5–1 hours per object, divided in scans of 6 minutes. The individual scans were averaged after flagging of bad channels, and linear baselines were subtracted. Typical rms noise levels were in the range for the line and for the line (after smoothing to a velocity resolution of ). The reduced sensitivity of some of the observations is due to the fact that during part of the observations, only one of the two receivers was functional.
The data are calibrated to the scale of corrected antenna temperature, , by measuring loads at ambient and cold temperature, as in the conventional “chopper wheel” calibration for millimeter wavelength observations. A calibration measurement was carried out every 15-20 minutes during an integration and every time a new object was acquired. Typical system temperatures were in the range at and at on the scale. The IRAM forward efficiency, , was 0.95 and 0.91 at 115 and and the beam efficiency, , was 0.75 and 0.50, respectively. All CO spectra and luminosities are presented in the main beam temperature scale () which is defined as . The conversion factor from main beam temperature to flux densities for the telescope is .
3 Results
3.1 CO spectra
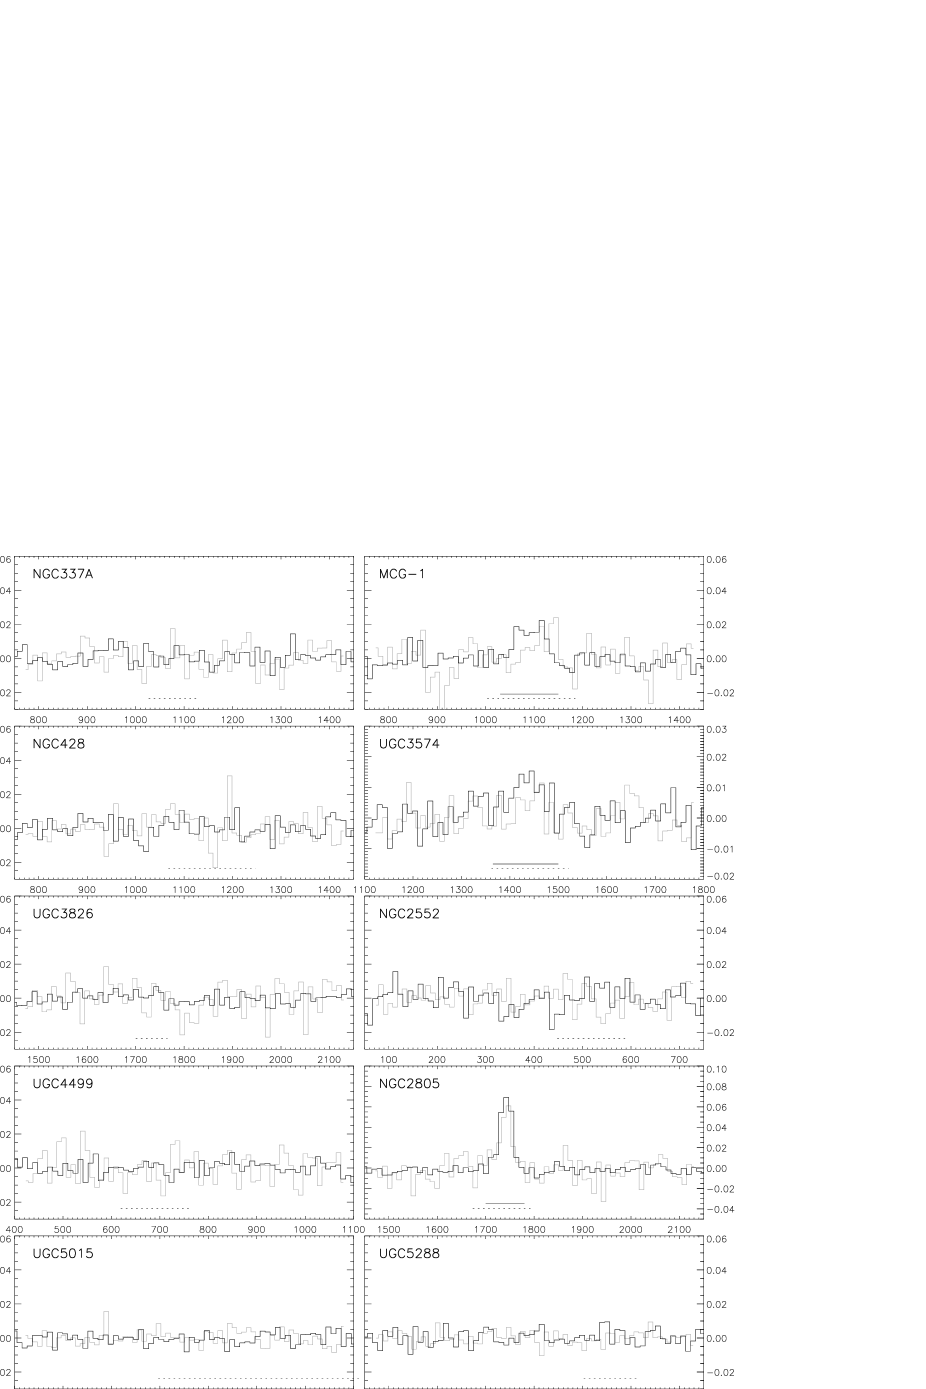
In Fig. 1, we show the calibrated and spectra of all observed galaxies. The spectra were smoothed to a velocity resolution of . We detect 29 galaxies in the line, 21 of which also show evidence for emission. One object (NGC 5584) is detected only in . The detections for most galaxies are more than 5 above the noise, except for NGC 3906, NGC 4204 and NGC 4299 for which the detections are only at a level of .
| (1) | (2) | (3) | (4) | (5) | (6) | (7) | (8) |
|---|---|---|---|---|---|---|---|
| Galaxy | (var) | ||||||
| [] | [] | [] | [] | [] | [] | [] | |
| NGC 337a | 0.46 | 1.01 | – | – | 4.0 | 14.4 | 4.6 |
| MCG 1-3-85 | 1.39 0.18 | 1.39 0.49 | 678 | 1092 | 12.7 | 22.2 | 3.6 |
| NGC 428 | 0.74 | 1.23 | – | – | 8.2 | 7.6 | 5.0 |
| UGC 3574 | 1.16 0.18 | 0.78 | 12332 | 1426 | 27.2 | 30.7 | 5.8 |
| UGC 3826 | 0.26 | 0.98 | – | – | 8.6 | 12.1 | 5.0 |
| NGC 2552 | 0.79 | 0.99 | – | – | 3.3 | 6.2 | 0.7 |
| UGC 4499 | 0.44 | 1.53 | – | – | 2.9 | 6.6 | 1.1 |
| NGC 2805 | 2.34 0.10 | 3.28 0.48 | 291 | 1742 | 79.2 | 37.7 | 18.5 |
| UGC 5015 | 0.71 | 0.95 | – | – | 20.1 | 42.1 | 1.3 |
| UGC 5288 | 0.53 | 0.47 | – | – | 1.5 | 6.2 | 0.3 |
| NGC 3206 | 0.52 | 1.08 | – | – | 8.6 | 8.8 | 3.2 |
| NGC 3346 | 3.58 0.23 | 1.57 0.66 | 816 | 1244 | 54.2 | 53.6 | 1.4 |
| NGC 3423 | 2.70 0.24 | 2.67 0.70 | 666 | 1002 | 24.7 | 21.8 | 2.3 |
| NGC 3445 | 0.89 0.10 | 1.41 0.46 | 405 | 2042 | 39.3 | 29.4 | 4.7 |
| NGC 3782 | 0.68 0.11 | 1.05 0.33 | 5610 | 753 | 5.3 | 9.4 | 1.3 |
| NGC 3906 | 0.37 0.12 | 0.86 | 196 | 969 | 4.4 | 7.6 | 0.3 |
| NGC 3913 | 1.88 0.22 | 1.98 0.67 | 242 | 961 | 23.3 | 34.6 | 0.9 |
| UGC 6931 | 0.50 | 1.23 | – | – | 9.2 | 18.3 | 0.6 |
| NGC 4204 | 0.50 0.14 | 1.65 | 3413 | 849 | 4.1 | 6.5 | 1.5 |
| NGC 4242 | 0.90 | 0.98 | – | – | 4.3 | 4.6 | 1.2 |
| NGC 4299 | 0.48 0.14 | 0.54 0.19 | 248 | 223 | 5.8 | 7.7 | 1.1 |
| NGC 4395 | 0.58 | 0.70 | – | – | 1.3 | 1.4 | 3.7 |
| NGC 4416 | 5.08 0.19 | 4.58 0.34 | 783 | 1391 | 93.3 | 114.5 | 0.5 |
| NGC 4411B | 0.88 0.10 | 0.56 | 375 | 1268 | 13.8 | 16.5 | 1.2 |
| NGC 4487 | 3.23 0.15 | 3.74 0.55 | 80 4 | 1026 | 29.5 | 34.4 | 1.8 |
| NGC 4496A | 2.17 0.18 | 2.23 0.63 | 485 | 1734 | 59.5 | 37.1 | 7.2 |
| NGC 4517A | 0.65 | 1.03 | – | – | 13.7 | 14.6 | 5.1 |
| NGC 4519 | 2.93 0.27 | 2.31 0.77 | 9210 | 1231 | 43.0 | 41.9 | 3.9 |
| NGC 4534 | 0.42 | 1.31 | – | – | 3.6 | 5.7 | 3.1 |
| NGC 4540 | 5.57 0.19 | 5.25 0.39 | 753 | 1303 | 93.6 | 89.5 | 0.6 |
| NGC 4618 | 0.72 0.17 | 0.80 0.13 | 195 | 534 | 3.5 | 3.5 | 2.3 |
| NGC 4625 | 3.78 0.11 | 4.32 0.46 | 371 | 615 | 22.2 | 41.5 | 1.0 |
| NGC 4688 | 0.44 0.08 | 0.41 | 205 | 983 | 4.2 | 5.6 | 1.9 |
| NGC 4701 | 2.90 0.22 | 3.02 0.40 | 9910 | 704 | 15.0 | 28.3 | 1.6 |
| NGC 4775 | 1.63 0.22 | 1.18 0.23 | 316 | 1562 | 35.1 | 27.6 | 3.7 |
| UGC 8516 | 1.20 0.19 | 1.35 | 6913 | 1026 | 14.0 | 30.5 | 0.3 |
| NGC 5477 | 0.43 | 0.40 | – | – | 1.2 | 5.7 | 0.2 |
| NGC 5584 | 0.50 | 2.10.57 | 145∗ | 1637∗ | 13.2∗ | 11.4∗ | 4.0 |
| NGC 5669 | 2.28 0.27 | 3.02 0.67 | 8615 | 1369 | 43.9 | 33.3 | 4.7 |
| NGC 5668 | 1.78 0.26 | 1.52 0.66 | 417 | 1602 | 43.2 | 31.7 | 6.1 |
| NGC 5725 | 1.12 0.24 | 3.90 | 4519 | 1648 | 28.6 | 47.9 | 0.5 |
| NGC 5789 | 0.74 | 3.90 | – | – | 25.9 | 45.4 | 1.4 |
| NGC 5964 | 0.89 0.17 | 0.67 | 438 | 1471 | 18.8 | 17.3 | 5.1 |
| NGC 6509 | 5.97 0.23 | 4.85 0.98 | 1185 | 1830 | 193.5 | 180.9 | 6.2 |
| UGC 12082 | 0.46 | 1.76 | – | – | 3.8 | 10.0 | 1.4 |
| UGC 12732 | 0.40 | 0.94 | – | – | 2.6 | 6.7 | 2.5 |
| NGC 7741 | 1.63 0.20 | 1.75 0.24 | 11415 | 767 | 10.9 | 12.3 | 1.9 |
Columns 2 and 3: Velocity integrated intensity of the and lines. The temperature refers to the main beam temperature scale (). Upper limits were derived as discussed in Sect. 3. Column 4 and 5: FWHM and central velocity of the line derived from Gauss-fits to the line, except in the case of NGC 7741 (see text). Columns 6 and 7: Molecular gas mass derived with a constant (6) and luminosity-dependent (7) conversion factor (see Sect. 3.2). The values for NGC 5584 (flagged with a ) were derived from the line intensity. Column 8: Atomic gas mass, calculated from the flux. See Sect. 3.2 for details.
The quantitative analysis of the spectra is summarized in Table 2. For all detected galaxies, we list widths (at the 50% level) and central velocities of the emission as well as the integrated line intensities. Except for one case, the galaxies in our sample show no clear evidence for double-horn profiles. The CO lines are well-fitted by single Gaussians; both widths and central velocities listed in Table 2 are derived from these fits. The only exception is NGC 7741 for which these numbers were determined from the spectrum itself. For non-detections, we report upper limits for the CO intensities which were derived according to
| (1) |
Here, is the rms noise of the spectrum, the spectral resolution, and the total width of the detected CO line as indicated by the solid horizontal line in the spectra of Fig. 1. In cases for which no CO line was detected, we substitute with the width of the HI line, measured at the 20% level (Col. 7 in Table 1, dashed horizontal lines in Fig. 1).
For detections, both line intensities were integrated over the line width, except for NGC 5584 which was only detected in the line. In general, the CO line positions agree well with those of the line. The errors for the line intensities were calculated as
| (2) |
![[Uncaptioned image]](/html/astro-ph/0305508/assets/x2.png)
Fig.1 (cont.)
![[Uncaptioned image]](/html/astro-ph/0305508/assets/x3.png)
Fig.1 (cont.)
![[Uncaptioned image]](/html/astro-ph/0305508/assets/x4.png)
Fig.1 (cont.)
![[Uncaptioned image]](/html/astro-ph/0305508/assets/x5.png)
Fig.1 (cont.)
In Fig. 2a, we compare the velocity-integrated intensities of the two CO lines. Since the telescope beam size is different for the two CO lines, their respective intensities are averaged over different areas in the center of the galaxy. Under the assumption of optically thick molecular gas that extends at least as far as the (larger) beam, one would expect an intensity ratio /= . If the CO emission were optically thick but more concentrated than the beam, one would expect / because beam dilution would lower the observed beam temperature. The mean value for our sample is / = , consistent with the assumption of optically thick, extended gas. This result is not atypical for spiral galaxies: Braine et al. (1993) found / = for a mixed sample of 81 galaxies. These authors mapped the emission in order to survey the same area as covered by the beam. Their result is therefore not affected by beam dilution and demonstrates that the assumption of optically thick gas is reasonable.


For our galaxy sample, the CO line width is systematically smaller than the HI line width, as demonstrated in Fig. 2b. This result differs from that obtained by Sakamoto et al. (1999) who find that the CO line width reaches about 95% of the value within from the center in a sample of 20 CO-luminous, mostly early- to intermediate-type spirals. However, given that the bulge-less, disk-dominated systems in our sample have slowly rising rotation curves, and the beam size of our observations only covers at the median distance of our galaxy sample (), this difference is not surprising. The smaller CO line width also argues against the presence of strong non-circular motion associated with prominent stellar bars in the inner .
3.2 Molecular and atomic gas masses
The amount of molecular hydrogen in external galaxies can not be measured directly from emission, but has to rely on indirect methods. The most common of these uses the line emission as a tracer for , assuming proportionality between the abundances of the two species. Driven mostly by the lack of a clear theoretical understanding of the relative abundances, many studies have assumed that the conversion factor is universal, i.e. applies to all environments.
Keeping in mind the shortcomings of this approach, we can estimate111Here, we have adopted a Gaussian beam for which the solid angle is . For comparison, a circular beam (which is also used in the literature) covers a solid angle of , and hence yields . the mass within the central by applying a generic conversion factor of (Strong et al. 1988) which yields:
| (3) |
where the galaxy distance is measured in Mpc, , the half power beam width of the 30 m-telescope () in seconds of arc, and the velocity integrated intensity in . The distance estimates for our sample are obtained by using the measured recession velocities, corrected for Virgo-centric infall (Sandage & Tammann 1990), and assuming . In the case of NGC 5584, for which only the line was detected, we estimate by assuming that the measurement is affected by beam dilution, i.e. the CO emitting region is small compared to the beam. In this case, if the intrinsic / ratio is unity, as appears to be the case for the rest of the sample, then =/4 in NGC 5584. This value is consistent with the upper limit derived from the spectrum itself.
The resulting molecular gas masses for the detected galaxies (Col. 6 of Table 2) span the range between and . We emphasize that these mass estimates represent only lower limits to the total molecular gas content, since the galaxies were only observed at their center position (on average, the IRAM beam diameter is only about 10% of ).
There is general agreement, both from models (Maloney & Black 1988; Kaufman et al. 1999) and from observations that is not constant but in fact depends on environmental parameters such as metallicity, density, or the radiation environment. Unfortunately, observations have not yet yielded a unique prescription for these dependencies. Studies of nearby galaxies provide evidence for a strong dependence of on metallicity, but the various authors report different slopes (Wilson 1995; Arimoto et al. 1996; Israel 1997; Boselli et al. 2002).
In order to test the robustness of our analysis resulting from the use of Eq. (3), we also apply a galaxy-dependent . Specifically, we use the relation suggested by Boselli et al. (2002) which was derived from a sample of 14 well-studied nearby galaxies. Their relation between and the metallicity agrees well with the result of Arimoto et al. (1996), with a slope that is stronger than the one found by Wilson (1995), and weaker than that derived by Israel (1997). For our purposes, we use the relation between and the blue magnitude of Boselli et al. (2002):
| (4) |
The resulting masses, (var) are also listed in Table 2 (Col. 7).
In order to compare the mass of the molecular gas component to that of the atomic one, we calculate the total HI mass for our galaxy sample from the 21 cm flux (as listed in LEDA) following the approach described in de Vaucouleurs et al. (1991), Eq. (74-77). The HI masses derived in this fashion represent the total HI mass of the galaxy, they are listed in Col. 8 of Table 2.
4 Analysis
4.1 Comparison to early-type galaxies
One of the goals of this program is to complement existing studies of the molecular gas content of spiral galaxies with a sample of “pure” disk galaxies with Hubble types around Sd. These galaxies are underrepresented in existing samples, and it is important to adress the question whether they follow the same trends as intermediate- to early-type spirals, or whether they might have intrinsically different gas properties. We have therefore compared our results to those obtained by Braine et al. (1993) for a sample of 81 predominantly early-type spiral galaxies. Their dataset is particularly suited for comparison with ours because both samples have nearly identical distance distributions (Fig. 3a) and were observed with the IRAM telescope. In particular, the intensities of the Braine et al. (1993) sample also refer to the central position of the galaxies only, and are therefore directly comparable to our data. The Braine et al. (1993) sample was selected to include nearby spiral galaxies with . In contrast, our sample mostly contains fainter galaxies (42 out of 47 galaxies have ). Fig. 3b shows that the angular diameter of the major axis, , of the Braine et al. (1993) galaxies is on average larger than for our targets, although both samples have nearly identical distance distributions. This is to be expected, because late-type spirals have on average lower total luminosities and lower surface brightness (Roberts & Haynes 1994), both of which likely reduce the isophotal diameter.
As evident from Fig. 3b, neither sample shows an obvious trend between the angular size of the galaxy disk and . We have also verified that there is no correlation between the angular size and or (var). This indicates that the CO observations are not significantly biased by the ratio of the optical disk size to the IRAM beam. Since the optical diameters in both samples are much larger than the IRAM beam of , it is likely that in both studies, the observations miss a non-negligible fraction of the total CO emission. This is confirmed for those 6 galaxies in our sample for which wide-beam data are listed in the GOLDMine database (Gavazzi et al. 2003). For these 6 objects, the IRAM beam detects only between 15 and 60% of the total . In principle, the undetected CO fraction should increase with galaxy diameter because the size of the CO-emitting region and the diameter of the optical disk are correlated ( Young et al. 1995). However, the fact that the central is on average larger for the Braine et al. (1993) sample demonstrates that typically, early type spirals have more CO within their central few kpc than late type spirals.
In Fig. 4a, we add the results of our survey to the well-known relation between molecular gas mass (here calculated with the generic value for , but using Eq. (4) yields equivalent results) and the far-infrared (FIR) luminosity (e.g. Young & Scoville 1991). The galaxies of our sample closely follow the relation defined by the earlier-type spirals, and extend it towards lower FIR-luminosities. The slope of the correlation is consistent with 1, indicating direct proportionality between the two quantitites. The average value of / is about 40. This is higher than in nearby normal spirals (/) and even starburst galaxies (/) (Sanders & Mirabel 1996), another indication that measurements with a single IRAM pointing miss a substantial fraction of total molecular gas. It is interesting that after normalization of the two quantities to the optical diameter of the galaxy, the two samples overlap and cover a similar range (Fig. 4b). This suggests that the latest-type spirals follow the same physical processes that intimately link the molecular gas with star formation activity. At least in this context, the latest-type spirals are not a distinct class of objects, but rather constitute the low-luminosity end of the galaxy distribution.


A similar conclusion can be reached from the relation between mass and total magnitude shown in Fig. 5: optically fainter galaxies have less molecular gas in their central regions. This result holds also when calculating the molecular mass according to Eq. (4), although this increases the scatter and reduces the dynamical range of . A similar, albeit weaker, correlation exists between optical luminosity and molecular-to-atomic gas mass ratio. Using Eq. (4) for again increases the scatter, so that only a weak trend remains (Fig. 5c, d). Here, as well as in Fig. 6c and d, we have excluded three galaxies (NGC 2681, NGC 4274, and NGC 4438) with anomalously222Specifically, we consider as HI-deficient those galaxies which deviate by more than from the relation between and linear diameter found by Haynes & Giovanelli (1984) (their Table V). low HI content from the Braine et al. (1993) sample.

We find that the latest-type spirals have on average less molecular gas and lower molecular gas mass fractions in their central regions than their early-type cousins. This is demonstrated in Fig. 6 which plots the mass and / ratio versus Hubble-type. This result seems robust against variations in , although using a luminosity-dependent conversion factor increases the scatter and decreases the slope of the correlations (Fig. 6b, d). The dependency of molecular gas mass fraction on Hubble-type and luminosity apparently contradicts the results of Boselli et al. (2002) who find that the fraction of molecular gas is independent of Hubble type or luminosity. It should be kept in mind that for our survey - as well as for the Braine et al. (1993) data - the IRAM beam is generally much smaller than the optical or HI disk of the galaxy. This probably explains the fact that typical gas mass fractions in Fig. 6c) and d) are only a few percent, much smaller than the 15% found by Boselli et al. (2002). However, effects related to beam size cannot explain the reduced fraction at the late end of the Hubble sequence in Fig. 6c) and d) because both samples were observed in the same way with the same instrument and have similar distance distributions (Fig. 3a). Furthermore, Fig. 3b shows that the optical diameter is on average smaller for late-type spirals than for earlier Hubble types, and the IRAM beam therefore covers a larger fraction of the optical disk. If the extent of molecular gas scales with the optical diameter in a way that is common to all galaxies, one would expect our sample to have a higher molecular gas fraction than the Braine et al. (1993) sample.
The fact that we observe the opposite result therefore indicates that the molecular gas in late-type spirals is less centrally concentrated relative to the HI distribution than in early-type spirals if indeed the overall /HI ratio is the same for all types of spirals, as indicated by the results of Boselli et al. (2002). This is in qualitative agreement with the result of Young et al. (1995) who find that the ratio between the CO and optical isophotal radius increases with Hubble type.

As discussed by Böker et al. (2003), one should not place too much emphasis on the exact Hubble classification in the range Scd-Sm because at arcsecond resolution, the prominent nuclear star cluster is easily mistaken as a compact “bulge”, and hence any morphological classification based on ground-based images is inaccurate at best. Nevertheless, it is clear from Fig. 6a) and b) that late-type galaxies are rather inefficient in accumulating molecular gas in their central regions. Similar results have been found by a number of earlier studies (e.g. Young & Knezek 1989; Sage 1993; Casoli et al. 1998). Young & Knezek (1989) have suggested that the deep gravitational well of a prominent bulge facilitates the formation and/or accumulation of molecular gas. While this might well be true, it is certainly not the whole story. Our sample has been selected to be devoid of stellar bulges, yet it shows a wide range of masses. In the next section, we use the high-resolution HST images to investigate the impact of the shape of the stellar disk on the amount of molecular gas that accumulates in the center.
The results presented in this section depend to some degree on the assumptions made for , in particular the variation with metallicity and/or luminosity which is still a matter of debate. For example, a much stronger dependence of on metallicity than the one derived by Boselli et al. (2002) has been suggested by Israel (1997). Using Fig. 2 of Boselli et al. (2002), we can infer that the variation in across the range of covered by the galaxies discussed here (-14 -21) is equivalent to that caused by metallicity differences of about 1 dex. According to Israel (1997), would vary by a factor of 500 over this metallicity range. While such a high variance in seems somewhat unlikely, it would eliminate (or even reverse) the trends of or / with and Hubble type in Figs. 5 and 6.
4.2 CO and the stellar disk
In order to measure the central surface brightness of the galaxy disk underlying the nuclear cluster we have used the results of the elliptical isophote fits presented in paper I. Here, we have adopted the average of the two inward extrapolations of the disk shown in Fig. 3 of paper I. In Fig. 7, we compare the so-derived central disk surface brightness which is directly proportional to the average molecular gas surface density within the beam. Both quantities are independent of galaxy distance, as long as the CO is more extended than the IRAM beam, which - based on the observed CO line ratio discussed in Sect. 3 - is most likely true for the majority of our sample.

The most direct result of Fig. 7 is that there appears to be a threshold surface brightness for detection at the sensitivity limit of our observations: we detect all 25 galaxies with , but only 1 out of 15 galaxies with . This trend cannot plausibly be explained by anomalously high values of in the undetected galaxies, because their absolute magnitudes span a wide range (-14 -19.5). Figure 7 therefore indicates that the stellar density in the central regions of late-type spirals is intimately linked to the molecular gas abundance, even in the absence of a massive stellar bulge. It is difficult to assess whether there is a direct correlation between and . To address this issue, deeper CO observations for a larger galaxy sample which expands the range of surface brightness levels would be required. Nevertheless, this result might help to explain the low success rate in detecting molecular gas in low surface brightness (LSB) galaxies. This class of galaxies, defined to have or for typical disk colors (de Jong 1996), has only been successfully detected in 3 out of 34 attempts (see compilation by O’Neil et al. 2003). The typical CO intensity of the detected LSB galaxies () is similar to that of our sample (both datasets were obtained with the telescope, and are thus directly comparable). However, the upper limits reported by O’Neil et al. (2003) for non-detections () fall well below our sensitivity limit. It is therefore possible that LSB galaxies would extend the correlation between central surface brightness and CO intensity to fainter levels.
4.3 CO and nuclear star clusters
Our survey has shown that the latest-type spirals are not entirely devoid of molecular gas. With a median mass of inside the IRAM beam, there is enough raw material within the central kpc to support a number of modest ( in stars) starburst episodes assuming a star formation efficiency of 10%. This is an important result because recent spectroscopy of nuclear clusters has shown that the spectral energy distribution (SED) of a large fraction of these objects is dominated by a relatively young population of stars with an age of a few hundred Myrs (Walcher et al. 2003). Because it is unlikely that we witness the first nuclear starburst in such a large number of galaxies, it is reasonable to assume that star formation episodes within the central few pc occur repetitively. If true, there must be a reservoir of molecular gas to support these events. While it is comforting that our observations have demonstrated the presence of reasonable amounts of molecular gas in the central regions of late-type spirals, much has to be learned about the details of nuclear cluster formation. Recent high resolution () CO observations of the barred late-type spiral IC 342 demonstrate that gas can indeed accumulate inside the central few pc (Schinnerer et al. 2003). In the case of IC 342, rough estimates of the gas inflow rates suggest that repetitive nuclear starbursts can be supported with duty cycles between and . However, IC 342 presents only a case study, and it is uncertain whether similar processes are common in late-type galaxies.
As we have discussed in the last section, the stellar density over the central kiloparsec appears tightly linked to the molecular gas abundance (or vice versa). On the other hand, the luminosity of the nuclear star cluster appears largely independent of , as demonstrated in Fig. 8. Again, this result is independent on the exact recipe to calculate the mass: using Eq. (4) for the does not significantly change Fig. 8. This result is not too surprising because the cluster luminosity is mostly determined by the age of the youngest population, and hence is not a reliable indicator of cluster mass (which one might expect to be more tightly correlated with CO luminosity).

However, it is interesting to note that 90% of the galaxies with nuclear clusters of are detected in CO, whereas the detection rate is about a factor of three lower for less luminous clusters. In addition, out of the 7 galaxies without a nuclear star cluster only one (NGC 7741) is detected in CO. This result underlines the notion that the lack of molecular gas is the main reason for the uneventful star formation history in the central regions of these galaxies. A more thorough study of the connection between molecular gas supply and nuclear starbursts requires reliable mass and age estimates for the nuclear clusters. Such measurements - which are now possible from high-resolution optical spectroscopy with large ground-based telescopes (Walcher et al. 2003) - will undoubtedly provide new insights into the formation mechanism of nuclear clusters. In the meantime, it is not unreasonable to speculate that the frequency and efficiency of nuclear starbursts is governed by the supply of molecular gas which in turn is regulated, at least in part, by the gravitational potential of the host galaxy disk.
4.4 Are bars important?
As discussed so far, the gravitational potential of the stellar mass distribution appears to play an important role for the gas flow towards the nucleus. In this paragraph, we discuss whether our observations provide evidence that dynamical effects such as gas flow in a non-axisymmetric potential are also important. A way to gauge the impact of stellar bars on (circum)nuclear star formation is to measure the amount of molecular gas in the central kiloparsec in barred and unbarred galaxies. A number of studies have shown that the nuclear gas concentration in barred galaxies is indeed higher than in galaxies without bars (e.g. Sakamoto et al. 1999; Sheth 2001; Sheth et al. 2003), thus confirming the theoretical picture that bars drive molecular gas toward the galaxy center (e.g. Athanassoula 1992). However, the (few) galaxies with late Hubble types in these studies were selected to be luminous in the blue or the FIR, i.e. they are biased towards high star formation rates.
Our sample, on the other hand, has been selected only for Hubble type, inclination, and distance (see Sect. 2.1). It should therefore provide an unbiased look at the impact of stellar bars on the molecular gas abundance in the latest Hubble-type spirals. Our sample is evenly divided in barred, mixed, and unbarred galaxies following the RC3 (de Vaucouleurs et al. 1991) classification scheme (morphological type SB, SAB, or SA, respectively). In Table 3, we summarize the CO statistics for the three subsamples. We detect 80% of the barred galaxies in our sample, compared to 63% of mixed and 44% of unbarred galaxies. Taken at face value, this result supports the notion that bars are indeed an important factor for the transport of molecular gas towards the central few kiloparsec, even in very late Hubble types. However, we caution that the morphological classification of late-type galaxies is somewhat uncertain. For example, the bar classes reported in the LEDA database are different from those in the RC3 in about 20% (10 out of 47) of the cases. Using the LEDA classification scheme, we only find a slightly higher detection rate in barred galaxies (Table 3).
The average value of in barred galaxies appears slightly higher than in unbarred galaxies, but given the large standard deviations (Col. 7 of Table 3) in the respective subsamples, this is not significant. We have included upper limits for undetected galaxies in the averaging, but excluding these values does not change the result. For completeness, we point out that the median absolute galaxy magnitude () of the unbarred subsample is about 1 magnitude fainter than for the barred subsample (Col. 8 of Table 3) which potentially causes a bias towards lower molecular gas masses in the unbarred sample due to the correlation between and . To summarize, our observations provide little evidence for enhanced molecular gas masses in the centers of barred late-type spirals.
| (1) | (2) | (3) | (4) | (5) | (6) | (7) | (8) |
| Database | Class | total | det. | undet. | mean | () | median |
| [] | [] | ||||||
| unbarred (SA) | 16 | 7 | 9 | 1.13 | 0.83 | -17.3 | |
| RC3 | mixed (SAB) | 16 | 11 | 5 | 1.56 | 1.50 | -18.2 |
| barred (SB) | 15 | 12 | 3 | 1.80 | 1.80 | -18.4 | |
| full sample | 47 | 30 | 17 | 1.49 | 1.42 | -17.8 | |
| unbarred | 12 | 7 | 5 | 1.30 | 0.90 | -17.3 | |
| LEDA | barred | 35 | 23 | 12 | 1.56 | 1.57 | -18.2 |
| full sample | 47 | 30 | 17 | 1.49 | 1.42 | -17.8 |
Column 7: standard deviation of values, including upper limits.
Whether stellar bars are a significant ingredient in the recipe to form compact stellar nuclei is an even more difficult question. Recent observations have not found much evidence for enhanced star formation in the very nuclei of barred galaxies (Ho et al. 1997), in apparent contradiction to the results from molecular gas surveys mentioned above. This notion is confirmed by the fact that nuclear clusters are found just as often in barred galaxies as in unbarred ones (paper I; Böker et al. 2003, in preparation). In addition, the topic is complicated by the fact that bars do not live forever. In fact, numerical simulations have shown that build-up of a central mass concentration (such as a supermassive black hole or a compact nuclear cluster) can dissolve stellar bars via dynamical instabilities (Norman et al. 1996). Because the bar destruction happens within just a few dynamical times, it is possible that a stellar bar might have been present in the past, leading to nuclear star formation until enough mass has been collected at the center to render the bar unstable. Without a more accurate isophotal analysis or even kinematic information on the central disks of late-type spirals, this question will remain open.
5 Summary
We have presented and spectra of the central in 47 spiral galaxies with Hubble-types between Scd and Sm. Of these, we detect 30 objects in at least one of the lines. Our survey thus significantly increases the number of available CO data for very late-type disk galaxies. The main results of our analysis can be summarized as follows:
-
1.
The average mass within the central kpc is . In principle, this amount is sufficient to support a number of modest ( in stars) starburst events. As recent high-resolution optical studies of Scd-Sm spirals have shown, star formation in these “pure” disk galaxies is almost exclusively found in the very nucleus, which is the location of a luminous, compact, and massive star cluster in at least 75% of the cases. In this context, our results are consistent with scenarios that invoke repeated nuclear starbursts to explain the fact that the SED of many clusters is dominated by a young (less than a few 100 Myrs) population of stars.
-
2.
The latest-type spirals closely follow correlations between molecular gas content and galaxy luminosity - both at optical and far-infrared wavelengths - that have been established for more luminous, early- and intermediate-type spirals and extend them to lower luminosities. In particular, we find a lower ratio between the (central) and the (total) for late type spirals for both prescriptions used to translate CO luminosity into molecular gas mass. This could either be due to a lower overall CO content (with respect to ) or a more extended distribution of the molecular gas in late-type galaxies. We favor the second scenario since the results of Boselli et al. (2002) obtained with a larger beam indicate that the overall / ratio is the same in all Hubble types.
-
3.
We find a strong separation between our CO detections and non-detections in central surface brightness of the stellar disk, . We detect 93% of galaxies with , but only 8% of galaxies with . While our observations are not sensitive enough to establish a direct correlation between the two quantities, our results fit in well with the detection rate of LSB galaxies which have even lower surface brightness disks than the galaxies in our sample. This suggests that the stellar mass distribution of the galaxy disk is an important indicator for the central accumulation of molecular gas.
-
4.
While there is little evidence for a direct correlation between the luminosity of the nuclear star cluster and the mass, we find a higher CO detection rate and higher average mass in galaxies with the most luminous clusters. Although for young stellar populations luminosity is not a reliable indicator of mass, this suggests that the molecular gas supply is indeed an important parameter for the formation mechanism of nuclear star clusters.
-
5.
Our observations provide only marginal support for an enhanced molecular gas mass in the centers of barred galaxies relative to unbarred ones.
Acknowledgements.
We would like to thank the referee, A. Boselli, for his helpful comments. UL ackowledges support from DGI Grant AYA2002-03338 and the Junta de Andalucía (Spain). This research has made use of the NASA/IPAC Infrared Science Archive and the NASA/IPAC Extragalactic Database (NED), both of which are operated by the Jet Propulsion Laboratory, California Institute of Technology, under contract with the National Aeronautics and Space Administration. It has also benefited greatly from use of the Lyon-Meudon Extragalactic Database (LEDA, http://leda.univ-lyon1.fr).References
- Arimoto et al. (1996) Arimoto, N., Sofue, Y., & Tsujimoto, T., 1996, PASJ, 48, 275
- Athanassoula (1992) Athanassoula, E. 1992, MNRAS, 259, 328
- Böker et al. (1999) Böker, T., van der Marel, R. P., & Vacca, W. D. 1999, AJ, 118, 831
- Böker et al. (2001) Böker, T., van der Marel, R. P., Mazzuca, L., et al. 2001, AJ, 121, 1473
- Böker et al. (2002) Böker, T., Laine, S., van der Marel, R. P., et al. 2002, AJ, 123, 1389 (paper I)
- Böker et al. (2003) Böker, T., Stanek, R., & van der Marel, R. P. 2003, AJ, 125, 1073
- Boselli et al. (2002) Boselli, A., Lequeux, J, & Gavazzi, G. 2002, A&A, 384, 33
- Braine et al. (1993) Braine, J., Combes, F., Casoli, F., et al. 1993, A&AS, 97, 887
- Carollo et al. (1998) Carollo, C. M., Stiavelli, M., & Mack, J. 1998, AJ, 116, 68
- Casoli et al. (1998) Casoli, F., Sauty, S., Gerin, M. et al. 1998, A&A, 331, 451
- Dalcanton & Bernstein (2000) Dalcanton, J. J., & Bernstein, R. A. 2000, AJ, 120, 203
- Dalcanton & Bernstein (2002) Dalcanton, J. J., & Bernstein, R. A. 2002, AJ, 124, 1328
- Davidge & Courteau (2002) Davidge, T. J. & Courteau, S. 2002, AJ, 123, 1438
- de Jong (1996) de Jong, R. S. 1996, A&A, 313, 377
- de Vaucouleurs et al. (1991) de Vaucouleurs, G., de Vaucouleurs, A., Corwin, H., et al. 1991, Third Reference Catalogue of Bright Galaxies, New York:Springer-Verlag
- Gavazzi et al. (2003) Gavazzi, G., Boselli, A., Donati, A. et al. 2003, A&A, 400, 451
- Gordon et al. (1999) Gordon, K. D., Hanson, M.M., Clayton, G. C., et al. 1999, ApJ, 519, 165
- Haynes & Giovanelli (1984) Haynes, M. P. & Giovanelli, R. 1984, AJ, 89, 758
- Ho et al. (1997) Ho, L. C., Filippenko, A. V., & Sargent, W. L. W. 1997, ApJ, 487, 591
- Israel (1997) Israel, F.P., 1997, A&A, 328, 471
- Kaufman et al. (1999) Kaufman, M.J., Wolfire, M.G., Hollenbach, D.J. et al. 1999, ApJ, 527, 795
- Kormendy & McClure (1993) Kormendy, J. & McClure, R. D. 1993, AJ, 105, 1793
- Maloney & Black (1988) Maloney, P., & Black, J.H. 1988, ApJ, 325, 389
- Matthews & Gallagher (1997) Matthews, L. D. & Gallagher, J. S., III 1997, AJ, 114, 1899
- Matthews & Gallagher (2002) Matthews, L. D. & Gallagher, J. S., III 2002, ApJS, 141, 429
- Matthews et al. (1999) Matthews, L. D., Gallagher, J. S., III, Krist, J. E., et al. 1999, AJ, 118, 208
- Norman et al. (1996) Norman, C. A., Sellwood, J. A., Hasan, H. 1996, ApJ, 462, 114
- O’Neil et al. (2003) O’Neil, K., Schinnerer, E., Hofner, P. 2003, ApJ, in press
- Phillips et al. (1996) Phillips, A.C., Illingworth, G. D., MacKenty, J. W., et al. 1996, AJ, 111, 1566
- Roberts & Haynes (1994) Roberts, M. S. & Haynes, M. P. 1994, ARAA, 32, 115
- Sage (1993) Sage, L. J. 1993, A&A, 272, 123
- Sakamoto et al. (1999) Sakamoto, K., Okumura, S. K., Ishizuki, S., et al. 1999, ApJ, 124, 403
- Sandage & Tammann (1990) Sandage A., & Tammann G. 1990, ApJ, 365, 1
- Sanders & Mirabel (1996) Sanders, D.B., Mirabel, I.F., 1996, ARAA, 34, 749
- Schinnerer et al. (2003) Schinnerer, E., Böker, T., & Meier, D. S 2003, ApJL, submitted
- Sheth (2001) Sheth, K. 2001, Ph.D. thesis, University of Maryland
- Sheth et al. (2003) Sheth, K., Vogel, S.N., Regan, M.W., et al. 2003, ApJ, submitted
- Strong et al. (1988) Strong, A., Bloemen, J. B. G. M., Dame, T. M, et al. 1988, A&A, 207, 1
- Walcher et al. (2003) Walcher, C. J., Rix, H-W., Böker, T., et al. 2003, in preparation
- Wilson (1995) Wilson, C., 1995, ApJ, 448, L97
- Young & Knezek (1989) Young, J. S. & Knezek, P. M. 1989, ApJ, 347, L55
- Young & Scoville (1991) Young, J. S. & Scoville, N. Z. 1991, ARAA, 29, 581
- Young et al. (1995) Young, J. S., Shuding, X., Tacconi, L., et al., 1995, ApJS, 98, 219