The Bulk Motion of Flat Edge-On Galaxies Based on 2MASS Photometry
We report the results of applying the 2MASS Tully-Fisher (TF) relations to study the galaxy bulk flows. For 1141 all-sky distributed flat RFGC galaxies we construct TF relations and find that Kron magnitudes show the smallest dispersion on the TF diagram. For the sample of 971 RFGC galaxies with 18000 km s-1 we find a dispersion and an amplitude of bulk flow = 19961 km s-1, directed towards . Our determination of low-amplitude coherent flow is in good agreement with a set of recent data derived from EFAR, PSCz, SCI/SCII samples. The resultant two- dimensional smoothed peculiar velocity field traces well the large-scale density variations in the galaxy distributions. The regions of large positive peculiar velocities lie in the direction of the Great Attractor and Shapley concentration. A significant negative peculiar velocity is seen in the direction of Bootes and in the direction of the Local void. A small positive peculiar velocity (100 – 150 km s-1) is seen towards the Pisces-Perseus supercluster, as well as the Hercules - Coma - Corona Borealis supercluster regions.
Key Words.:
galaxies: spiral – galaxies: fundamental parameters – galaxies1 Introduction
Since the pioneering work by Aaronson, Mould, Huchra and collaborators (1979, 1980, 1982), the infrared Tully-Fisher relation (IRTF) has been widely used in the study of galactic bulk flows on different scales. A rather complete review on the IRTF application is given in the thesis of Bamford (2002).
The cosmic flow investigations require both enormous and homogeneous samples. One way to increase the number of observational data is the sample combination procedure. For example, making the Mark III catalogue, Willick et al. (1997) compiled the infrared magnitudes and line widths from various sources and reduced them to a uniform system.
The appearance of the complete and homogeneous 2MASS survey Skrutskie et al. 1997 opens up new opportunities for cosmic flow study by IRTF. In our previous work (Karachentsev et al., 2002, hereafter Paper I) we identified the spiral edge-on galaxies from “The Revised Flat Galaxy Catalogue”, RFGC (Karachentsev et al., 1999) with the objects from “ The Extended Source Catalog”, XSC (Cutri et al., 1998; Jarrett et al., 2000). Of the total number of 4236 RFGC galaxies, 2996 galaxies (e. g. 71%) have been detected in the -bands. The RFGC catalogue was created using the material of the photographic sky surveys POSS-I and ESO/SERC. In Paper I we analyzed in detail the 2MASS-characteristics of flat galaxies entered in the XSC. To build the -, -, -, -, - TF relations , we used: - magnitudes from RFGC, calculated from angular diameters, taking into account the galaxy surface brightness, as well as type, and other galaxy parameters; the total -magnitudes from Mathewson & Ford (1996) and Haynes et al. (1999); the isophotal -, -, - magnitudes measured in elliptical apertures at a level of =20 mag/arcsec2. For a sample of 436 flat galaxies with this set of magnitudes and known radial velocities and HI line widths we obtained the slope of the linear TF regression, increasing from 4.9 in the -band to 9.3 in the - band. The derived scatter on the TF diagram did not show a significant decrease from the blue to infrared band, and after excluding of dwarf galaxies reached 0.6 mag.
In the present work we study in dipole approximation the bulk motion of flat galaxies from a homogeneous sample – the RFGC catalogue using the -, -, -TF relations based on the 2MASS photometry data. We show that the scatter on the TF diagram can be diminished significantly by two factors: a cleaning of the initial sample and including additional photometric parameters in the simple TF relation. As a result, for 971 all-sky distributed flat galaxies the dipole solution is: =199 km s-1, , . The smoothed peculiar velocity field repeats, as a whole, the large-scale distribution of flattened galaxies from the 2MASS.
2 The sample
2.1 The HI line widths (the sample RFGC-W.
In Paper I we presented the radial velocities of 1772 RFGC galaxies. However, not all of these 1772 objects have the HI line width measurements. To compile the list of the RFGC galaxies with known estimates of (measured directly or calculated from rotation curves), we use the following sources:
a) The list of flat galaxies with known velocities and line widths (Karachentsev et al., 2000a). This compilation consists of several subsamples observed by Giovanelli et al., 1997a, Makarov et al., 1997 a, b; 1999, 2001, Mathewson et al. (1992), Mathewson and Ford (1996), and Matthews and van Driel (2000). b) Our identifications of southern RFGC galaxies with the HIPASS survey sources (Karachentsev & Smirnova, 2002), and with “A Catalog of HI-Selected Galaxies from the South Celestial Cap Region of Sky” (Kilborn et al., 2002). c) The last version of LEDA database (Paturel et al. 1996). d) Unpublished data on the HI observations of RFGC galaxies at the Effelsberg and Nançay radio telescopes (Huchtmeier et al., 2003). The sources a),b),c), and d) contain, respectively, 78%, 2%, 11%, and 9% of the whole sample. A total of 1653 sets of radial velocities, and line widths, were used in the initial list, including some multiple observations of one and the same galaxy. To check the “best” estimate among double and triple ones, we determine in a dipole approximation the distances , using the TF relation “linear diameter - line width” from Karachentsev et al. (2000b). The observed radial velocities were reduced to the cosmic microwave background system according to Kogut et al. (1993), and the observed line widths were corrected for cosmological broadening and turbulence following Tully & Fouqué (1985). No corrections for inclination were made because the RFGC galaxies with their apparent optical axis ratio are by definition very much inclined to the line of sight (). The galaxy peculiar velocities were calculated as . Here and hereafter the inferred distance is expressed in km s-1. We retained in the RFGC-W50 sample only the galaxies from multiple observations whose peculiar velocities were minimal. In all the cases we took into account the galaxy morphology, a possible confusion from a near neighbour, the signal/noise ratio etc. After excluding multiple measurements, 1617 RFGC galaxies with known radial velocities and line widths were entered in the RFGC-W50 sample.
2.2 The 2MASS photometry ( the sample RFGC-2MASS)
To compile this sample, we performed the cross-identification between RFGC and XSC catalogues. The initial file contains 3001 lines with 2MASS data. We used for the processing the following characteristics (Jarrett et al., 2000, 2003):
– major isophotal radius in arcsec, neasured at the 20 mag/arcsec2 level in the band via photometry in elliptical isophotes;
– fiducial elliptical Kron radius in arcseconds;
– radius of the “total” aperture in arcseconds;
, , – isophotal fiducial elliptical-aperture magnitudes in corresponding bands measured at the - band fiducial 20 mag/arcsec2 isophotal radius;
, , – Kron fiducial elliptical-aperture magnitudes measured at the - band fiducial elliptical Kron radius;
— integral ”total” magnitudes as derived from the isophotal magnitudes () and the extrapolation of the fit to the radial surface brightness distribution. The extrapolation () is carried out to roughly four times the disk scale length. (Details are given in Jarrett et al. 2003);
Jhl – -band “effective” surface brightness (at - band half-light “effective” radius);
Jcdex – -band concentration index (3/4 vs. 1/4 light radius);
sba – axis ratio (/ for the combined image (“super” coadd).
A comparison of two lists, RFGC-2MASS and RFGC-W50, gives 1215 common galaxies, including 68 galaxies with multiple 2MASS estimates. The selection of the best data among the duplicate ones is made by comparing the deviations from the simple linear TF relation:
where
is extinction and =75 km s-1Mpc-1. It should be noted that the equation (2) is known to be incorrect at small distances since nearby galaxies around the Local Group do not need to have an additional 600 km s-1 correction subtracted from their apparent velocities to be placed in the proper Hubble flow. Altogether, 1141 galaxies were entered in the joint RFGC-W50-2MASS sample after the excluding procedure. Some parameters of different observables are given in Table 1, where is the standard deviation.
| N=1141 | min | max | mean | |
| , mag | 7.5 | 15.9 | 13.1 | 1.21 |
| , mag | 6.6 | 15.4 | 12.3 | 1.23 |
| , mag | 6.3 | 14.9 | 12.0 | 1.23 |
| , mag | 7.4 | 15.2 | 12.9 | 1.10 |
| , mag | 6.6 | 14.7 | 12.1 | 1.13 |
| , mag | 6.3 | 14.4 | 11.8 | 1.13 |
| , mag | 7.4 | 15.9 | 12.9 | 1.13 |
| , mag | 6.5 | 15.3 | 12.1 | 1.16 |
| , mag | 6.2 | 14.8 | 11.8 | 1.18 |
| lg(, arcsec) | 0.82 | 2.36 | 1.57 | 0.22 |
| lg(, arcsec) | 0.81 | 2.08 | 1.50 | 0.21 |
| lg(, arcsec) | 0.70 | 2.04 | 1.36 | 0.25 |
| Jhl, mag/arcsec2 | 16.8 | 20.6 | 19.0 | 0.68 |
| Jcdex | 1.89 | 8.69 | 3.99 | 0.92 |
| sba | 0.10 | 1.00 | 0.24 | 0.097 |
| lg(, km s | 1.36 | 2.89 | 2.50 | 0.163 |
| , km s-1 | 23 | 782 | 335 | 112 |
| lg(, km s | 2.24 | 4.38 | 3.73 | 0.269 |
| , km s-1 | 175 | 23758 | 6341 | 3327 |
As known, the total and the Kron magnitudes are something like 15 – 20 % brighter than the isophotal magnitudes (see figures 11, 12 and 13 in http://spider.ipac.caltech.edu/staff/jarrett/papers/LGA /LGA_fig.htm).
3 Construction of the optimal sample and calculation of the dipole parameters
For each galaxy of our sample we have a set of the isophotal, Kron, and the total magnitudes in the - bands. The check of mutual correlations between all the magnitudes shows that they are well correlated (Table 2).
| 0.119 | 0.117 | 0.083 | 0.9954 | 1.0190.003 | 1.0420.039 | ||
| 0.162 | 0.159 | 0.114 | 0.9913 | 1.0190.004 | 0.053 | ||
| 0.114 | 0.114 | 0.080 | 0.9958 | 1.0000.003 | 0.034 | ||
| 0.131 | 0.127 | 0.091 | 0.9933 | 1.0260.004 | 0.046 | ||
| 0.173 | 0.168 | 0.121 | 0.9882 | 1.0260.005 | 0.061 | ||
| 0.131 | 0.131 | 0.093 | 0.9932 | 1.0000.003 | 0.042 | ||
| 0.197 | 0.193 | 0.138 | 0.9854 | 1.0250.005 | 0.068 | ||
| 0.223 | 0.214 | 0.155 | 0.9820 | 1.0430.006 | 0.077 | ||
| 0.190 | 0.187 | 0.133 | 0.9870 | 1.0180.005 | 0.060 | ||
| 0.146 | 0.161 | 0.108 | 0.9912 | 0.9050.004 | 0.047 | ||
| 0.151 | 0.165 | 0.111 | 0.9910 | 0.9110.004 | +0.8980.045 | ||
| 0.143 | 0.157 | 0.106 | 0.9919 | 0.9110.003 | +0.8740.042 | ||
| 0.165 | 0.160 | 0.115 | 0.9894 | 1.0300.004 | -0.4140.058 | ||
| 0.177 | 0.172 | 0.124 | 0.9883 | 1.0300.005 | -0.3730.057 | ||
| 0.150 | 0.144 | 0.104 | 0.9919 | 1.0480.004 | -0.5440.047 | ||
| Notes to table: , , are the standard deviations (in mag) from the direct, | |||||||
| inverse and orthogonal TF regressions, respectively; is the coefficient of correlation; | |||||||
| and are the coefficients of the orthogonal regression. | |||||||
As an illustration of tight mutual relationship between the 2MASS magnitudes, in Fig.1 we give the regression of on , consist with the NIR colors of disk galaxies (Jarrett 2000; see also Fig. 20 in Jarrett et al. 2003).
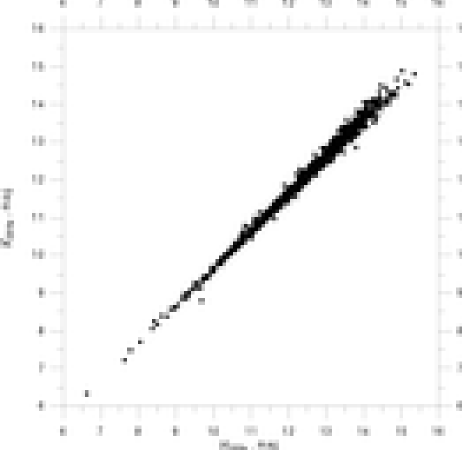
According to the data in Table 2, all three color bands seem to be of equal value.
To select between the nine different kinds of magnitudes, we built TF relation (1) for each of them and calculated the characteristics of bulk motion in a dipole approximation. At this stage the apparent magnitudes were corrected for Galactic extinction as
where is an extinction in the -band according to Schlegel et al. (1988). Here we did not correct the magnitudes for internal galaxy extinction, because the internal extinction depends on the galaxy inclination, as well as the galaxy luminosity (Verheijen, 2001), which is a priori unknown.
For each of magnitudes we use constructed TF relations to calculate the characteristics of bulk motion in a dipole approximation. We adopt the simple linear model: , where - the bulk velocity to the apex, - an unit radial vector of galaxy direction. The value of with summing on the whole sample have been minimized by a least squares method.
The results of calculations are given in Table 3.
| 0.855 | 0.15 (1653) | 1940 | 416106 | 28415 | 12 | 5.2 | |
| 0.940 | 0.17 (1630) | 2177 | 568118 | 29212 | 10 | 7.8 | |
| 0.911 | 0.16 (1581) | 2076 | 437113 | 28715 | 12 | 5.0 | |
| 0.887 | 0.16 (1668) | 2033 | 448111 | 28715 | 12 | 5.5 | |
| 0.972 | 0.17 (1635) | 2267 | 565122 | 29313 | 10 | 7.2 | |
| 0.947 | 0.17 (1592) | 2183 | 443119 | 28816 | 13 | 4.7 | |
| 0.907 | 0.16 (1686) | 2062 | 340113 | 28519 | 15 | 3.1 | |
| 0.990 | 0.18 (1647) | 2295 | 475124 | 29215 | 12 | 4.9 | |
| 0.966 | 0.17 (1625) | 2226 | 378121 | 29019 | 15 | 3.3 |
The columns of Table 3 denote:
(1) – 2MASS magnitude, by which the absolute magnitude in the TF relation was calculated;
(2) – dispersion on the TF diagram in mag;
(3) – slope C2 in formula (1) and its statistical significance according to the Fisher criterion in parentheses;
(4) – dispersion of peculiar velocities in km s-1, which includes the error in the measured distances;
(5) – modulus of the bulk motion velocity and its error in km s-1;
(6), (7) – galactic longitude and latitude of the apex and their errors in degrees;
(8) – significance of the vectorial dipole solution according to the Fisher criterion. (Note that for confidence probability 95%, the quantile of the Fisher distribution is equal to 2.6 for three degrees of freedom for numerator and infinity ones for denominator).
The errors in , , and were calculated by first calculating the diagonal elements and of covariance matrix in the frame {},and then
As seen from Table 3, for every photometric magnitude, the dispersion in the TF fit is too large, nearly 1.5 times as high as that presented in Paper I. We suggest therefore that the dipole parameters in Table 3 be considered only preliminary. Due to a larger dispersion, the slopes of the TF relation are flatter than those obtained in Paper I.
It is also seen that the Kron magnitudes (especially have a slightly lower dispersion in the TF diagram than isophotal as well as extended magnitudes. We built the diagrams of the residuals “isophotal minus Kron magnitude” depending on the absolute isophotal magnitude. For all three color bands in a wide range of absolute magnitudes {-16m , -20m} the Kron magnitudes are on average 0.4m brighter, thus recovering a significant fraction of the disk light that is lost in the background noise (see also Fig.12 in Jarrett et al., 2003) . This can reduce partially the known non-linearity of the TF relation at the lower luminous end.
We adopt as the basic apparent magnitude and accomplish the procedure of trimming of combined RFGC-W50-2MASS sample. The galaxies were omitted from the sample by such criteria:
1. 100 km s-1 (N=13). These are bluish dwarf galaxies with large uncertainties in both the profile width and the IR magnitudes.
2. The deviation from the TF relation is more than 3 (N=63).
3. 3000 km s-1 (N=119). We assume that such large peculiar velocity values are due to non-physical reasons.
We also eliminate 6 galaxies with km s-1 and (symmetrically) 10 galaxies with 18000 km s-1 to diminish the incompleteness of the sample at large distances. The process of elimination was converged after 5 steps; altogether, taking into account the cross-sections, we excluded 170 galaxies.
Excluding the dwarf galaxies with smallest velocity widths means simultaneously eliminating the nearest galaxies. For new sample of 971 galaxies the minimal value of increases to 494 km s-1 in comparison with 175 km s-1 for non-cleaned sample. Note that from the total number of 971 galaxies, about 87% galaxies have km s-1, i.e. lie outside the Local supercluster. Thus, we believe the contribution of nearby galaxies in the bulk motion parameters (when the CMB frame is used) is not significant.
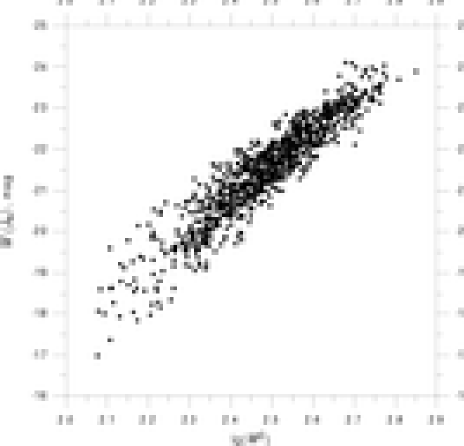
The TF relation for a new sample of 971 galaxies as vs. log is given in Fig. 2. It has a slope and a dispersion =0.430. The bulk motion parameters obtained from this relation are:
As is seen in Fig.2, eliminating 15% of the initial sample using the ”clean” criteria given above, greatly reduces the dispersion in the TF relation.
Next, for the sample of N=971 we consider seven-parametric generalized TF relation, in which photometric characteristics and color index are entered:
.
For the seven- parametric TF relation (4) the solutions are: the slope = 1044 km s-1, = 187 km s-1, . The , ( and terms are statistically insignificant. In this case, only four terms remain in the new generalized TF relation:
The new parameters are practically the same as for (4): zero-point , slope , , , = 0.422, =1045 km s-1, = 199 km s-1, , .
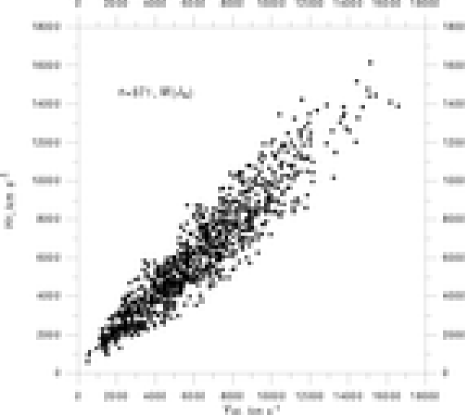
The significance of the term (=4.5) means the TF relations depend on the Hubble type, namely the central bulge to disk distribution. Statistical insignificance of the term (=0.3) indicates that internal extinction in the infrared does not correlate, surprisingly, with the infrared axial ratio. The influence of the surface brightness term, , in the regression (4) falls, but its role is partially evident via the lg( term (=17.5). In Fig.3 we give distances derived from TF relation (5) depending on radial velocities for the sample N=971.
We also built analogous (seven- and four- parametric) TF relations based on the other eight 2MASS photometric measures. They demonstrate the same tendencies: the terms , (, also are insignificant and the dipole bulk motion parameters are near to ones mentioned above.
The results of calculations with nine TF relations (5) for the sample of galaxies with 18000 km s-1 and 18000 km s-1 are collected in Table 4. The designations are the same as in Table 3.
| 0.422 | (3558) | 1045 | 19961 | 18 | 15 | 3.5 | |
| 0.457 | 0.14 (3505) | 1144 | 4.6 | ||||
| 0.464 | 0.14 (3111) | 1153 | 3.5 | ||||
| 0.437 | 0.13 (3509) | 1078 | 20964 | 29418 | 3.6 | ||
| 0.471 | 0.14 (3490) | 1167 | 23969 | 17 | 16 | 4.0 | |
| 0.485 | 0.15 (3067) | 1194 | 19870 | 20 | 17 | 2.7 | |
| 0.445 | 0.13 (3635) | 1116 | 29424 | 20 | 1.8 | ||
| 0.483 | (3552) | 1209 | 20171 | 20 | 18 | 2.7 | |
| 0.480 | (3289) | 1204 | 13869 | 28 | 24 | 1.4 |
We constructed also the second sample with the same restrictions as for the sample =971, but with 12000 km s-1 and 12000 km s-1, to diminish the influence of data incompleteness at large distances. In Table 5 we show the same data as in Table 4 but for the sample of galaxies with 12000 km s-1 and 12000 km s-1 .The designations are the same as in Table 3. The elimination of 50 remote galaxies does not change the dipole parameters much as well as the TF parameters .
| 0.432 | 0.14 (3033) | 1023 | 62 | 13 | 4.5 | ||
| 0.466 | (2993) | 1111 | 67 | 15 | 5.4 | ||
| 0.473 | (2657) | 1113 | 66 | 16 | 5.0 | ||
| 0.446 | (2995) | 1045 | 4.7 | ||||
| 0.481 | 0.15 (2978) | 1129 | 4.9 | ||||
| 0.495 | 0.16 (2601) | 1156 | 4.0 | ||||
| 0.453 | 0.15 (3101) | 1067 | 65 | 19 | 16 | 3.0 | |
| 0.491 | 0.16 (3033) | 1151 | 17 | 3.9 | |||
| 0.487 | 0.16 (2802) | 1141 | 21 | 2.5 |
Comparing the data in Tables 3 - 5 allows us to conclude:
1) The cleaning of the sample diminishes significantly the dispersion ( 2 times) and the bulk motion velocity modulus (about 1.5 – 2.5 times).
2) In all procedures (the cleaning of the sample, the use of regression with other magnitudes) the galactic longitude of apex changes little, within a 20 range.
3) The cleaning of the sample moves the apex to the galactic equator.
4 Peculiar velocity field
Basing on four-parametric regression (5) and derived peculiar velocities, we built the peculiar velocity field of the RFGC galaxies for the sample =921.
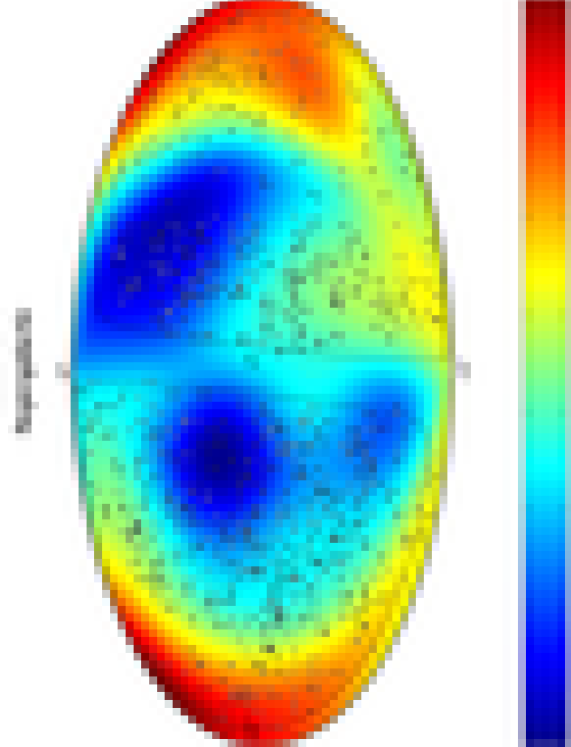
In Fig.4 we present a smoothed peculiar velocity field for them in supergalactic coordinates SGL, SGB. The solid line indicates the ”Zone of Avoidance” within 10 degrees around the Galactic equator, where effects from reddening, stellar contamination and incompleteness are significant. The galaxies with are designated by open circles, and the galaxies with with filled circles. The smoothing was done with a Gaussian filter of 20 window. The color scale at the bottom Fig.4 shows a range of average peculiar velocities from 200 km s-1 to +500 km s-1.
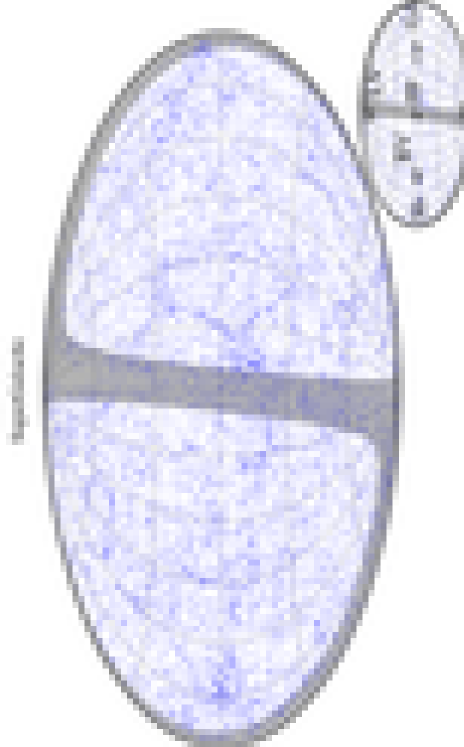
In Fig.5 we give the sky distribution in SGL, SGB of 22361 galaxies from the 2MASS survey selected by infrared axial ratio criterion . Bottom right the positions of the Great Attractor (GA), the Pisces-Perseus supercluster (PP), the Shapley concentration (Sh), as well as the Local Void (LV) and the Bootes Void (BV) are marked. Comparison of Figs. 4 and 5 shows that the regions with positive and negative smoothed velocities reveal, as a whole, the galaxy overdensed and underdensed regions. The regions with maximal positive lie in the direction of the GA and the Shapely Concentration. We should draw a cautionary note that the obscuring effects on the Milky Way are also at its maximum towards these regions (e.g., Abell 3627 of the GA region is well within the ”Zone of Avoidance”), rendering large regions of the sky incomplete in the 2MASS XSC and the RFGC. Significant negative are seen towards the voids, and low positive velocities (100 – 150 km s-1) are seen in the PP and Hercules - Coma - Corona Borealis superclusters.
5 Comparison with other data
To estimate the amount and quality of the observational material by which one was used to determine the bulk motion parameters, we introduce the value G, meaning the sample goodness
Here is the number of galaxies under study and is their dispersion on the TF diagram. From the papers of different authors, we took the sample of spiral galaxies lying mainly in sparse regions. In columns of Table 6 we give: (1) – designation of the sample, (2) – color band used, (3) – number of galaxies in the sample, (4) – the dispersion on the TF diagram, (5) – the sample goodness, (6) – source of data. The upper four lines note the samples included in the Mark III catalog with their respective name. The data for them are taken from the Tables 1 and 3 in Willick et al. (1997). The next three samples are interesting because of their relativelly large depth ( 10000 km s-1). The sample of Bamford (2002) was selected from the SCI sample of Giovanelli et al. (1997b). From 782 S galaxies placed in the clusters or groups Bamford selected 153 galaxies with available 2MASS photometry. Besides Bamford’s data, we have not yet encountered published TF results using 2MASS.
| Sample | Band | Reference | |||
|---|---|---|---|---|---|
| A82 field sample | 359 | 0.47 | 4.0 | Willick et al.,1997 (Mark III) | |
| MAT field sample | 1355 | 0.43 | 8.6 | Mark III | |
| W91PP field sample | 326 | 0.38 | 5.0 | Mark III | |
| CF field sample | 321 | 0.38 | 4.7 | Mark III | |
| Great Wall spirals | 172 | 0.32 | 4.2 | Dell’Antonio et al, 1996 | |
| Spirals in clusters | 522 | 0.38 | 6.0 | Dale et al, 1999 | |
| Spirals in clusters | 153 | 0.48 | 2.6 | Bamford, 2002 | |
| RFGC | 971 | 0.42 | 7.4 | This work |
In last line we give the results obtained in this paper. As seen, the data goodness varies over a rather wide range, and the enormous samples have, naturally, the higher value of .
Note, that different authors use various manners for creating their “pure” samples. In case of our sample, we have not yet made a detailed analysis of the observable errors, nor reduced the HI line measurements to a common system, nor analyzed the Malmquist bias. We excluded the outlying galaxies only statistically because of their greater than 3 deviations from the TF fit and large calculated . Nevertheless, our data are of high goodness (=7.4 in comparison with the median 4.8 for the samples in Table 6). As the minimal scatter on the TF diagram has a finite intrinsic value (0.25 – 0.30 mag), the improvement of the data goodness is undoubtedly associated with the significantly larger samples.
Let us compare briefly our results with the recent literature data. The most representative sample in Table 6, the Mark III catalog, yields the bulk motion km s-1 towards , in the volume of km s-1 (Dekel et al.,1999). Our dipole solution is consistent with the Mark III data. Zaroubi (2002) presents a review of the latest results of galaxy bulk motion measurements accomplished by different authors on various observational data. We compare our result with other dipole determinations using Fig.1 and Table 1 from Zaroubi (2002). Our RFGC sample can be considered as relatively distant (its depth reaches 18000 km s-1). At the comparable distances (100 – 150 Mpc h according to Zaroubi compilation, the bulk motion parameters were determined for the samples of distant elliptical galaxies, EFAR (Colless et al., 2001), distant Abell clusters, LP10 (Willick, 1999), point sources from IRAS -catalog (PSCz)(Saunders et al. 2000, Branchini et al. 2000), spiral galaxies in clusters and superclusters (Dale et al., 1999), and distant clusters, LP (Lauer & Postman, 1994).
The low amplitude of bulk motion, km s-1, determined in the present paper for 971 RFGC galaxies with 18000 km s-1 and 18000 km s-1, is in agreement with the results (0 – 200) km s-1 obtained for the samples EFAR, PSCz, SCI/SCII, as well as SNIa (Riess et al., 1997) which is consistent with the assumption of the flow field convergence to the CMB rest-frame at 100 h-1 Mpc. However, our result differs strongly from the bulk velocity obtained from LP10 and LP samples (700 km s-1). The low bulk velocity at large scales has been predicted by popular theories of structure formation in the cosmological model with cold dark matter and cosmological constant.
The bulk velocity apex obtained in this paper, , , is located near the apex position (, ) derived from SNIa by Riess et al. (1997) and, within the errors, lies near GA and the massive cluster Abell 3627.
6 Conclusion
We used the 2MASS TF relations to obtain parameters of bulk motion for flat edge-on galaxies from RFGC. Because about 71% of the all RFGC sample have , , magnitudes from 2MASS, the size of our sample under study is restricted only by the available HI line width data. At present, in there is a sample of 1141 all-sky distributed RFGC galaxies in our disposal with both 2MASS magnitudes and velocity/line-width estimates.
After excluding about 15% of the sample (dwarf galaxies, very distant ones, and also the objects which have deviation over 3 on the TF diagram), we built a set of multi- parametric TF relations using the Kron, isophotal, and extended , , magnitudes. The minimal dispersion on the TF diagram is shown to be that for Kron magnitude ( = 0.422.
For the RFGC sample of =971 galaxies with km s-1, the bulk velocity and apex position are: = 199 61 km s-1, , . The parameters of bulk motion change insignificantly with the use of other 2MASS magnitudes , , , , , , , ( changes within 50 km s-1, and within . This result remains robust to decreasing the sample depth. In particular, for 921 RFGC galaxies with 12000 km/s we obtained = 226 km s-1, , . Within the errors, our estimates of the bulk velocity are in agreement with the data for the EFAR, PSCz, SCI/SCII samples. Besides, the apex position and are consistent with the results obtained for SNIa.
The two-dimensional smoothed peculiar velocity field well traces the large-scale density variations in the galaxy distribution, e.g. Great Attractor, Pisces-Perseus an Hercules-Coma-Corona Borealis superclusters, Shapley concentration, Bootes and Local voids.
Thus, we show by the example of the RFGC catalogue that the 2MASS Tully-Fisher relation can be used successfully in studying galaxy cosmic flows. The next obvious step is to complete the observations of radial velocities and HI line widths for the remaining RFGC galaxies.
Acknowledgements.
We thank Dmitry Makarov for help in the Fig. 4 and Fig.5 design. This paper makes use of data products from the Two Micron All Sky Survey, which is a joint project of the University of Massachusetts and the Infrared Processing and Analysis Center/California Institute of Technology, funded by the National Aeronautics and Space Administration and the National Science Foundation. We have made use of the LEDA database (http://leda.univ-lyon1.fr). This research was partially supported by DFG-RFBR grant 436RUS 113/701/0-1.References
- (1) Aaronson M., Huchra J.P., Mould J.R., 1979, ApJ, 229,1
- (2) Aaronson M., Mould J.R., Huchra J.P., 1980, ApJ, 237, 655
- (3) Aaronsom M., Huchra J., Mould J. et al., 1982, ApJ, 258, 64 [A82]
- (4) Bamford S.P., 2002, Thesis, University of Durham (astro-ph/0210227)
- (5) Branchini E., et al. 2000, MNRAS, 308, 1
- (6) Colless M., Saglia R.P., Burstein D. et al., MNRAS, 2001, 321, 277 [EFAR].
- (7) Cutri R.M., Skrutskie M.F., Two Micron All Sky Survey Status Report, 1998, BAAS, 30, 1374.
- (8) Dale D. A., Giovanelli R., Haynes M.P. et al., 1999, AJ, 118, 1489
- (9) Dekel A., Eldar A., Kollat T. et al. 1999, ApJ, 522, 1
- (10) Dell’Antonio I. P., Bothun G. D., Geller M. J., 1996, AJ, 112, 1759 [Great Wall]
- (11) Giovanelli R., Avera A., Karachentsev I.D., 1997a, AJ, 114, 122
- (12) Giovanelli R., Haynes M. P., Herter T. et al., 1997b, AJ, 113, 22
- (13) Haynes M.P., Giovanelli R., Chamaraux P., et al., 1999, AJ, 117, 2039
- (14) Huchtmeier W. K. et al., 2003, in preparation
- (15) Jarrett T. H., 2000, PASP, 112, 1008
- (16) Jarrett T. H., Chester T., Cutri R. et al., 2000, AJ, 119, 2498
- (17) Jarrett T. H., Chester T., Cutri R. et al., 2003, AJ, 125, 525
- (18) Karachentsev I.D., Karachentseva V.E., Kudrya Yu. N. et al., 1999, Bull. SAO, 47, 5 [RFGC]
- (19) Karachentsev I.D., Karachentseva V.E., Kudrya Yu. N. et al., 2000a, Bull. SAO, 50, 5
- (20) Karachentsev I. D., Karachentseva V. E., Kudrya Yu. N. et al., 2000b, Astron. Zh., 77, 175
- (21) Karachentsev I. D., Smirnova A.A., 2002, Astrofizika, 45, 547
- (22) Karachentsev I. D., Mitronova S.N., Karachentseva V. E., Kudrya Yu. N., Jarrett T.H., 2002, AA, 396, 431 (Paper I).
- (23) Kilborn V. A., Webster R. L., Staveley-Smith L. et al., “A Catalog of HI-Selected Galaxies from the South Celestial Cap Region of Sky”, 2002
- (24) Kogut A., Lineweaver C., Smoot G. F. et al., 1993, ApJ, 419, 1
- (25) Lauer T.R., Postman M., 1994, ApJ, 425, 418 [LP].
- (26) Makarov D.I., Karachentsev I.D., Tyurina N.V. et al., 1997a, Astronomy Letters, 23, 445
- (27) Makarov D.I., Karachentsev I.D., Burenkov A.N. et al., 1997b, Astronomy Letters, 23, 638
- (28) Makarov D.I., Burenkov A.N., Tyurina N.V., 1999, Astronomy Letters, 25, 706-711
- (29) Makarov D.I., Burenkov A.N., Tyurina N.V., 2001, Astronomy Letters, 27, 213-216
- (30) Mathewson D.S., Ford V.L., Buchhorn M., 1992, ApJS, 81, 413
- (31) Mathewson D.S., Ford V.L., 1996, ApJS, 107, 97
- (32) Matthews L.D., van Driel W., 2000, AAS, 143, 421
- (33) Paturel G., Bottinelli L., Di Nella H. et al. 1996, Catalogue of Principal Galaxies, Saint-Genis Laval, Observatoire de Lyon (LEDA)
- (34) Riess A.G., Davis M., Baker J., & Kirshner R.P, 1997, ApJ, 488, L1 [SNIa]
- (35) Saunders W., et al., 2000, MNRAS, 317, 55
- (36) Schlegel D. J., Finkbeiner D. P., Davis M., 1998, ApJ, 500, 525
- (37) Skrutskie M.F. et al. 1997, in ASSL, Vol 210: The Impact of Large Scale Near-IR Sky Surveys, 25 - 32
- (38) Tully R. B., Fouqué P., 1985, ApJS, 58, 67
- (39) Verheijen M. A., 2001, ApJ, 563, 694
- (40) Willick J. A., Courteau S., Faber S. M. et al., 1997, ApJS, 109, 333 [Mark III]
- (41) Willick J.A., 1999, ApJ, 516, 47 [LP10].
- (42) Zaroubi S., 2002, astro-ph/0206052