SINGS: The SIRTF Nearby Galaxies Survey
Abstract
The SIRTF Nearby Galaxy Survey is a comprehensive infrared imaging and spectroscopic survey of 75 nearby galaxies. Its primary goal is to characterize the infrared emission of galaxies and their principal infrared-emitting components, across a broad range of galaxy properties and star formation environments. SINGS will provide new insights into the physical processes connecting star formation to the interstellar medium properties of galaxies, and provide a vital foundation for understanding infrared observations of the distant universe and ultraluminous and active galaxies. The galaxy sample and observing strategy have been designed to maximize the scientific and archival value of the data set for the SIRTF user community at large. The SIRTF images and spectra will be supplemented by a comprehensive multi-wavelength library of ancillary and complementary observations, including radio continuum, HI, CO, submillimeter, , H, Paschen-, ultraviolet, and X-ray data. This paper describes the main astrophysical issues to be addressed by SINGS, the galaxy sample and the observing strategy, and the SIRTF and other ancillary data products.
To appear in PASP, August 2003
1 Introduction
Nearly half of the bolometric luminosity of the local universe is channeled through the mid- and far-infrared emission of galaxies; this spectral region directly probes the youngest star-forming regions and their associated interstellar gas and dust. However, existing infrared (IR) instruments have only begun to probe the full ranges in star formation rates, interstellar medium (ISM) properties, and dynamical environments found in external galaxies. The SIRTF Nearby Galaxies Survey (SINGS) is designed to characterize the infrared emission of present-day galaxies and probe the full range of star formation environments found locally, including regions that until now have been inaccessible at infrared wavelengths. The observations include imaging and low-resolution spectroscopy of 75 nearby galaxies ( Mpc), and high-resolution spectroscopy of their centers and a representative set of extranuclear infrared-emitting regions. These data will be supplemented with an extensive library of ground- and space-based data at other wavelengths.
The primary scientific objective of SINGS is to use observations of these galaxies at infrared, visible, and ultraviolet wavelengths to obtain complete maps of the current star formation, that are free of most physical biases imposed by interstellar dust. These will be used in turn to robustly model the extinction, heating, and infrared emission of the dust, and carry out a critical comparison and integration of ultraviolet, H, and infrared-based estimates of star formation rates (SFRs) in galaxies. The infrared spectra will provide spectral diagnostics of the ionized, neutral, molecular, and dusty ISM phases of individual star-forming regions, and will probe the interactions between young stars and their surrounding ISM over a much wider range of physical and dynamical environments than can be probed in the Galaxy.
In addition, SINGS will provide an archive of spatially-resolved images and spectra of nearby galaxies that will enable a rich set of follow-up investigations of star formation and the ISM. The galaxy sample and observing strategy are designed to maximize the long-term scientific return of the data for the SIRTF user community as a whole. The multi-wavelength archive, which will include SIRTF observations as well as a set of , H, Paschen-, ultraviolet, far-infrared and submillimeter, X-ray, CO, HI, and radio continuum data, will provide a foundation of data and comparison samples for future SIRTF General Observer (GO) observing projects by other investigators.
This paper is organized as follows. In § 2 we describe the core science program for SINGS, and highlight some of the many archival applications of the data set. In § 3 we describe the design and the properties of the galaxy sample, and § 4 describes the SIRTF observations themselves. The ancillary data being obtained by our team and by other groups are described in § 5. As with all SIRTF Legacy projects the pipeline data products will be available immediately, with no proprietary period. However, the SINGS team will also produce a set of enhanced value data products (e.g., mosaicked images, spectral data cubes), and software tools, and these are described in § 6. For a general description of SIRTF and its instruments we refer the reader to Gallagher, Irace, & Werner (2002).
2 Scientific Objectives
Information on the large-scale distribution of star formation in galaxies, and its coupling to the underlying properties of the ISM is critical to a host of larger astrophysical problems– the physical nature and origin of the Hubble sequence, the structure and phase balance of the ISM, the interpretation of observations of the high-redshift universe, the nature and triggering of starbursts– and as a lynchpin for the physical understanding and modeling of galaxy formation and evolution. Nearby galaxies offer the unique opportunity to study this SFR–ISM coupling on a spatially-resolved basis, over large dynamic ranges in gas density and pressure, metallicity, dust content, and other physically relevant parameters.
SIRTF’s unique contribution derives from its ability to probe the flow of energy from stars into the ISM on scales ranging from the immediate environs of star-forming molecular clouds to the radiative transfer of diffuse radiation on kiloparsec scales (Helou 2000). Within star-forming regions, stellar radiation shining on the surrounding gas produces a series of ISM components, all of which are probed in the infrared. (Figure 1). Ionizing radiation produces an H II region that is traced by a suite of mid-infrared fine structure lines from species covering a wide range of ionization states. Outside of the ionization front the gas becomes optically thick to hydrogen-ionizing photons, but ultraviolet photons in the range 6 eV 13.6 eV dissociate molecules, ionize atoms like C, Si, and Fe, and heat the gas via grain photoelectric heating to form a photodissociation region or PDR (Hollenbach & Tielens 1999). Deeper within the clouds, the warm molecular interface is directly observable via the pure rotational transitions of molecular hydrogen (H2). Dust grains are present throughout these phases and provide diagnostics of the physical conditions in the star-forming regions, through the thermal continuum emission and the aromatic emission bands. Much of this emission arises from dust grains in HII regions and PDRs, but dust in ambient clouds illuminated by the general interstellar radiation field (ISRF) can also be important (Lonsdale & Helou 1987). Another energy channel – mechanical energy transfer – can be traced via shock-sensitive features such as H2, [Si II], and [Fe II].
2.1 Science Drivers: The Physics of the Star Forming ISM and Galaxy Evolution
In contrast to the study of the formation of individual stars, which has advanced dramatically over the past two decades, our theoretical understanding of star formation on galactic scales remains relatively immature. The limitations begin at the very foundation, with our limited ability to measure and map the large-scale star formation rates (SFRs) in galaxies. Ground-based observations using H and other nebular recombination lines and direct observations of the ultraviolet continua of galaxies from space have provided high-resolution maps of star formation in hundreds of nearby galaxies (Kennicutt 1998a and references therein). However the interpretation of these data is limited by interstellar dust, which absorbs roughly half of the emitted ultraviolet (UV) and visible radiation of typical star-forming galaxies, and more than 90% in extreme cases such as infrared-luminous starburst galaxies (e.g., Calzetti et al. 1994; Wang & Heckman 1996; Buat et al. 1999, 2002; Sullivan et al. 2000; Bell & Kennicutt 2001, Calzetti 2001; Goldader et al. 2002). Since the intensity of the star formation itself is strongly correlated with the column densities of gas and dust (Kennicutt 1998b), the most extincted regions preferentially occur in the regions with highest SFR density. Thus our picture of galactic star formation based on visible-UV observations alone is both incomplete and physically biased. This bias may be even more important at high redshift, where intense and compact starbursts associated with the formation of galactic spheroids are prevalent (e.g., Barger et al. 2000; Giavalisco 2002).
A similar physical dichotomy between UV-bright and IR-bright regions is seen on the scale of individual star-forming regions (Kennicutt 1998a,b). The giant OB/HII associations in disks which dominate the visible star formation have mean emitting gas densities of order 10–100 cm-3, neutral molecular column densities of order cm-2 and visual extinctions of 0–3 magnitudes. By contrast the regions that contain the bulk of star formation in IR-luminous starburst galaxies are located in circumnuclear environments, with typical densities of order cm-3, molecular column densities of cm-2, and visual extinctions of 5–1000 magnitudes (Kennicutt 1998a). Visible and UV diagnostics cannot be applied reliably in these regions, and instead most of our information comes from IR and radio recombination and fine-structure lines. Because of this observational segregation between the physical regimes that have been (in)accessible in the UV–visible and IR, the two sets of spectral diagnostics have not been fully tested against each other, and questions remain about whether we are interpreting the respective sets of spectra in a consistent manner. The long-standing controversy over whether the initial mass function (IMF) of young stars in IR-luminous starbursts is radically different from that observed in optically-selected star-forming regions is a prime example of this ambiguity (e.g. Rieke et al. 1993; Lutz 2000; Alonso-Herrero et al. 2001). An important step toward breaking this impasse is to apply a homogeneous set of IR spectral diagnostics across the entire range of star-forming regions, ranging from the most dust-obscured nuclear regions to objects in the disk that have traditionally been studied using optical spectra.
2.2 Contributions from IRAS and ISO
The Infrared Astrononical Satellite (IRAS) survey detected the integrated dust emission from tens of thousands of nearby galaxies, and revealed a new class of infrared-luminous starburst galaxies (Soifer, Neugebauer, & Houck 1987). Since that time several groups have combined IRAS data for nearby galaxies with UV and/or H fluxes, to test the reliability of the far-infrared (FIR) luminosity of a galaxy as a quantitative SFR tracer, and to quantitatively assess the effects of extinction on the UV and optical SFR tracers (e.g., Helou 1986; Lonsdale & Helou 1987; Rowan-Robinson & Crawford 1989; Devereux & Young 1990; Sauvage & Thuan 1992; Buat & Xu 1996; Walterbos & Greenawalt 1996; Bell & Kennicutt 2001; Buat et al. 2002; Dopita et al. 2002; Kewley et al. 2002). The FIR has proven to be a uniquely powerful tracer of the SFR in galaxies dominated by young stars and with high dust optical depths, where the infrared continuum provides a near-bolometric measurement of the stellar radiation output and SFR (Kennicutt 1998b).
Interpreting this emission in normal galaxies has proven to be more difficult, however. There the dust can also be heated by older stars, and the fractional contribution of this “cirrus” component to the total FIR emission is a strong function of galaxy properties and the SFR itself (Helou 1986; Lonsdale & Helou 1987; Rowan-Robinson & Crawford 1989; Walterbos & Greenawalt 1996). Moreover, the infrared emission may under-represent the output of regions with low dust content. Despite these concerns recent work comparing the reddening-corrected H-based and FIR-derived SFRs show a surprisingly good agreement over a wide range of galaxy types and SFRs, which suggests that at least for normal galaxies the effects of older stars and dust opacity on the FIR are less serious than anticipated (e.g., Dopita et al. 2002; Kewley et al. 2002). Unfortunately it is difficult to model the effects of dust extinction and dust heating in a realistic way, because of the complex geometry of the dust and heating sources, and the absence of high-quality FIR data. The best spatial resolution achievable in the far-infrared IRAS images is of the order of an arcminute, and for all but the nearest galaxies this is insufficient to robustly model the dust heating and radiation reprocessing.
Major inroads into addressing these problems have come from the the Infrared Space Observatory (ISO), which provided higher-resolution imaging as well as spectroscopic observations of galaxies in the 3–200 µm range (Kessler et al. 1996). Several surveys directed at nearby normal galaxies were carried out, including the ISO Key Project on the Interstellar Medium of Normal Galaxies (Helou et al. 1996), which obtained comprehensive imaging and spectroscopy for a sample of 60 galaxies with a wide range of infrared and optical properties (Dale et al. 2001; Malhotra et al. 2001; Lu et al. 2003). Other major programs included an imaging survey of 77 Shapley-Ames spiral and S0 galaxies (Bendo et al. 2002a, b, 2003), surveys of the Virgo cluster (Boselli et al. 1998; Tuffs et al. 2002; Popescu & Tuffs 2002; Popescu et al. 2002), and an imaging and spectroscopic survey of normal and barred spiral galaxies (Roussel et al. 2001a).
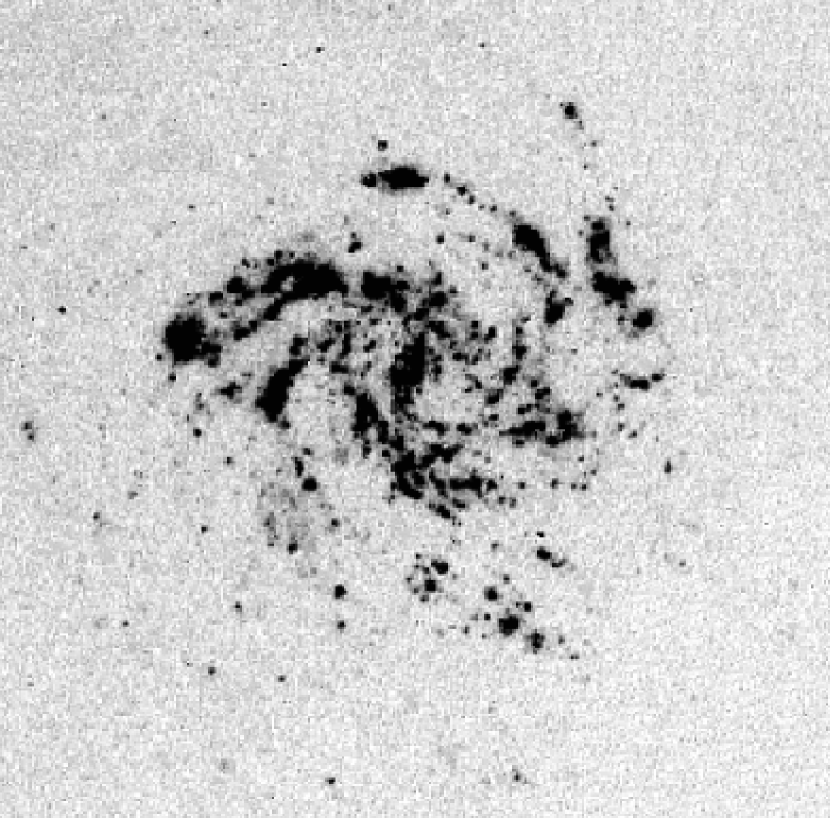
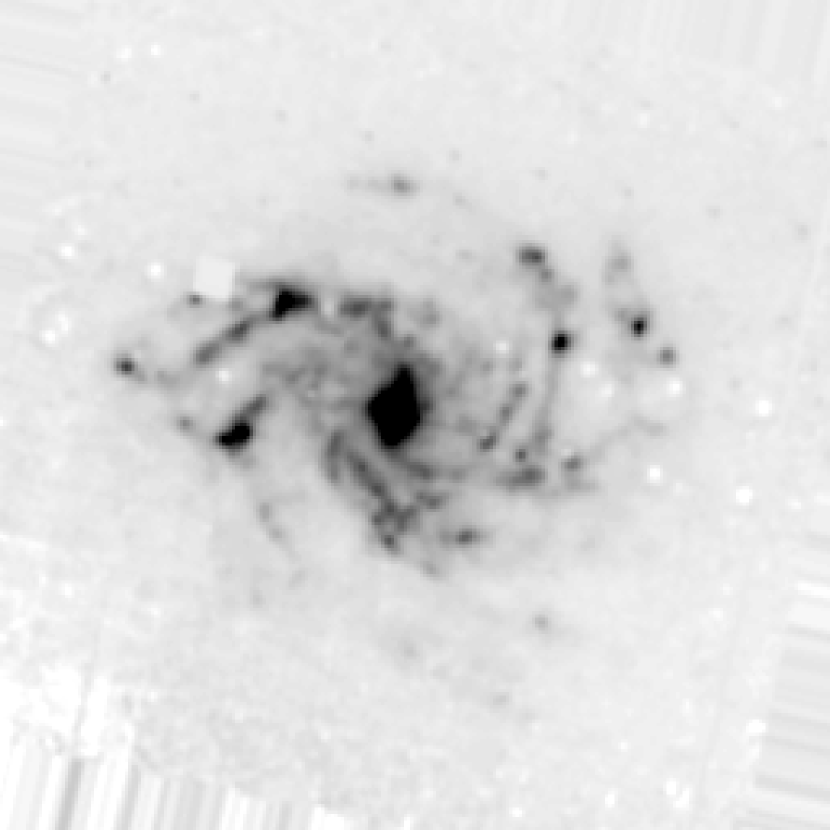
The superior spatial resolution of ISO relative to IRAS provided valuable new information on the distribution of emitting dust and the associated star formation in galaxies, but this advantage was mainly limited to wavelengths shortward of 15 m, where the dust emission is dominated by band emission from small aromatic hydrocarbon dust grains (e.g., Cesarsky et al. 1996; Helou et al. 2000; Sturm et al. 2000; Hunter et al. 2001; Roussel et al. 2001a, b). An example is shown in Figure 2, which compares an ISO map of the nearby galaxy NGC 6946 (a member of the SINGS sample) with a groundbased H image (Dale et al. 2000). It is clear that in the outer disk the H emission and dust emission trace the same general star formation component. However there are large local variations in the infrared/H intensity ratio, which are due to changes in dust opacity, radiation field intensity, and differences in the ages of the star-forming regions. The emission from the central starburst is much stronger in the infrared (relative to the visible), because of the much higher optical depth of dust in that region. Because the local intensity of star formation itself tends to correlate with gas and dust column density (e.g., Kennicutt 1998b; also see Fig. 4), the infrared emission provides a probe of the most intense starbursts that is virtually inaccessible in the visible and ultraviolet.
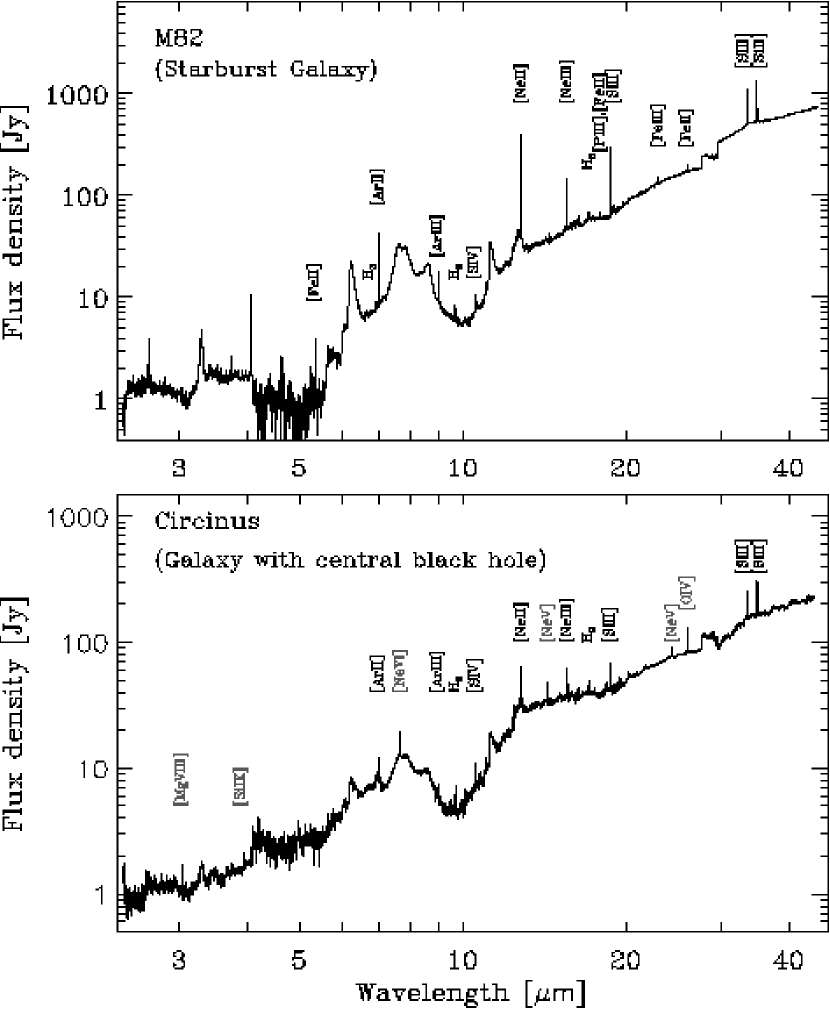
ISO has also made a major contribution by producing mid- and far-infrared spectra for a sample of infrared-luminous galaxies, and for a few lower-extinction star-forming regions in disks (e.g. Sturm et al. 2000; Thornley et al. 2000; Helou et al. 2000; Malhotra et al. 1997, 2001). The richness of emission-line and emission-band diagnostics in this region of the spectrum is illustrated in Figure 3, which shows ISO SWS spectra of M82 and the Circinus galaxy with the principal diagnostic lines labeled. These include ionized tracers of stellar photoionized HII regions (e.g., [NeII] 12.8m, [NeIII] 15.6m, [SIII] 18.7, 33.5m, [SIV] 10.5m), high-ionization tracers for application to AGNs, shocks, and very hot stars (e.g., [OIV] 25.9m, [NeV] 14.3m), low-ionization tracers of shocks and PDR regions ([FeII] 26.0m, [SiII] 34.8m), the S(0) and S(1) molecular rotational lines of H2 (17 and 28 m), and the PAH dust bands in the 5–14 µm region. Spectroscopy of [CII] 158 µm in normal star-forming galaxies has provided insight into the microphysics of the ISM. Galaxies with warmer far-infrared colors (larger 60/100 m flux ratios) show a smooth decline in the [CII]/FIR ratio (Malhotra et al. 2001), which has been attributed to less efficient photo-ejection of electrons from increasingly charged small grains in more actively star forming regions. This interpretation is supported by a strong correlation between [CII] line emission and 5–10 µm dust emission in star-forming galaxies (Helou et al. 2001), because the latter is a measure of the small grain photoelectric heating rate.
In terms of ISO continuum spectroscopy, we have learned that the mid-IR spectrum (µm) is nearly shape-invariant on the scale of galaxies, as a consequence of the single-photon heating nature of the PAH dust (Draine & Li 2001). The shape of the complete infrared spectrum can be parametrized by a single variable, the 60/100 m flux ratio (Helou et al. 2000; Dale & Helou 2002; Lu et al. 2003). Both of these discoveries bode well for interpreting high-z galaxies using IR spectral templates based on nearby galaxies.
2.3 SINGS Project Goals
SIRTF promises a breakthrough in this field, because it will produce spatially-resolved infrared spectral energy distributions (SEDs) of galaxies with sufficient angular and spectral resolution to separate individual dust emission and heating components. The SIRTF images have sufficient sensitivity to map the thermal dust emission over most or all of the optical extent of spiral and irregular galaxies. Likewise the spectroscopic sensitivity of SIRTF makes it possible to apply a consistent set of diagnostics across the local populations of galaxies and star-forming regions.
To contribute optimally to these investigations, SIRTF must be used in a manner that is best adapted to its finite angular resolution. We have therefore adopted a two-part strategy. In the first part, 75 galaxies will be imaged completely with IRAC and MIPS, and partially mapped with low-resolution spectroscopy, to characterize the global infrared and star-forming properties of nearby galaxies, and explore their dependencies on type and other integrated properties. In the second part, we will use complete spectroscopic observations to physically characterize a set of discrete infrared-emitting sources. These include the nuclear regions of each of the 75 galaxies, and observations of 75 extranuclear regions in 20 of the galaxies, divided between visible star-forming regions and infrared-bright objects discovered with our SIRTF images, chosen to contain the complete range of physical characteristics. The combination of these two data sets will fully characterize the infrared properties of normal galaxies, and enable a broad set of astrophysical applications.
A major focus of our analysis will be to test and develop improved diagnostics of SFRs in galaxies, based on a critical comparison of the ultraviolet, H, and infrared data (e.g., Popescu et al. 2000; Roussel et al. 2001a; Bell et al. 2002). The key to breaking the degeneracies that currently limit the modeling of extinction and dust heating is to map the re-radiated dust emission on angular scales that are comparable to those of individual infrared-emitting (and star-forming) regions. In most star-forming galaxies the bulk of the dust radiation is emitted in the far-infrared, with a peak between 50 and 150 µm (Figure 1 and Dale et al. 2000; Dale & Helou 2002; Bendo et al. 2002b). Hence a central element of our program is imaging of the SINGS galaxies at 24–160 µm with MIPS, and SED mapping at 10–99 µm with IRS and MIPS. At the shorter wavelengths these maps will possess comparable or superior resolution to the ISOCAM 15 µm maps illustrated in Figure 2, and even at the longest wavelengths we will obtain images with over 200 resolution elements for a median-size galaxy in our sample ( 10′, where denotes the isophotal diameter from the RC3: de Vaucouleurs et al. 1991). The IRAC camera on SIRTF will allow us to measure the mid-infrared dust emission at 2″ resolution. Although this spectral region (5–8 µm) is roughly a factor of ten shortward of the thermal dust emission peak, and the radiation is dominated by band emission from molecular aggregates or small grains, studies with ISO reveal a surprisingly good correlation between the dust emissivity at these wavelengths and the SFR, over an extended range of physical conditions and spatial scales (Roussel et al. 2001a). We will test the reliability of the mid-infrared emission as a quantitative SFR tracer, as it offers the tantalizing prospect of mapping star formation in galaxies on arcsecond angular scales.
The products of this analysis will be maps of the total star formation, as well as maps of the UV–visible extinction and separate distributions for the UV-bright and dust-obscured star formation. These will allow us to delineate the broad trends in SFR as functions of local and global galaxy properties, and they will reveal any systematic differences between the distribution and amounts of obscured vs. unobscured star formation that may be present, as functions of radial location, metallicity, galaxy type, or dynamical environment (e.g., Kennicutt 1983, 1998a; Roussel et al. 2001b). Since the infrared-bright regions preferentially trace the densest and youngest star-forming environments, such patterns must be present.

Another area of investigation will be the combination of the SFR distributions with spatially-resolved CO and HI maps to probe the form of the star formation law over the full range of ISM environments found in nearby galaxies. The potential of such an analysis is illustrated in Figure 4 (taken from Kennicutt 1998b), which compares the disk-averaged SFRs and gas densities in normal galaxies (symbol) and infrared-selected starburst galaxies (symbol). There appears to be a single Schmidt law (index N 1.4 – 1.5) which reproduces the SFRs across this range of regimes. We will combine the spatially-resolved SFRs maps with gas density data from the Berkeley Illinois Millimeter Array Survey of Nearby Galaxies (BIMA SONG) project (Helfer et al. 2003) and high-resolution HI maps (see § 5.5) to test whether this law holds on a point-by-point basis. Any such application is limited by the validity of the CO emissivity as a molecular gas tracer, of course, and the dust masses derived from the SIRTF SED maps should enable us to place some useful limits on the variability of the CO/H2 conversion factor. Other applications will include direct mapping of the dust density and temperature distributions (e.g., Dale et al. 2000; Li & Draine 2002), construction of an improved radiative transfer model for dust in galaxies using the DIRTY code (Gordon et al. 2001; Misselt et al. 2001), and use of the unprecendented sensitivity of SIRTF to search for dust in gas-poor galaxies, metal-poor objects, and in the halos of galaxies.
SIRTF will also allow us for the first time to apply the powerful suite of mid-infrared spectral diagnostics to galactic IR-emitting components that span the full range of metallicities, densities, extinctions, and radiation field properties found in normal galaxies. These observations provide the link between the observed infrared spectra of galaxies and the physical conditions in the emitting gas and dust, and are crucial inputs for interpreting the integrated SEDs and spectra of high-redshift objects and more luminous starburst galaxies. They will also allow us to study the dependence of the physical and chemical properties of the dust (e.g., size distribution, composition) on environmental conditions such as metal abundance and SFR.
As a quantitative illustration of the sensitivity of SIRTF for these applications, we can apply the nominal pre-launch instrumental sensitivity estimates for a few applications of interest. For a galaxy at a fiducial distance of 3.5 Mpc (the distance of the M81 group, a primary component of our sample), the spatial resolution of the telescope projects to linear dimensions ranging from 40 pc (2 pixels, 2.5–8 m) to 100, 300, and 700 pc (/D respectively at 24, 70, and 160 m). At this distance a 10 s set of MIPS integrations at 24, 70, and 160 m will detect with 10- significance a star forming region with SFR = yr-1 (comparable to the Orion core), with a typical cloud mass (gas dust) of order M⊙. Likewise a 10 s integration set with IRAC can detect the dust emission from 104 M⊙ of ISM illuminated by the average ISRF. These cloud masses correspond to limiting gas column densities over the respective resolution elements of order a few times to H cm-2, with deeper limits achievable with longer integration times. For high-resolution spectroscopy, IRS would measure the [NeII] 12.8 m emission line from a Orion-luminosity region at 10- significance in a 30 s integration, or the H2 emission from the S(0) and S(1) lines at 17 and 28 m of a M⊙ cloud at 100 K in 500 s (again at 10 significance).
These numbers serve to illustrate the wide range of applications that will be possible either with the SINGS archive or follow-up GO observations. When the IRS spectra are combined with the IR SEDs and UV-visible spectra we will be able to carry out powerful cross-checks on the SFR and dust properties of the regions as diagnosed by the independent tracers. Specific investigations will include the use of the aromatic features in emission (AFE’s) to constrain dust heating and radiative transfer models (e.g., Boselli et al. 1998; Helou et al. 2000, Li & Draine 2001, 2002), and as possible direct indicators of the SFR, as described earlier. Spectra of the ionized regions will be used to constrain systematic variations in the stellar temperatures and IMFs in the galaxies, and to test the strong mid-infrared lines as quantitative SFR tracers (e.g., Roche et al. 1991). Observations of the low-ionization lines (e.g., [SiII] 34.8m, [FeII] 26.0m) and H2 rotational lines will be used to test for systematic differences in the physical conditions in the environments of circumnuclear and disk star-forming regions, and to test shock, H II region, and photodissociation diagostics based on these lines, over a much larger range of physical conditions than can be probed in the Galaxy.
2.4 Other Scientific Applications and Archival Science
As with all of the SIRTF Legacy science projects, the target samples and observing strategy were designed to support a wide range of scientific applications beyond the core program described in the previous section. A comprehensive description of the types of archival applications of the SINGS data is beyond the scope of this paper, but a few examples will serve to illustrate the variety of potential applications.
One of our primary data products will be a complete galaxy SED library, including broadband integrated SEDs covering 0.4–160 m, and eventually with extended coverage over 0.15 – 850 µm for many objects, when our SEDs are integrated with observations from GALEX and JCMT (see §5). A spectral library of the 150 discrete sources (circumnuclear regions, extranuclear HII regions, extranuclear IR sources) will also be produced, covering the 5–37 µm range, and with matching optical spectra or emission-line fluxes over the 0.36–0.7 µm range for most regions. These data should be especially useful for interpreting data from other Legacy programs (e.g., GOODS, SWIRE), for interpreting submillimeter surveys of distant galaxies, and for planning future facilities such as ALMA, Herschel, and SAFIR. The same data should be useful for modeling the composite emission from ultraluminous infrared galaxies (ULIRGs), and by helping to identifying the truly unique physical attributes of these objects (not represented in the normal galaxies in our sample), and thus constrain their origins and evolutionary paths.
The IRAC images at 3.6 and 4.5 m, when combined with groundbased near-infrared images, and correcting for hot dust emission at these wavelengths, can provide constraints on the stellar mass distributions in galaxies, and these are relevant to a wide range of problems including bar structures, spiral density waves, and better constraining the dark matter properties of galaxies, e.g., by modeling the stellar mass–to–light ratio. The wide range of inclinations in the sample can also be used to study the extinction properties of disks as a function of wavelengths, and address the long-standing debate over the opacities of galactic disks at visible and near-infrared wavelengths (e.g., Valentijn 1994; Giovanelli et al. 1994; Burstein 1994).
The SINGS data will also provide several means of studying the spatial distribution of hot and cold dust in galaxies (e.g., Lu et al. 2003). The IRAC bandpasses have been selected to allow separation of aromatic emission band features from (largely) continuum regions, and thus it will be possible to construct high-resolution emission maps of the warm dust. At longer wavelengths SIRTF will offer unprecendented sensitivity to emission from the cold “cirrus” component of dust, and these can be used to test for the presence of dust halos, streamers, or clouds around nearby galaxies (e.g., Nelson et al. 1998, Alton et al. 1998, Trewhella et al. 2000, Stickel et al. 2003). The MIPS images can also be used to place strong limits on the total ISM (gas + dust) contents of early-type galaxies.
Although it is not a main component of the SINGS core science program, the connection between AGN activity and circumnuclear star formation activity can be explored in detail with these data. The sample contains the full range of nuclear types, including HII region, LINER, and Seyfert nuclei. The availability of high-resolution spectra in the 10–37 µm region (and low resolution at 5–14 µm) will make it possible to compare the physical conditions and ionization properties of the regions from fine-structure line diagnostics with those derived from optical spectra. The centers of the SINGS galaxies will be spectroscopically mapped at 15 positions (§ 4), providing some separation of nuclear and circumnuclear emission, within the limitations imposed by the spatial resolution of SIRTF (2–9″ FWHM at 5–37 µm).
As a final example, a wide range of gasdynamical processes, including large-scale shocks produced by bars, spiral density waves, and interactions are manifested in the mid-IR continuum and the shock sensitive [SiII], [FeII], and H2 features. The IRAC imaging and low-resolution IRS SED strips should isolate examples of these shocks, which can be followed up with pointed spectroscopy as part of the SIRTF GO Program.
3 Sample Definition and Properties
In order to maximize the archival value of the SINGS dataset, and to incorporate as diverse a population of galaxies and infrared emitting regions as possible, we adopted a physically-based approach to defining the samples. These address the needs of the scientific program described in the previous section, and also provide representative samples for other astrophysical applications, as well as reference and control samples for future GO observing programs.
3.1 Galaxy Sample
In order to achieve the scientific goals described above and at the same time to maximize the archival value of survey, we decided from the outset to observe as diverse a set of local normal galaxies as possible. The size and precise nature of the sample, however, was heavily influenced by a set of technical considerations. The principal limiting factor in the performance of SIRTF for this type of science is its angular resolution, which ranges from about 2″ with IRAC to 40″ in the 160 µm imaging channel of MIPS. To maximize the linear resolution we need to study nearby objects. We found that most of the range of normal galaxy properties could be covered by a sample with a maximum distance of 30 Mpc; the median distance of the sample is 9.5 Mpc (for H0 = 70 km s-1 Mpc-1). Most of the IRAC and MIPS imaging channels cover a field of 5′ square, so to make efficient use of the observing time we selected most of our galaxies to have sizes in the 5–15′ range (a few smaller galaxies were included in order to cover the full physical parameter space described below). Finally, the sample size was dictated by a balance between achieving a representative range of galaxy properties and practical limitations in observing time. This led to a sample of 75 galaxies, requiring 512 hours of SIRTF time.
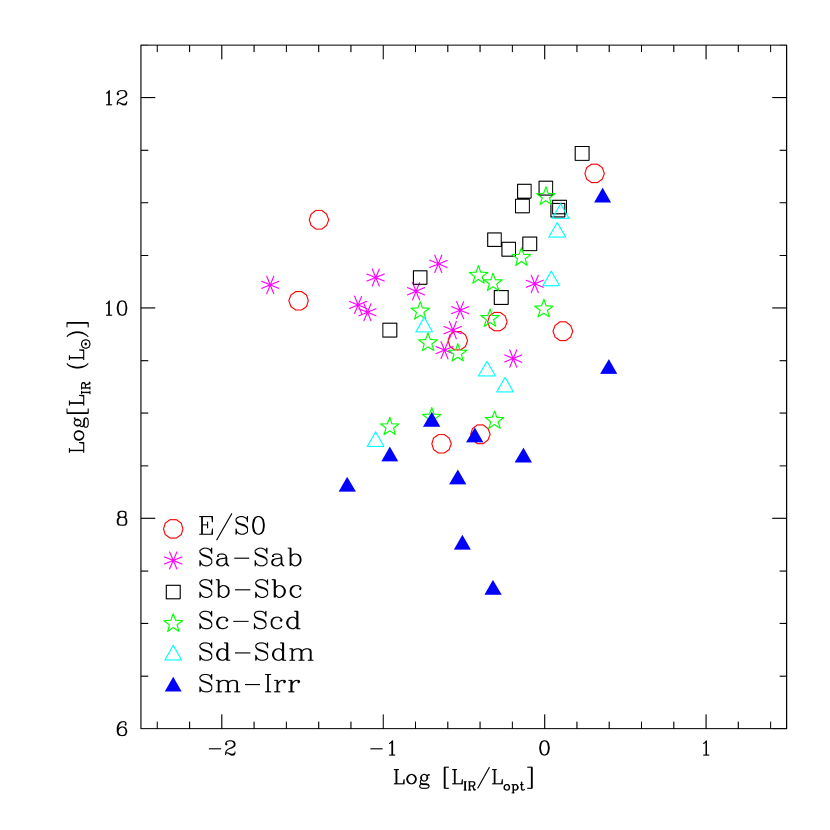
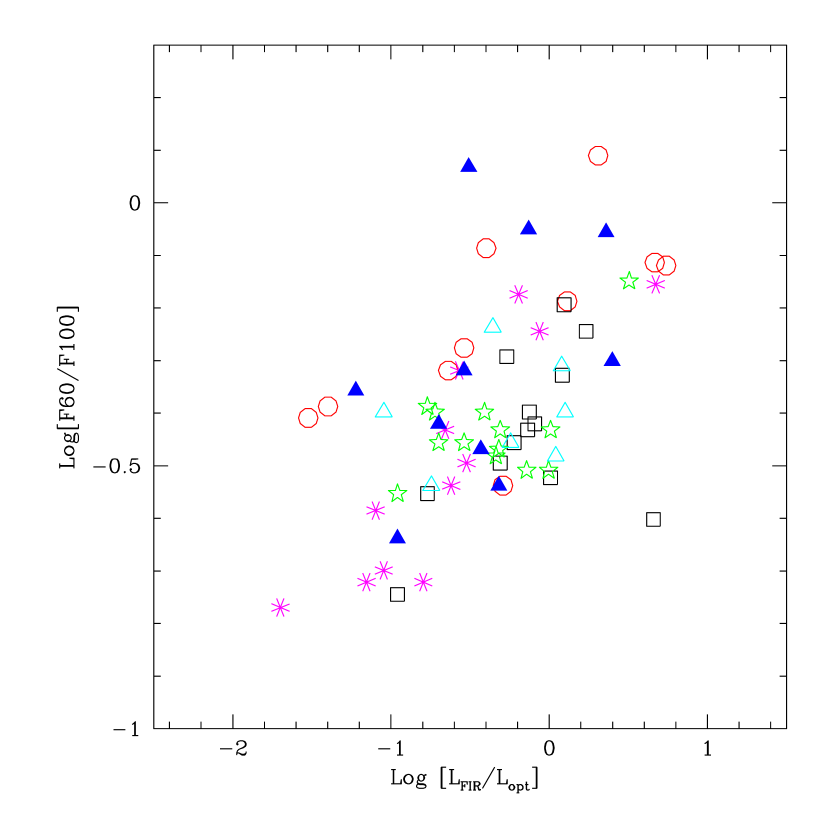
To construct a sample of candidate galaxies we adopted a methodology used in the ISO Key Project (Helou et al. 1996), and considered a 3-dimensional parameter space of physical properties: morphological type (which also correlates with bulge/disk structure, gas fraction, and SFR per unit mass), luminosity (which also correlates with galaxy mass, internal velocity, and mean metallicity), and FIR/optical luminosity ratio (which also correlates with the dust optical depth, dust temperature, and inclination). We examined the distribution of nearby galaxies in this 3-dimensional space and selected objects that cover the full range of properties that ought to be detectable with SIRTF. Specifically, we chose roughly a dozen galaxies in each RC3 (de Vaucouleurs et al. 1991) type (E–S0, Sa–Sab, Sb–Sbc, Sc–Scd, Sd–Sm, Im–I0), which covered the full combination of luminosity and infrared/optical ratio. Figure 5 shows the distribution of SINGS galaxies in this parameter space. The sample is very diverse, covering a factor of in infrared luminosity and in LIR/Lopt.
When constructing the sample we also took pains to cover a representative range of other galaxy properties, including nuclear activity (quiescent, starburst, LINER, Seyfert), inclination, surface brightness, CO/HI ratio, bar structure, spiral arm structure (grand-design vs flocculent), and environment (i.e., isolated galaxies, interacting galaxies, group members, and cluster members). Our goal was not to cover a representative range of all of these secondary properties (impossible with a sample of only 75 galaxies), but rather to avoid introducing an unintended bias into the sample with respect to any of these properties.
The final selection of galaxies also took into account practical factors such as Galactic and ecliptic latitude. We excluded most galaxies near the Galactic plane to avoid high background at long wavelengths (from interstellar cirrus emission), and to avoid a high density of foreground stars at the shorter wavelengths. We also avoided concentrating too much of the program near the ecliptic equator, where the zodiacal background is high and scheduling of observations is more constrained. However some important regions lie near the ecliptic equator (e.g., Virgo cluster, Leo groups), so some observations in this region were unavoidable.
Table 1 summarizes the range of properties in the SINGS sample, and Table 2 gives a complete listing of the galaxies and some of their relevant properties. Although our sample comprises representative cross section of galaxies found in the Local Supercluster, it does not include the absolute extremes in properties that can be found over larger local volumes. For example, we did not include any examples of ultraluminous infrared galaxies (ULIGs), luminous AGNs, cD galaxies, dwarf spheroidal galaxies, the most extreme metal-poor dwarf galaxies, or luminous low surface brightness galaxies. This was either because the objects would not be spatially resolved at the longest wavelengths measured by SIRTF (e.g., ULIGs), or because ample samples of such galaxies already are included as reserved observations in the Guaranteed Time Observers’ (GTO) Program. In order to maximize the science return on the SIRTF observing time we chose to avoid duplication, in favor of eventually integrating any needed GTO data into future analyses.

The deliberate emphasis on constructing a physically diverse sample also means that SINGS should not be regarded as a representative, randomly drawn sample of the local universe, in either a volume-limited or flux-limited sense. This point in illustrated in Figure 6, which compares the distribution of 60 µm luminosities of the SINGS galaxies with the local infrared luminosity function from Strauss & Huchra (1988). We deliberately constructed the SINGS sample to sample roughly equal logarithmic bins in luminosity, and this is reflected in the flat distribution in Figure 6. As a result the number of IR-faint galaxies (mostly dwarfs) is underrepresented relative to their actual space densities. Likewise the sample lacks any ultraluminous objects, as mentioned earlier. This selection should be borne in mind when interpreting results from the SINGS sample as a whole, and particularly when using the survey as a control sample for follow-up GO studies. Nevertheless the sample covers the range of galaxy types and star formation environments that are responsible for 95% of the total infrared emission in the local universe (Sanders & Mirabel 1996).
Although it was impractical to construct a fully volume-representative sample for SINGS, we decided to incorporate one complete luminosity-limited subsample into the survey, namely the M81 group (Tully 1987; Karachentsev et al. 2002). Our sample includes including M81, M82, NGC 2403, NGC 2976, NGC 4236, IC 2574, Ho I, Ho II, Ho IX, DDO 53, DDO 165, M81 DwA, and M81 DwB. Four other group members, NGC 2366, NGC 3077, UGC 4486, and VII Zw 403 are already in the reserved observation catalog, and those data eventually will be available to complete coverage of the group 111This sample does not include a small number of recently discovered extreme dwarf and tidal dwarf galaxies (Karachentsev et al. 2002; Makarova et al. 2002). The M81 group offers the advantages of proximity (d 3.5 Mpc), high visibility for SIRTF, and a diverse galaxy population, ranging from extreme dwarfs ( for M81 DwB) to a large spiral (M81) and the nearest example of an infrared-luminous starburst galaxy (M82).
3.2 Spectroscopic Sample
The spectroscopic sample is comprised of the nuclear regions of 74 of the 75 SINGS galaxies (the center of M82 is a reserved target, to be mapped by the IRS instrument team), and 75 extra-nuclear regions.222Previously reserved observations of the centers of several other SINGS galaxies were released by J.R. Houck and M.W. Werner to allow them to be incorporated into our project. We are indebted to these individuals and their teams for their cooperation and commitment to the overall scientific return from SIRTF. The extranuclear targets are divided between 40 optically-selected OB/HII regions and 35 infrared-selected regions, most of which will be chosen from the SINGS images themselves.
A similar physically-based approach has been used to define the extra-nuclear target sample. The optically-selected H II regions are located in nine of the nearest SINGS galaxies, and were chosen to span wide ranges in metal abundance (0.1 – 3 ), extinction-corrected ionizing luminosity (Q photons s-1), visual extinction (0–4 mag), radiation field intensity (100-fold range), ionizing stellar temperature ( = 35 – 55 kK), and local H2/H I ratio (0.1 to 10), as inferred from CO and 21 cm maps. We have restricted the optically-selected H II regions to those with extinction-corrected W m-2 (corresponding to W m-2), to ensure adequate detection of the main fine-structure lines in a reasonable exposure time. Table 3 lists the current candidate spectroscopic targets along with their relevant physical properties.
Optically-selected H II regions cover only part of the full population of bright star-forming regions and infrared sources, so it is important to independently select a subsample of extranuclear targets from infrared maps. We have used published ISOCAM mid-infrared maps to select some of the target regions listed in Table 3, and will select at least 30 additional targets from the SINGS images, on the basis of infrared luminosity, mid-infrared colors, and infrared-optical flux ratios. This will ensure a fully representative sampling of the SINGS extranuclear source population as a whole, including totally optically-obscurred objects that would never have been selected at other wavelengths. In addition a number of infrared-bright circumnuclear regions will be included in the SINGS observations of the centers of these galaxies.
4 SIRTF Observations
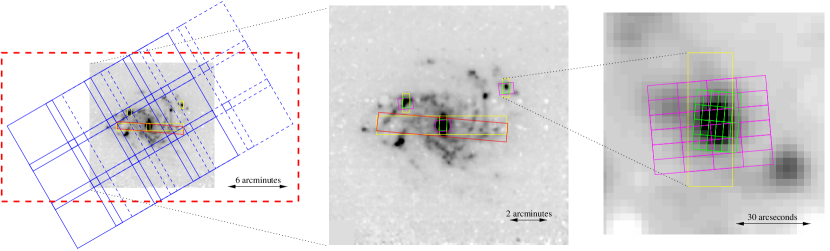
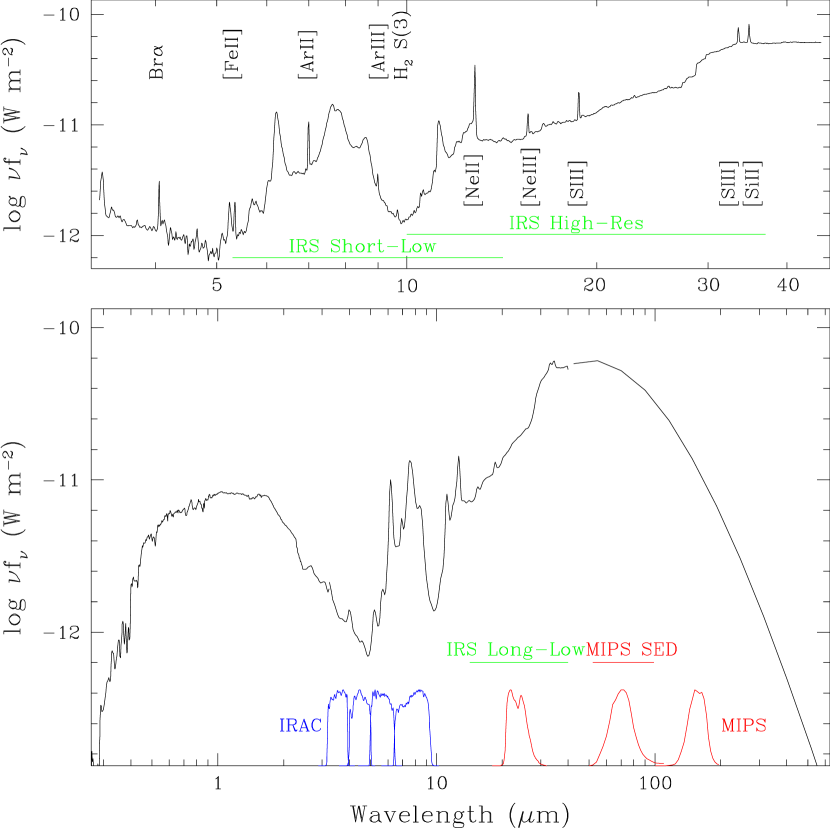
In keeping with the archival design of the SINGS observing program, we chose to maximize the homogeneity of the imaging and spectroscopic dataset across the 75 galaxy sample. Our basic observing strategy is depicted in Figure 7, which shows an ISOCAM image of a SINGS target, NGC 6946, on three scales with the footprints of the MIPS, IRAC, and IRS observations overlaid. For each galaxy full-coverage imaging (to ) will be obtained at all 7 IRAC and MIPS channels (3.6, 4.5, 5.8, 8.5, 24, 70, 160 µm), with sufficient additional sky coverage to allow for a robust background subtraction.
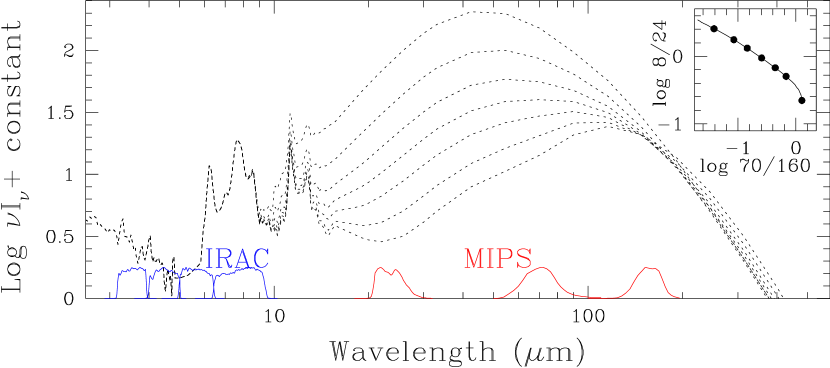
The coarse spectral sampling of the broadband MIPS and IRAC maps by themselves is insufficient to constrain the infrared SED shapes of galaxies, much less diagnose the temperature distributions and properties of the emitting grains, as illustrated in Figure 8. Therefore we are supplementing our imaging with IRS 14–40 m spectral maps and MIPS 52–99 m SED mode strip scans in all 75 galaxies. These will permit robust modeling of the dust continuum and heating over a several square arcminute slice of each galaxy, and with the images help constrain the spectral shapes throughout the disks. Additional spectral maps will be obtained at 5–14 µm and 10–37 µm (at high resolution) for the centers of every galaxy except M82, and for the 75 extra-nuclear regions described earlier.
The remainder of this section describes the SINGS observing strategy in detail. This information is provided in part for the benefit of prospective SIRTF proposers, who may find it useful for planning their own imaging or spectroscopic observations of nearby galaxies or other bright extended sources. A summary of the observations is given in Table 4; readers who are only interested in the data products may wish to skip the detailed discussion.
4.1 IRAC Imaging
A majority of our galaxies are larger than the 5′ format of the IRAC detectors, so we will construct mosaics from multiple pointings to provide the necessary field coverage. A generous overlap (50%) between adjacent exposures will provide robust cross-registration of the images, determination of bias drifts, and cosmic ray rejection. After one series of exposures we will have observed all locations in the central part of the mosaic four times. Because the four IRAC detectors map two non-overlapping fields of view, mosaics of the larger galaxies will include regions above and below which are only observed in two of the four channels. These regions are located well outside of the galaxies, and will be used to measure the sky background level.
The sensitivity of IRAC is sufficiently high to saturate the detectors in the inner regions and in bright spiral arms, where 7 µm surface brightnesses of up to hundreds of MJy sr-1 are expected (Dale et al. 1999). To address this problem we will observe the SINGS galaxies in a high dynamic range mode, in which an additional short exposure (1–2 s) is obtained. This will allow us to correct for any saturated pixels in the longer exposures.
We will image in all four IRAC bandpasses (3.6, 4.5, 5.8, 8.0 µm) to at least the full optical radii () of the galaxies. The four 256256 element detectors observe adjacent regions of the sky simultaneously, each covers a region of 5′ 5′ with 12 pixels. Galaxies with ′ will be observed in a pair of four-position dithered exposure sets. Dithered exposures will enable us to recover somewhat more spatial information in the reconstructed images, as described in § 6.1. In order to facilitate the detection and removal of asteroids (a significant contamimation for targets near the ecliptic), our observations will be carried out in two sets of exposures separated by 1–24 h.
A majority of our galaxies are larger than the 5′ format of the IRAC detectors, so we will construct mosaics from multiple pointings to provide the necessary field coverage. A generous overlap (50%) between adjacent exposures will provide robust cross-registration of the images, determination of bias drifts, and cosmic ray rejection. After one series of exposures we will have observed all locations in the central part of the mosaic four times. Because the four IRAC detectors map two non-overlapping fields of view, mosaics of the galaxies will include regions above and below which are only observed in two of the four channels. These regions are located well outside of the galaxies, and will be used to measure the sky background level. Like the smaller galaxies, each mosaiced galaxy will be observed twice to allow for the detection of asteroids. So there will be a total of eight exposures for all locations in the central part of the mosaic.
In keeping with the overall design strategy of the SINGS project we will obtain uniform exposure times (per detector field) across the galaxy sample, apart from small variations within individual mosaics depending on how many times a given region of sky is covered by a particular detector. The baseline integration time per pointing (30 s) was chosen as a compromise between providing acceptable signal/noise across the galaxies and keeping the total observing time to a practical level (45 h). For moderate zodiacal backgrounds (the dominant source at these wavelengths) we expect a limiting 1- sensitivity of 0.04 MJy sr-1, which is comparable to the expected average 7 µm surface brightness of a typical SINGS galaxy at R25 (Dale et al. 2000). The signal-to-noise ratio improves at smaller radii and shorter wavelengths. For example,we expect to get a signal-to-noise ratio per pixel of 5 for detecting stellar photospheres at R25. Since the zodiacal background varies by factors of several over the sky, the limiting sensitivities are expected to vary by about 40–50% across the sample. However these variations will be small in comparison to the intrinsic variations in infrared emission among the galaxies themselves.
The sensitivity of IRAC is sufficiently high to saturate the detectors in the inner regions and in bright spiral arms, where 7 µm surface brightnesses of up to hundreds of MJy sr-1 are expected (Dale et al. 1999). To address this problem we will observe the SINGS galaxies in a high dynamic range mode, in which an additional short exposure (1–2 s) is obtained. This will allow us to correct for any saturated pixels in the longer exposures.
4.2 MIPS Imaging
Each galaxy in the sample will be imaged in all 3 MIPS bands (24, 70, and 160 µm). We set as a goal a minimum S/N = 3 at R25 in all three bandpasses. To estimate the surface brightness levels required, we used the radial profiles of 11 nearby, face-on galaxies observed with the IRAS satellite, and processed with the HIRES algorithm to provide maximum spatial resolution (Auman, Fowler, & Melnick 1990; Kerton & Martin 2001). These profiles were then used to determine the 25 µm and 60 µm surface brightness at in each galaxy. This exercise yielded average values of 0.21 MJy sr-1 at 25 µm and 0.51 MJy sr-1 at 60 µm, in very good agreement with the mid-infrared estimates above, when extrapolated to longer wavelengths using typical galaxy SEDs (Dale et al. 2001). We adopted these values as the 3 sensitivity goals at 24 µm and 70 µm. Typical galaxy surface brightnesses at 160 µm are comparable to or greater than those at 60 µm (Engargiola 1991; Bendo et al. 2002a), so we also set a sensitivity goal of 0.51 MJy sr-1 at 160 µm. The 3 goals above are equivalent to point-source sensitivities of Jy, 1.9 mJy, and 6.1 mJy, respectively. As with the IRAC observations, variations in zodiacal background (at 24 µm) and interstellar background (at 70 and 160 µm) will affect the actual results, but even in the high background regions we expect to achieve these sensitivity targets within a factor of two.
Observations of galaxies at 70 µm and 160 µm impose special challenges for observations and data processing with MIPS, because of the extended low surface brightness structure in the sources, the difficulty of separating physical structures from transient features in the Ge:Ga detectors, and foreground structures such as interstellar cirrus in the Milky Way Galaxy. For that reason we describe the design of our observing and data analysis strategies in some detail, in hopes that it may aid future SIRTF users in designing their observing programs.
At the wavelengths covered by MIPS our observations will be confusion limited, and the sensitivity of the detectors is sufficient to detect most regions in exposure times of seconds. Consequently we have chosen to use short integration times (3–4 s), and multiple integrations on each region, to minimize saturation effects and ensure a high level of redundancy in the data. For expected average background levels (Young et al. 1998), the nominal sensitivities given above are achieved in 1 photometry cycle at 70 and 160 µm, and is within 10% of being achieved after 4 cycles at 24 µm. Multiple photometry cycles (2–3, depending on wavelength) will be obtained to ensure sufficient redundancy for removal of detector transients, meet the sensitivity goals, enable super-resolution capability (160 µm), and produce consistently high-quality images. As with the IRAC imaging the observations will be divided into two sets offset by 1.5 160 µm pixels, and separated by at least 3 h to detect asteroids.
The MIPS instrument enables imaging to be obtained either in a conventional “photometry” mode, or in a “scan map” mode, in which a scanning mirror allows for continuous integration over large areas of sky. We will use the small-field photometry modes for sources smaller than about D′, and large-field photometry modes for sources up to D′. Larger galaxies will be imaged using the MIPS scan map mode. To improve sampling and mitigate the effects of bad pixels at 160 µm each scan leg will be offset from the previous one by one-half the array width, using the cross-scan step in both the forward and reverse directions. This imaging strategy ensures that each point on the sky will be observed by at least 40 (4 at 160 µm) independent pixels. Due to the Ge:Ga transient behavior, we feel that 4 observations are the minimum required to generate high-quality data.
4.3 MIPS SED Observations
We will perform a small raster of SED mode observations (52–99 µm) in a radial strip in each galaxy, designed to overlap with the IRS low-resolution strip scans (below). In most galaxies (D′), this raster will consist of 7 positions, overlapped by half the slit width to cover in full a region. In galaxies larger than 10′, a second, similar set of SED observations will be added to produce a 1 map. Scheduling constraints are used to ensure that these strips be oriented as closely as possible to the IRS spectral maps, so we will cover the same regions in the galaxies at 14–40 µm and 52–99 µm. We used the radial profiles of nearby galaxies discussed above to estimate the typical surface brightnesses at R = 2–4 ′, and computed the integration times required. The fainter regions correspond to 1.2 MJy sr-1, which implies a sensitivity of 4.5 mJy on a point source to achieve sensitivity at that surface brightness. This is achieved in 4 cycles of 10 s integrations, so we will perform two cycles at each map position so that the half-slit-width overlaps provide the total integration time required.
4.4 IRS Spectroscopy
The IRS observations consist of: (1) low-resolution radial strip maps of all 75 galaxies in the long-low channel (14.2–40.0 m); (2) targeted spectroscopy of the centers of all 75 galaxies and 75 extranuclear sources in a subset of galaxies, at 5.3–14.2 m (low resolution), and 10.0–37.0 m (high resolution).
4.4.1 14–40 m IRS Radial Strip Spectroscopy
We will obtain 0.9-wide spectral maps for all galaxies from 14.2 to 40.0 m using the IRS low resolution mode, maximally overlapping the MIPS SED strip. These IRS strips will extend radially to about 0.55, where the average surface brightness is 1 MJy sr-1 (Dale et al. 2000). To minimize the effects of cosmic rays and bad pixels, we will spatially quadruple-sample by executing half-slit (length and width) steps parallel and perpendicular to the long-low slits. Since the IRS short-low subslits are about one arcmin long and are almost perpendicular to the long-low slits, we will complement the 1′-wide long-low strip maps with short-low maps (§ 4.4.2), to obtain complete wavelength coverage from 5.3 to 40.0 m in the nuclear regions. Again using the +ISO-based spectral model of Dale et al. (2001), we find that exposure times of 30 seconds give S/N for a 15 m surface brightness of 1 MJy sr-1, for the cirrus-like SEDs in the outer disks.
4.4.2 Targeted Low-Res Spectra (5–14 m)
Low-resolution spectral maps from 5.3–14.2 m, Nyquist-sampled over a 03 09 region, will be obtained for the centers of each galaxy and the 75 extranuclear regions. This region of the spectrum is especially valuable for measuring the aromatic dust emission bands from small grains (including PAH species). Since the galaxy centers will also be covered by the 14.2–40.0 m and 52–99 m SED strips, we will have nearly complete spectral coverage of these regions. Moreover, the 55″ sub-slit length will enable useful observations of extended sources, and the serendipitous regions simultaneously covered by the other sub-slit will provide data on the local background and quiescent disk regions. We will use exposures of 14 s for the nuclei and 60 s for extranuclear regions. Based on the range of observed mid-infrared surface brightnesses for the ISO Key Project galaxies ( MJy sr-1), we expect S/N 5 in the core of each target.
4.4.3 Targeted High-Resolution Spectra (10–37 m)
As for the low-resolution strip maps, we will map targeted regions with high spectral resolution, using a 5 3 grid pattern of half-slit length and half-slit width steps, as shown in the righthand panel in Figure 7. Most of our targets are spatially extended, with significant emission structure over scales comparable to the sizes of the IRS short-high aperture. As a result it would be very difficult to obtain accurate spectrophotometry across the entire wavelength range (10–37 µm) with a single pointing observation, because the size of the point-spread-function (PSF) varies by so much over this wide spectral range. Our spectral mapping strategy will provide: 1) adequate spatial coverage to obtain accurate line ratios over the same physical region in the sources; 2) S/N in the principal diagnostic lines (below); 3) flexible scheduling and roll angle.
High-resolution observations with the IRS spectrograph are covered in two echelle modes, a “short-high” mode at 10–19.5 µm and a “long-high” mode at 19.3–37 µm. Our short-high spectral maps will cover a total area of 157 236, while the long-high maps cover an area of 335 448. The larger area in the long-high observation is necessitated by the larger PSF at the longer wavelengths. Our basic unit of coverage for the nuclei and HII regions is well-matched to the area covered by the short-high slit. We expect to achieve 1 noise levels for unresolved emission lines of approximately W m-2 in the short-high and long-high data, except for the region beyond about 32 m which may be a factor of 2–4 noisier. Thus, emission lines at the W m-2 level, similar to what we expect for [NeII] and [SIII], should be detected at S/N 5–10 over the entire mapped area. Higher S/N is expected in the centers of the mapped regions, where we benefit from aperture oversampling.
4.5 Summary of SIRTF Observations
The total SINGS observing program is 512 hr, divided roughly equally between IRAC and MIPS imaging, IRS and MIPS low-resolution spectral mapping, and the targeted IRS spectroscopy (Table 4). It is important to bear in mind that all of the Legacy observing plans will be re-evaluated after the launch and commissioning phase of SIRTF, and are subject to revision should there be significant variances in the flight performance of one or more of the instruments. The SINGS observing strategy was deliberately designed to be robust against modest variances in instrumental performance, so unless the instrumental sensitivities or capabilities changes substantially, the program will still be carried out as described above.
For a subset of IR-faint sources, including most of the E–S0 galaxies and some of the dwarf irregular galaxies, we have deferred scheduling the spectroscopic observations until after the IRAC and MIPS imaging have been obtained, so we can confirm the detection of a minimum threshold infrared surface brightness to make spectroscopy feasible. Detailed information can be found on the SINGS website (URL: http://sings.stsci.edu).
5 Ancillary Observations and Complementary Data
The scientific value of the SIRTF data will be enhanced by a large set of ancillary multi-wavelength observations that are being obtained and assembled for the SINGS galaxies. Many of these data are being obtained by the SINGS team, and will be archived together with the SIRTF data products (§ 6). Our project also has stimulated other groups to undertake “complementary” surveys of the SINGS sample, and most of those data will be placed in publicly-accessible data archives after the surveys are completed. To date supporting data have been obtained on 20 telescopes, and when these surveys are completed they will comprise the most comprehensive multi-wavelength dataset ever assembled for a nearby galaxy sample.
Table 5 gives a compact summary of these ancillary and complementary datasets, including information on the field coverages, spatial resolutions, and approximate numbers of galaxies observed. A more detailed galaxy-by-galaxy listing of ancillary and complementary observations will be maintained on the SINGS website and updated on a regular basis. In the remainder of this section we briefly summarize each of these datasets.
5.1 and H Imaging
Broadband images in the visible and near-infrared provide an essential complement to the SIRTF data, providing information on the local stellar spectral energy distributions at shorter wavelengths, and constraints on the dust extinction, stellar mass distributions, and stellar populations heating the dust. Emission-line images in H provide a local measurement of the stellar ionizing flux and SFR (Kennicutt 1983), and when combined with the broadband data can constrain the ages and other properties of the star-forming regions.
Thanks to the generous allocation of observing time from NOAO, matched-field images in and H have been obtained for nearly all of the SINGS galaxies using the KPNO 2.1 m telescope with CFIM imager, and the CTIO 1.5 m telescope with Cassegrain CCD imager. These imagers provide field coverage of 104 and 8′ respectively, and for larger galaxies a series of positions were observed in order to provide full coverage to R R25. For a handful of galaxies H images are being obtained with the 2K CCD imager on the Steward Observatory Bok 2.3 m telescope. All data have been obtained during photometric conditions, or under thin clouds with separate calibration exposures obtained in photometric weather.
Two sets of near-infrared imaging () of the SINGS galaxies are being collected. A set of images will be extracted from the Two-Micron All Sky Survey (2MASS). These images will provide complete and relatively uniform quality near-infrared imaging for the entire sample, though the shallow depth of the data will limit applications for spatially-resolved studies (cf. Jarrett et al. 2003). Deeper imaging is being obtained using the OSIRIS imager on the CTIO 1.5mtelescope (southern galaxies), and on the Steward Observatory 1.5m(Bigelow) and 2.3m(Bok) telescopes, using either the 256256 infrared camera or the PISCES wide-field camera (McCarthy et al. 2001). These cameras provide fields of view of 25 – 38 and 85 respectively. Since the observing time required to obtain high signal/noise at R25 would be prohibitive at these wavelengths, we have chosen instead to obtain high-quality imaging of the central regions of the galaxies, where extinction is most problematic at shorter wavelengths. These images reach a typical depth of = 22 mag arcsec-2 or = 21 mag arcsec-2.
5.2 HST NICMOS Paschen- and H-Band Imaging
In order to provide more robust measurements of the extinction, massive star formation, and stellar mass distributions in the centers of the SINGS galaxies, we are obtaining P emission-line and -band imaging, using the NICMOS camera on HST. Data for appoximately 30 SINGS galaxies are being obtained through an ongoing HST Snapshot program (GO-9360). Since Snapshot targets are observed on an available opportunity basis, the exact number of galaxies to be observed (and their identity) is uncertain at this time. In addition, archival observations are available for 19 galaxies, and we will process these data and deliver them as SINGS data products. Appropriate redshifted Pa filters are only available for part of the SINGS sample, so coverage of the sample will be incomplete, but will include a wide enough range of properties to enable a wide range of scientific applications.
The images are being obtained with the NIC3 camera, which provides a field size of 55″ square. For typical exposure times and line/continuum ratios the Pa maps will reach a limiting surface brightness of ergs cm-2 s-1 arcsec-2 over an area of 06 06 (for ). The corresponding depth of the -band broad band images will be 19.7 mag arcsec-2.
The P recombination line luminosity is directly tied to the ionizing luminosity in the same way as H, but due to its longer wavelength (1.87 µm) it is much less susceptible to dust. In addition the P/H ratio provides a powerful extinction tracer in HII regions (e.g., Böker et al. 1999; Scoville et al. 2001; Quillen & Yukita 2001), and it will provide a valuable independent constraint on the dust extinction and heating models in the central regions of these galaxies.
5.3 Optical Spectrophotometry
As an aid to the interpretation of the SINGS 10–40 µm and 52–99 µm maps, our group is obtaining spectral drift-scans of the same regions in the 3600–7000 Å region, using Steward Observatory Bok 2.3 m telescope for the northern galaxies and the CTIO 1.5 m telescope for southern galaxies. These data are obtained by trailing the galaxy image back and forth across the slit during an integration, so an integrated spectrum of a large rectangular strip in the sky can be obtained, while preserving the spectral resolution of the narrow-slit observation. For each galaxy three one-dimensional integrated spectra are obtained. One spectrum covers the same area as the IRS and MIPS SED radial strips (§ 4.4), and a second is integrated over the central 20″ 20″ region, and is designed to provide matching spectrophotometry for the circumnuclear IRS spectra (§ 4.4). A third, narrow-slit pointed spectrum of the nucleus itself will also be provided.
The reduced, flux-calibrated spectra will have spectral resolution of 7–8 Å, and will provide information on the primary diagnostic nebular emission lines (H, H, [OII]3727, [OIII]4959,5007, [NII]6548,6583, [SII]6717,6731), in some cases fainter lines such as [OIII]4363, and information on the shape and principle absorption lines in the stellar spectra. Note that since the spectra are taken in a drift-scanned mode there is no point-by-point spatial information. Optical spectra for most of the extra-nuclear HII regions in the SINGS sample (Table 3) are published in the literature, so new observations are not required.
5.4 H Kinematics
A group from the Universite de Montreal and the Laboratoire d ’Astrophysique de Marseille is obtaining H kinematics for the SINGS sample. The observations will help to delineate the role of gas kinematics in regulating the SFR, and will provide a fundamental local reference sample for 3D kinematics studies of high-redshift galaxies. All the data are being obtained with a new GaAs Photon Counting System (Gach et al. 2002). The observations are obtained on the CFHT 3.6 m, ESO La Silla 3.6 m, Observatoire de Haute Provence (OHP) 1.93 m, and Observatoire de Mont Megantic (OMM) 1.6 m telescopes, with fields of view of 3 to 12′.
These data will complement the lower-resolution gas kinematic data being provided by the HI and CO surveys (below), by providing high spatial resolution data for the inner parts of galaxies. These are crucial for constraining the dark matter density profiles of galaxies (e.g., Blais-Ouellette et al. 1999). Such a database will also make it possible to study how the parameters of the dark matter distribution vary as a function of morphological type, and test for influences on the star formation properties and histories of the galaxies.
5.5 UV Imaging and Spectrophotometry
Imaging and spectra of the SINGS galaxies in the ultraviolet (1300–2800 Å) provide an especially powerful complement to infrared data, because this wavelength region directly traces the photospheric emission of the dominant star-forming and dust-heating population in most galaxies. The recently launched Galaxy Evolution Explorer Mission (GALEX) is designed to perform an all-sky survey in two bands over 1350–3000 Å, with angular resolution of 5″ (Milliard et al. 2001). This is well matched to the resolution of SIRTF, and will be adequate to quantify the integrated UV emission from the entire sample. Since the approval of the SINGS project the GALEX team also has tentatively planned much deeper imaging of each SINGS galaxy (1 h each at 1350–1800 Å and 1800–3000 Å). These deeper images will enable point-by-point mapping of the SEDs and SFRs in the galaxies. All of these data will be released into the GALEX public archive after a nominal proprietary period, and the images of the SINGS galaxies will be linked to our archive shortly thereafter.
Images in this wavelength region (1500–2800 Å) are also available for 27 of the galaxies from the Ultraviolet Imaging Telescope (UIT) and/or HST, and IUE spectra of the central 10″ 20″ regions are available for 25 galaxies. These data will be integrated into the SINGS database and included in the data archive as well.
5.6 CO, HI, and Radio Continuum Maps
Maps of CO and HI emission are important for tracing the cold, gaseous ISM, and aperture synthesis maps enable a comparison with SIRTF data at the highest resolution possible. In addition, measures of radio continuum emission ( = 20 cm) provide an alternate tracer of star formation as well as a means to examine the correlation of far-infrared and non-thermal radio continuum emission (e.g., Condon 1992; Marsh & Helou 1995; Sullivan et al. 2001).
For a core set of 20 spiral galaxies both CO and HI aperture synthesis observations have been acquired as part of the BIMA Survey of Nearby Galaxies (BIMA SONG), and we will include the reduced maps in the SINGS data products (Regan et al. 2001; Helfer et al. 2003). The typical half-power beamwidth (HPBW) for these maps is 6 ″, and single-dish total-power measurements have been incorporated into the reductions to preserve extended emission. Further BIMA observations are planned for other northern SINGS galaxies as motivated by our SIRTF observations. Published single-dish CO measurements from a variety of sources are available for 36 of the SINGS galaxies (see Table 2). In addition the Five College Radio Astronomy Observatory (M. Heyer, PI) is performing an On-The-Fly mapping survey of a broader subset of SINGS galaxies. Observations are being obtained using the FCRAO 14 m telescope with the SEQUOUA focal plane array (16 pixels for extra-galactic observations). Typical maps consist of 55 to 88 pointings, with a target sensitivity is 5 milliKelvin in 5 MHz wide channels, chosen to match the sensitivity of the 12 m telescope observations from BIMA SONG.
We are assembling a database of 30–45 ″resolution HI maps for northern SINGS galaxies. These data come from the dedicated Westerbork (WSRT) HI survey, WHISP (Swaters et al. 2002; Swaters & Balcells 2002), as well as new and archival VLA observations. In addition the nearest SINGS galaxies (d 10 Mpc) are being observed in HI at high spatial and spectral resolution mapping as part of a VLA Large Proposal (F. Walter, PI). This will provide data for 35 galaxies of the SINGS sample at high spatial resolutions of 7″ and velocity resolution 2.5–5 km s-1. These data will be used to investigate the small scale structure of the atomic ISM and to obtain spatially resolved velocity dispersion maps for each galaxy. The field of view of all HI observations is 30′, and nicely encompasses even the largest galaxies of the SINGS sample.
We are also assembling a database of 30–45 ″ resolution maps of the 20-cm radio continuum emission from SINGS galaxies. These data come from the VLA archives, as well as new observations of 40 SINGS galaxies, and seek to achieve an rms noise level half that of the NRAO VLA Sky Survey (0.2–0.3 mJy beam-1; Condon et al. 1998) at equal or higher resolution. In a parallel effort a group led by Robert Braun (NFRA) is using the Westerbork Synthesis Radiotelescope (WSRT) to obtain deep 20 cm radio continuum and coarse-resolution HI line maps for 30 large (D′) northern SINGS galaxies (see Table 4). These maps will have a resolution of approximately 12″ 12″/. The continuum data will include separate or combined 18 cm and 22 cm images reaching a limit of 15 Jy beam-1 in each band (including spectral index, polarization, and rotation measure maps).
5.7 Submillimeter and ISO Observations
As can be seen from Figures 1 and 8, the thermal dust emission of galaxies usually extends to wavelengths well beyond 160 m, the longest wavelength for SIRTF instruments. This emission can represent a significant fraction of the total dust luminosity, and is critical for constraining the temperatures and masses of the cold dust component in the ISM (e.g., Siebenmorgen, Krügel, & Chini 1999; Bendo et al. 2003).
To properly trace continuum dust emission from the far-infrared into the submillimeter, we have acquired data from the James Clerck Maxwell Telescope (JCMT) archives maintained by the Canadian Astronomy Data Centre333http://cadcwww.hia.nrc.ca/. At the time of this writing, the archive contain Submillimetre Common-User Bolometer Array (Holland et al. 1999) data for 24 SINGS galaxies. Only 17 galaxies are detected in at least the 850 µm waveband, although many of these galaxies are also detected at 450 µm. For some galaxies, the data include stare photometry and jiggle maps of the inner 2.3′, whereas for other galaxies, the data include composite jiggle maps and scan maps that may extend beyond 10′ apertures. The data are being processed using the SURF data reduction package (Jenness & Lightfoot 1998) following standard data reduction procudures. Additional submillimeter observations are planned to acquire data for at least the brightest infrared sources in the sample.
Data for 46 of the 75 SINGS galaxies are available from the Infrared Space Observatory (Kessler et al. 1996) archives444http://www.iso.vilspa.esa.es/ida/index.html. These data come from all four of the ISO instruments, which we may use to supplement our existing data and check our flux calibration. The ISOCAM (Cesarsky et al. 1996) and ISOPHOT (Lemke et al. 1996) broad band data may be useful for adding photometry to the observed spectral energy distributions of the SINGS galaxies, for checking the calibration of IRS and MIPS data, and extending the SED coverage redward to 240 m. ISOSWS (de Graauw et al. 1996) data provides spectra with higher spectral resolution than IRS that can be used to closely examine the wavelength profiles of emission line features. Finally, ISOLWS (Clegg et al. 1996) spectral data, which spans wavelengths longer than what IRS can observe, can provide additional diagnostic spectral lines for modeling star formation and the interstellar medium.
5.8 X-Ray Maps
By the end of 2003, 35 galaxies (about 50%) of the SINGS sample will have been observed with the Chandra X–ray observatory (with integration times ranging from 2 to 70 ksec). We anticipate that more SINGS targets will be added to the list in the years to come. As part of SINGS, processed X–ray maps for these galaxies will be made available in various energy bands (both photon and adaptively smoothed images). Chandra’s arcsecond resolution will be essential for a detailed comparison of the X–ray data with observations obtained at other wavelengths and for isolating point sources from the underlaying diffuse hot gas. These X-ray point sources (such as X–ray binaries and supernova remnants) provide important clues to the heating mechanisms of the ambient medium. In complementary fashion, the multi–wavelength SINGS data will be important to constrain the nature of the Chandra point sources. The Chandra data will also allow us to derive physical properties (such as tempertature, density, pressure) of the hot phase of the ISM which will be visible as diffuse, soft X–ray emission. The SINGS team is also collaborating on proposals to enlarge the subset of galaxies with high-quality Chandra maps.
6 SINGS Data Processing, Data Products, and Website
As with all Legacy programs, the SIRTF observations are completely non-proprietary. This means that the pipeline-calibrated data, including calibrated single-pointing images (and rudimentary mosaic images) and individual spectra will be available to the public immediately. These data will enable a wide range of scientific investigations in their own right, and provide invaluable samples of flight data for planning of future GO observing programs.
A primary scientific output of the SINGS project will be added-value data products, including high-fidelity image mosaics, enhanced-resolution dithered images, spatially co-aligned multi-band images, one-dimensional spectral extractions, and full 3D spectroscopic data cubes. A typical image or spectroscopic observation of a SINGS galaxy is built from 15–815 individual SIRTF datasets, so these data products will be the primary source of science-grade data for many users. We also will deliver user versions of tools for extracting source spectral energy distributions from multi-wavelength sets of images and for building and analyzing spectral data cubes from sets of multiple IRS pointings.
6.1 IRAC and MIPS Data Products
We will produce and deliver two sets of IRAC data products: 1) image mosaics in native IRAC resolution; 2) enhanced mosaics. The first set of images will possess the native resolution of the instrument, which is limited by the pixel size of the IRAC detectors (12). Since this pixel size undersamples the telescope’s point spread function at all wavelengths, we plan to construct a second set of mosaic images that are processed using the drizzle technique (Fruchter & Hook 2002) to reconstruct the point spread function, and thus provide higher spatial resolution images.
The processing and production of the mosaic images will also include a number of other checks and enhancements to the basic calibrated data. Cross-correlation of the individual pointings will be used to derive spatial offsets between subexposures, and check the pointing reconstruction given in the image headers. We will also check for and if needed remove other instrumental signatures such as detector bias level drifts, residual cosmic rays, and residual hot pixels. Asteroids will be detected by combining the time-separated exposures that are being designed for this purpose.
The MIPS data products will include 24, 70, and 160 µm mosaicked images and a SED strip spectral cube for each of the 75 SINGS galaxies. The initial processing will proceed in similar fashion to IRAC, with a combination of manual checks on data quality followed by a carefully supervised processing of individual observations to create mosaicked images. The MIPS image data products will be delivered in two versions. The first version will encompass the entire area observed at each wavelength. Due to the placement of the three focal plane arrays and their different sizes, this will result in different fields-of-view at each wavelength for both photometry and scan mode observations. The second version will have images which are background-subtracted (constant value), share a common field-of-view, and have been regridded to a common pixel scale.
The MIPS SED data will be processed in the same way, before being combined with the Cubism package (§ 6.3.2) to create spectral data cubes from individual mosaicked SED pointings. The resulting data products will be delivered in two versions as well. The first will consist of two spectral cubes, one for the object (without background removal) and one for the nearby background observations. The second version will be a single spectral cube with the nearby background observations subtracted from the object observations.
A program for automated mosaicking of MIPS images (named mips_enhancer) is being developed by the MIPS Instrument Team in collaboration with the SINGS team. The goal is to use the redundancy inherent in the MIPS observational strategy to remove residual instrumental signatures in the 70 and 160 µm data. The program will be continually improved as knowledge of the detector instrumental signatures increases, and a final delivery of mosaicked images and spectra that incorporate our accumulated knowledge to date will be made at the end of the project.
6.2 IRS Data Products and Tools
The SINGS IRS data products consist of three separate types for each mapped region: 1) full, 3D spectral data cubes; 2) selected line and continuum spectral maps; and 3) representative one-dimensional extracted spectra. Tools for creating and visualizing the spectral cubes will also be available, and these are described below (§6.3.2).
6.2.1 IRS Spectral Mapping Cubes
The fundamental data product generated from the IRS spectral mapping observations is a spectral cube, created by combining spatially overlapping data from different slit pointings into a three dimensional data cube with coordinate axes . The other IRS data products are derived directly from the spectral cube. A single spectral cube will be created for each IRS sub-slit (6 in total) used in all nuclear, extra-nuclear and radial strip observations.
The cubes are constructed using a flux-conservative algorithm somewhat related to drizzle (Fruchter & Hook 2002), but operating in three dimensions on collections of 2D spectral images. Spatial and spectral smoothing, and other error-correlating operations are avoided by mapping pixels from the raw spectra directly to the spectral cube. Individual single-wavelength spatial samples, consisting of tilted “pseudo-rectangles” approximately as long as the slit, and with widths equal to the wavelength sampling interval, are tiled on the detector, and clipped against its pixel grid. The resulting partial pixels are rotated to match the “sky grid” of the final cube, both to remove any intrinsic instrumental spectral line tilt, and to reference all observations to a common position angle of the slit on the sky. Samples collected from different spectral orders which overlap in wavelength, and from adjacent spectrograms within the mapping observation set are combined together in the resultant cube.
The entire set of rotated partial pixels is clipped again against the output sky grid, which is constructed with an adjustable pixel spacing defaulting to the native plate scale of the IRS module in use (none of the IRS modules is significantly undersampled). The clipped area for each pixel portion is retained, and in this way an area-conserving mapping of spectrogram pixels to cube pixels is built up, and used to construct the final cube. Area/error weighting is the default method for combining the contributing pixels, but trimmed weighted means are also possible.
6.2.2 IRS Spectral Maps and 1D Spectra
Spectral maps in [Ne II] (12.8 m, =22 eV), [Ne III] (15.5 m, =41 eV), and [Si II] (34.8 m, =8 eV) line features will be produced from all the SINGS nuclei and targeted HII region cubes. These maps will be generated from the spectral cubes based on simple fits to the underlying continuum. The continuum-subtracted maps, along with the derived continuum maps used in the subtraction will be included.
In addition to the Ne and Si atomic line maps, we will produce maps in the combined [7.7 m + 8.6 m], and 11.3 m PAH features for all the SINGS nuclei and targeted HII regions. Since these broad dust features dominate the spectrum of star-forming galaxies at these wavelengths, we will not perform continuum subtraction. Instead, we will extract a set of line-free continuum maps that will provide information on the underlying continuum, as well as providing additional information on the galaxy SED at wavelengths that fall between the IRAC and MIPS filters (14–40 µm).
By selecting spatial regions in the maps or cubes we can create 1D spectral extractions for a given IRS sub-slit. We will produce 1D spectra for all SINGS nuclei and mapped HII regions. These “source” spectra will be extracted from a suitable region (matched to the PSF), centered on the map peak at either 12 or 25 m, depending upon the IRS module used to create the map. The surrounding areas in the map will be used to create a local “background” 1D spectrum, which will suitably scaled and subtracted from the source spectrum. Both the background-subtracted source spectrum and the background spectrum itself will be included in the data products.
6.3 User Software Tools
Most of the SINGS data products will be in the form of image mosaics and extracted spectra which can be readily analyzed by the generic SIRTF data analysis programs or by standard image analysis packages such as IRAF or IDL. However our team is developing two software packages that will be specifically tailored to analysis of the SINGS data. One of these tools (SEDTIAP) will enable the batch-mode generation of PSF-matched SEDs from a set of individual multi-wavelength images. The Cubism tool will generate 3D spectral data cubes from IRS mapping observations, and provide a variety of user software for analyzing the spectral data cubes.
6.3.1 SED Tool and Image Analysis Program
The SEDTIAP program is an IDL-based tool that rotates, rescales, interpolates/convolves the input image data to a common astrometric coordinate system and resolution, using the user-selected PSF from a set of available choices and assuming bi-linear interpolation with flux conservation to resample the images. The co-aligned images are displayed for the user to check alignment and a data-cube containing the processed images is saved to disk. Apertures for both sources and background are specified interactively by the user, and the total and background-subtracted fluxes for all the images in the data-cube are saved in a file (the SED file).
6.3.2 Cubism
Spectral cubes are constructed from the IRS spectral mapping data sets using a custom software package, Cubism. The cubes themselves and the algorithms used to create them are discussed in § 6.2.1. Cubism is written in IDL, and consists of four main components: i) the cube-builder backend (see § 6.2.1); ii) CubeProject, a graphical tool for organizing and querying cube inputs and driving the cube creation; iii) CubeView, a visualizer for both 2D spectrograms and spectral cubes, facilitating 1D extractions; iv) CubeSpec, for visualizing 1D extracted cube spectra, and generating stacked maps.
CubeProject provides the interface from which all cube-building operations are performed. It encapsulates individual data records into “projects”, each of which includes all the calibration information and data required to build a single cube for one IRS sub-slit. Individual data records can be added, removed, disabled, queried for header information, and sorted in a variety of ways. Visual feedback of the pixel clipping process is provided, and the individual spectrograms or the final cube can be sent to CubeView for display.
CubeView permits both individual spectral data records and the full cube to be displayed and analyzed. A suite of traditional viewer tools (zooming, colormap and histogram scaling, box statistics, photometry, etc.) is available. In addition, various specialized tools are available for reporting wavelength and order (for spectrograms) or celestial position (for spectral cubes) within the image, selecting and setting the apertures which delineate the order data to be included in the cube build, navigating through wavelength planes, and extracting spectra from selected regions. In the latter case, the extracted 1D spectrum is displayed in a related tool, CubeSpec, which can be used to visit individual planes of the cube and to create line or feature maps. Arbitrary peak and continuum wavelength regions can be defined on the spectrum, and the resultant maps are displayed in CubeView, where they can be saved or exported. Stored region sets for important lines and features in the wavelength range are available, including 8 and 24 m sets corresponding to the appropriate IRAC and MIPS bandpasses, to enable easy cross-calibration between instruments. The continuum can also be fit and removed using the defined background regions.
6.4 Ancillary and Complementary Data Products

As discussed in § 5, the scientific value of the SIRTF data will be enhanced substantially by the addition of images and spectra of the galaxies at other wavelengths. Some of these data (e.g., visible and near-infrared imaging, visible spectra) are being obtained by the SINGS team and will be delivered to the NASA/IPAC Infrared Space Archive (IRSA) as formal ancillary data products. They will be fully reduced and will include headers with full world coordinate system (WCS) information, flux calibration information, and when relevant comments on the photometric and/or astrometric accuracy of the images. Data from other sources that are re-reduced by our team (e.g., submillimeter, X-ray images) will also carry comments or documentation on the reduction procedures and any qualifications on the data quality. Complementary data from other groups (Table 5) will be posted either in the SINGS archive or on independent websites, according to the wishes of the groups involved. Information and links to these sites will be provided on the main SINGS website (below).
6.5 Data Archive and The SINGS Website
All public access to SINGS data will be made through the SIRTF Legacy archive at IRSA.555 URL: http://irsa.ipac.caltech.edu Data releases and access will be administered by the SIRTF Science Center, and prospective users should follow announcements from SSC to obtain more updated information. In addition the SINGS team maintains its own public website.666 URL: http://sings.stsci.edu The site contains detailed information on the project and galaxy sample, and will be regularly updated to provide information on observations and data products.
Scheduling of the SIRTF observations and the subsequent data releases is subject to the launch date, and scheduling of the various GTO, Legacy, and GO observations thereafter. However the graph in Figure 9 provides an approximate projection of the expected data flow, as a function of month after launch. We expect approximately 5 galaxies per month to be observed on average, beginning approximately 3–4 months after the launch of SIRTF. The first of these data will be released to the public with the opening of the SIRTF archive, approximately 8 months after launch, and after that time the basic calibrated data and other pipeline observations will be posted in the archive shortly after the observations are taken (as indicated by the leftmost dashed line in Figure 9. A small fraction of the spectroscopic observations (galaxies with questionable detections, IR-selected extranuclear targets) will not be scheduled until IRAC and MIPS images for those galaxies are in hand, and this is indicated by the turnover in the dashed line at the top of the figure.
In order to expedite the release of science-grade products to the user community we have defined two levels of product for each instrument, as summarized in Table 6. The “rapid release” products consist of processed and mosaicked images for IRAC and MIPS, and 1D spectral extractions and line maps for IRS. Each product will incorporate full checking and validation of the pipeline data by members of the SINGS team, calibration and astrometric checks and refinements, combination of individual observations into mosaic images or spectral maps, and corrections for instrumental signatures on a best-effort basis, using the knowledge we have acquired at the time.
Approximately 12 months later the SINGS team will deliver a second generation set of “enhanced” data products (Table 5). These will include improved resolution dithered IRAC mosaic images, MIPS images which take into account our accumulated experience with removing detector transient features, full spectral data cubes and the associated Cubism and Cubeview tools, and if necessary improved calibrations for all relevant data products. Our current projection for these deliveries is shown by the rightmost dot-dashed line in Figure 8. In order to maximize the scientific value of the SIRTF data products for a given galaxy, releases will include the relevant ancillary and complementary data for that galaxy (as available), to provide a coherent multi-wavelength dataset. It is anticipated that all of the data described in this paper will be in the public archive by the end of the project (approximately 3 years after the SIRTF launch).
References
- (1) Alonso-Herrero, A., Engelbracht, C.W., Rieke, M.J., Rieke, G., Quillen, A.C. 2001, ApJ, 546, 952
- (2) Alton, P.B. et al. 1998, A&A, 335, 807
- (3) Aumann, H.H., Fowler, J.W., & Melnick, M. 1990, AJ, 99, 1674
- (4) Barger, A.J., Cowie, L.L., & Richards, E.A. 2000, AJ, 119, 2092
- (5) Bell, E.F., & Kennicutt, R.C. 2001, ApJ, 548, 681
- (6) Bell, E.F., Gordon, K.D, Kennicutt, R.C., & Zaritsky, D. 2002, ApJ, 565, 994
- (7) Bendo, G.J. et al. 2002a, AJ, 123, 3067
- (8) Bendo, G.J. et al. 2002b, AJ, 124, 1380
- (9) Bendo, G.J. et al. 2003, AJ, 125, 2361
- (10) Blais-Ouellette, S., Carignan, C., Amram, P., & Cote, S. 1999 AJ, 118, 2123
- (11) Böker, T. et al. 1999, ApJS, 124, 95
- (12) Boselli, A. et al. 1998, A&A, 335, 5366
- (13) Buat, V., & Xu, C. 1996, A&A, 306, 61
- (14) Buat, V., Donas, J., Milliard, B., & Xu, C. 1999, A&A, 352, 371
- (15) Buat, V., Boselli, A., Gavazzi, G., & Bonfanti, C. 2002, A&A, 383, 801
- (16) Burstein, D. 1994, Nature, 372, 38
- (17) Calzetti, D., Kinney, A.L., & Storchi-Bergmann, T. 1994, ApJ, 429, 582
- (18) Calzetti, D. 2001, PASP, 113, 1449
- (19) Cesarsky, C.J. 1996, A&A 315, L32
- (20) Cesarsky, D., Lequeux, J., Abergel, A., Perault, M., Palazzi, E., Madden, S., & Tran, D. 1996, A&A, 315, L309
- (21) Clegg, P.E. et al. 1996, A&A 315, L38
- (22) Condon, J.J. 1992, ARA&A, 30, 575
- (23) Condon, J.J., Cotton, W.D., Greisen, E.W., Yin, Q.F., Perley, R.A., Taylor, G.B., & Broderick, J.J. 1998, AJ, 115, 1693
- (24) Dale, D.A. et al. 1999, AJ, 118, 2055
- (25) Dale, D.A. et al. 2000, AJ, 120, 583
- Dale et al. (2001) Dale, D. A., Helou, G., Contursi, A., Silbermann, N. A., & Kolhatkar, S. 2001, ApJ, 549, 215
- (27) Dale, D.A., & Helou, G. 2002, ApJ, 576, 159
- (28) de Graauw, T. et al 1996, A&A, 315, L49
- (29) de Vaucouleurs, G., de Vaucouleurs, A., Corwin, H.G., Buta, R.J., Paturel, G., & Fouque, P. 1991, Third Reference Catalog of Bright Galaxies (RC3), Austin: University of Texas Press
- (30) Devereux, N.A., & Young, J.S. 1990, ApJ, 371, 515
- (31) Dopita, M.A., Pereira, M., Kewley, L.J., & Capaccioli, M. 2002, ApJS, 143, 47
- (32) Draine, B.T., & Li, A. 2001, ApJ, 551, 807
- Engargiola (1991) Engargiola, G. 1991, ApJS, 76, 875
- Fruchter & Hook (2002) Fruchter, A. S. & Hook, R. N. 2002, PASP, 114,144
- (35) Fullmer, L., & Lonsdale, C.J. 1989, Cataloged Galaxies and Quasars Observed in the IRAS Survey, JPL Document D-1932, Version 2, part 3
- (36) Gach, J.-L. et al. 2002, PASP, 114, 1043
- (37) Gallagher, D.B., Irace, W.R., & Werner, M.W. 2002, Proc. SPIE, 4850-04
- (38) Giavalisco, M. 2002, ARA&A, 40, 579
- (39) Giovanelli, R. et al. 1994, AJ, 107, 2036
- (40) Goldader, J.D., Meurer, G., Heckman, T.M., Seibert, M., Sanders, D.B., Calzetti, D., & Steidel, C.C. 2002, ApJ, 568, 651
- (41) Gordon, K.D., Misselt, K.A., Witt, A.N., & Clayton, G.C. 2001, ApJ, 551, 269
- (42) Helfer, T.T. et al. 2003, ApJS, in press
- (43) Helou, G. 1986, ApJ, 311, L33
- (44) Helou, G. et al. 1996, A&A, 315, L157
- (45) Helou, G. 2000, in Infrared Space Astronomy, Today and Tomorrow, ed. F. Casoli, J. Lequeux, & F. David, Paris: Springer-Verlag, p337
- (46) Helou, G., Lu, N.Y., Werner, M.W., Malhotra, S., & Silbermann, N. 2000, ApJ, 532, L21
- (47) Helou, G., Malhotra, S., Hollenbach, D.J., Dale, D.A. & Contursi, A. 2001, ApJ, 548, L73
- (48) Holland, W. S., et al 1999, MNRAS, 303, 659
- (49) Hollenbach, D.J., & Tielens, A.G.G.M. 1999, Rev Mod Phys, 71, 173
- (50) Hunter, D.A. et al. 2001, ApJ, 553, 121
- (51) Jarrett, T.H, Chester, T.T., Cutri, R., Schneider, S., & Huchra, J. 2003, AJ, 125, 525
- (52) Jenness, T., & Lightfoot, J. F. 1998, in Albrecht, R., Hook, R. N., Bushouse, H. A. eds, ASP Conf. Ser. Vol. 145, Astronomical Data Analysis Software and Systems VII. Astron. Soc. Pac., San Francisco, p. 216
- (53) Karachentsev, I.D. et al. 2002, A&A, 383, 125
- (54) Kennicutt, R.C. 1983, ApJ, 272, 54
- (55) Kennicutt, R.C. 1998a, ARA&A, 36, 189
- (56) Kennicutt, R.C. 1998b, ApJ, 498, 541
- (57) Kerton, A.S., & Martin, P.G. 2001, PASP, 785, 872
- (58) Kessler, M.F. et al. 1996, A&A 315, L27
- (59) Kewley, L.J., Geller, M.J., Jansen, R.A., & Dopita, M.A. 2002, AJ, 124, 3135
- (60) Lemke, D. et al 1996, A&A 315, L64
- (61) Li, A., & Draine, B.T. 2001, ApJ, 554, 778
- (62) Li, A., & Draine, B.T. 2002, ApJ, 576, 762
- (63) Lonsdale, C.J., & Helou, G. 1987, ApJ, 314, 513
- (64) Lu, N.Y. et al. 2003, ApJ, submitted
- (65) Lutz, D. 2000, New Astron Rev., 44, 241
- (66) Makarova, L.N. et al. 2002, A&A, 396, 473
- (67) Malhotra, S. et al. 1997, ApJ, 491, L27
- (68) Malhotra, S. et al. 2001, ApJ, 561, 766
- (69) Marsh, K.A., & Helou, G. 1995, ApJ, 445, 599
- (70) McCarthy, D.W., Ge, J., Hinz, J.L., Finn, R.A., & de Jong, R.S. 2001, PASP, 113, 353
- (71) Milliard, B. et al 2001, in Mining the Sky, eds A.J. Banday, S. Zaroubi, & M. Bartelmann (Heidelberg: Springer-Verlag), p201
- (72) Misselt, K.A., Gordon, K.D., Clayton, G.C., & Wolf, M.J. 2001, ApJ, 551, 277
- (73) Moorwood, A.F.M., Lutz, D., Oliva, E., Marconi, A., Netzer, H., Genzel, R., Sturm, E., & de Graauw, T. 1996, A&A, 315, L109
- (74) Nelson, A.E., Zaritsky, D., & Cutri, R.M. 1998, AJ, 115, 2273
- (75) Popescu, C.C., Misiriotis, A., Kylafis, N.D., Tuffs, R.J., & Fischera, J. 2000, A&A, 362, 138
- (76) Popescu, C.C., Tuffs, R.J., Völk, H.J., Pierini, D., & Madore, B.F. 2002, ApJ, 567, 221
- (77) Popescu, C.C., & Tuffs, R.J. 2002, MNRAS, 335, L41
- (78) Quillen, A.C., & Yukita, M. 2001, AJ, 121, 2095
- (79) Regan, M.W., Thornley, M.D., Helfer, T.T., Sheth, K., Wong, T., Vogel, S.N., Blitz, L., & Bock, D.C-J. 2001, ApJ, 561, 218
- (80) Rieke, G.H., Loken, K., Rieke, M.J., & Tamblyn, P. 1993, ApJ, 412, 99
- (81) Roche, P., Aitken, D., Smith ,C., & Ward, M. 1991, MNRAS, 248, 606
- (82) Roussel, H. et al. 2001a, A&A, 369, 473
- (83) Roussel, H., Sauvage, M., Vigroux, L., & Bosma, A. 2001b, A&A, 372, 427
- (84) Rowan-Robinson, M., & Crawford, J. 1989, MNRAS, 238, 523
- (85) Sanders, D.B., & Mirabel, I.R. 1996, ARA&A, 34, 749
- (86) Savage, M., & Thuan, T.X. 1992, ApJ, 396, L69
- (87) Schreiber, N.M. Förster, Genzel, R., Lutz, D., Kunze, D., & Sternberg, A. 2003, ApJ, submitted (astro-ph/0101153)
- (88) Scoville, N.Z., Polletta, M., Ewald, S., Stolovy, S. R., Thompson, R., & Rieke, M. 2001, AJ, 122, 3017
- (89) Siebenmorgen, R., Krügel, E., & Chini, R. 1999, A&A, 351, 495
- (90) Soifer, B.T., Neugebauer, G., & Houck, J.R. 1987, ARA&A, 25, 187
- (91) Stickel, M., Bregman, J.N., Fabian, A.C., White, D.A., & Elmegreen, D.M. 2003, A&A, 397, 503
- (92) Strauss, M.A., & Huchra, J. 1988, AJ, 95, 1602
- (93) Sturm, E., Lutz, D., Tran, D., Feuchtgruber, H., Genzel, R., Kunze, D., Moorwood, A.F.M., & Thornley, M.D. 2000, A&A, 358, 481
- (94) Sullivan, M., Treyer, M.A., Ellis, R.S., Bridges, T.J., Milliard, B., & Donas, J. 2000, MNRAS, 313, 442
- (95) Sullivan, M., Mobasher, B., Chan, B., Cram, L., Ellis, R., Treyer, M., & Hopkins, A. 2001, ApJ, 558, 72
- (96) Swaters, R.A., van Albada, T.S., van der Hulst, J.M., & Sancisi, R. 2002, A&A, 390, 829
- (97) Swaters, R.A., & Balcells, M. 2002, A&A, 390, 863
- (98) Thornley, M.D. et al. 2000, ApJ, 539, 641
- (99) Trewhella, M., Davies, J.I., Alton, P.B., Bianci, S., & Madore, B.F. 2000, ApJ, 543, 153
- (100) Tuffs, R.J. et al. 2002, ApJS, 139, 37
- (101) Tully, R.B. 1987, ApJ, 321, 280
- (102) Tully, R.B. 1988, Nearby Galaxies Catalog (Cambridge: CUP)
- (103) Valentijn, E.A. 1994, MNRAS, 266, 614
- (104) Walterbos, R.A.M., & Greenawalt, B. 1996, ApJ, 460, 696
- (105) Wang, B., & Heckman, T.M. 1996, ApJ, 457, 645
- (106) Young, E.T. et al. 1998, Proc. SPIE, 3354, 57
| Property | Range |
|---|---|
| Hubble Type | E — Irr |
| 12.5 — 23.5 | |
| LV | — L⊙ (0.0003–10 L∗) |
| L(IR) | 107 — L⊙ |
| L(IR)/LR | 0.02 — 42 |
| F(60)/F(100) | 0.16 — 1.2 |
| O/H (0.4 ) | 0.05 — 3 (O/H)⊙ |
| Mgas/Mstars | 0.001 — 5 |
| SFR | 0 — 15 M⊙/yr |
| SFR/ | 10-8 — 10-4 M⊙/yr/ |
| Region | RA | Dec | Radius | A(V) | L(H) | f(Br) | |
|---|---|---|---|---|---|---|---|
| J2000 | J2000 | kpc | mag | ergs s-1 | W m-2 | ||
| (1) | (2) | (3) | (4) | (5) | (6) | (7) | (8) |
| NGC 628 H 292 | 01:36:45.10 | 15:47:51 | 4.0 | 9.1 | 2.0 | 40.4 | 45 |
| NGC 628 H 572 | 01:36:37.50 | 15:45:12 | 6.8 | 9.0 | 0.9 | 39.5 | 6 |
| NGC 628 H 627 | 01:36:38.80 | 15:44:25 | 8.9 | 8.8 | 0.9 | 40.2 | 30 |
| NGC 628 H 13 | 01:36:35.50 | 15:50:11 | 11.7 | 8.6 | 1.5 | 40.1 | 20 |
| NGC 2403 HK 361 | 07:36:46.55 | 65:36:54 | 1.0 | 8.8 | 0.4 | 39.5 | 60 |
| NGC 2403 HK 270 | 07:36:53.50 | 65:36:40 | 1.1 | 8.7 | 0.3 | 39.4 | 45 |
| NGC 2403 HK 128 | 07:37:08.19 | 65:36:33 | 2.8 | 8.6 | 0.8 | 39.9 | 150 |
| NGC 2403 HK 65 | 07:37:19.48 | 65:33:57 | 3.5 | 8.6 | 1.8 | 39.6 | 70 |
| NGC 2403 HK 542 | 07:36:21.05 | 65:36:55 | 3.7 | 8.6 | 0.5 | 39.6 | 80 |
| NGC 2403 VS 9 | 07:36:29.94 | 65:33:43 | 6.2 | 8.1 | 39.0 | 20 | |
| Ho II HSK 45 | 08:19:13.30 | 70:43:08 | 8.5 | 39.1 | 22 | ||
| Ho II HSK 67 | 08:19:27.00 | 70:41:59 | 8.6 | 38.5 | 5 | ||
| Ho II HSK 70 | 08:19:28.80 | 70:42:21 | 38.6 | 8 | |||
| Ho II HSK 7 | 08:18:50.10 | 70:44:48 | 38.5 | 6 | |||
| M81 HK 230 | 09:56:00.44 | 69:04:02 | 4.1 | 9.2 | 0.4 | 38.7 | 10 |
| M81 HK 343 | 09:55:40.67 | 68:59:45 | 4.7 | 8.9 | 0.0 | 38.6 | 8 |
| M81 HK 453 | 09:55:24.43 | 69:08:15 | 4.8 | 8.9 | 1.0 | 39.0 | 20 |
| M81 HK 268 | 09:55:53.17 | 68:59:04 | 5.1 | 8.8 | 0.7 | 39.3 | 40 |
| M81 HK 652 | 09:54:56.63 | 69:08:47 | 5.6 | 8.8 | 0.7 | 39.0 | 20 |
| M81 HK 741 | 09:54:42.26 | 69:03:36 | 7.7 | 8.7 | 0.5 | 39.1 | 25 |
| M81 Munch 1 | 09:56:17.42 | 68:49:50 | 15.0 | 8.1 | 0.2 | 38.0 | 23 |
| NGC 4559 ZKH 20 | 12:35:56.50 | 27:57:40 | 1.4 | 8.9 | 1.1 | 39.5 | 8 |
| NGC 4559 ZKH 18 | 12:36:00.80 | 27:56:22 | 4.1 | 8.8 | 0.7 | 39.9 | 18 |
| NGC 4559 ZKH 17 | 12:36:02.40 | 27:56:45 | 4.7 | 8.8 | 1.1 | 39.7 | 10 |
| NGC 4559 ZKH 4 | 12:35:52.10 | 27:59:10 | 12.3 | 8.6 | 0.4 | 39.3 | 5 |
| NGC 4736 HK 52 | 12:50:49.64 | 41:07:23 | 0.9 | 9.1 | 0.5 | 39.0 | 10 |
| NGC 4736 HK 53 | 12:50:49.64 | 41:07:34 | 1.0 | 9.0 | 1.0 | 39.0 | 10 |
| NGC 4736 HK 8/9 | 12:50:56.27 | 41:07:20 | 1.0 | 9.0 | 0.5 | 39.3 | 20 |
| M51 CCM 107 | 13:29:53.10 | 47:12:40 | 2.5 | 9.4 | 1.7 | 39.9 | 35 |
| M51 CCM 72 | 13:29:44.10 | 47:10:21 | 5.0 | 9.3 | 1.9 | 40.3 | 70 |
| M51 CCM 71 | 13:29:44.60 | 47:09:55 | 5.3 | 9.3 | 0.9 | 39.8 | 23 |
| M51 CCM 1 | 13:29:56.20 | 47:14:07 | 5.8 | 9.2 | 2.6 | 40.1 | 50 |
| M51 CCM 10 | 13:29:59.60 | 47:14:01 | 6.4 | 9.2 | 2.2 | 39.8 | 23 |
| M51 CM 71A | 13:29:39.50 | 47:08:35 | 9.5 | 9.1 | 2.7 | 40.2 | 59 |
| NGC 6822 Hub V | 19:44:52.85 | 14:43:11 | 8.1 | 38.3 | 33 | ||
| NGC 6822 Hub X | 19:45:05.24 | 14:43:13 | 8.1 | 38.2 | 75 | ||
| NGC 6822 Hub I | 19:44:31.64 | 14:42:01 | 8.1 | 37.9 | 120 | ||
| NGC 6822 Hub III | 19:44:34.05 | 14:42:22 | 8.1 | 37.5 | 10 | ||
| NGC 6946 H 4 | 20:35:16.68 | 60:10:57 | 6.0 | 9.1 | 2.2 | 39.8 | 40 |
| NGC 6946 HK 3 | 20:35:25.12 | 60:10:03 | 9.0 | 1.5 | 40.0 | 75 | |
| NGC 6946 HK 288 | 20:34:52.29 | 60:12:41 | 9.0 | 1.5: | 39.7 | 35 | |
| NGC 6946 H 40 | 20:34:19.48 | 60:10:09 | 7.7 | 8.9 | 1.2 | 39.5 | 20 |
| NGC 6946 H 28 | 20:34:39.03 | 60:13:35 | 8.6 | 8.9 | 1.2 | 39.5 | 20 |
| Galaxy | RA | Dec | Type | Nuc | Vr | Dist | Mopt | W20 | SFR | Group | |||||
|---|---|---|---|---|---|---|---|---|---|---|---|---|---|---|---|
| J2000 | J2000 | km/s | Mpc | arcmin | mag | km/s | M⊙ | M⊙ | M⊙/yr | ||||||
| (1) | (2) | (3) | (4) | (5) | (6) | (7) | (8) | (9) | (10) | (11) | (12) | (13) | (14) | (15) | (16) |
| NGC 0024 | 00:09:56.7 | -24:57:44 | SAc | 554 | 8.2 | 5.81.3 | 18.4 | 222. | 0.20 | 0.35 | 9.07 | 19 -8 +7 | |||
| NGC 0337 | 00:59:50.3 | -07:34:44 | SBd | 1650 | 24.7 | 2.91.8 | 20.3 | 264. | 1.20 | 0.49 | 4.3 | 61 -23 +21 | |||
| NGC 0584 | 01:31:20.7 | -06:52:05 | E4 | 1854 | 27.6 | 4.22.3 | 22.2 | 52 -7 | |||||||
| NGC 0628 | 01:36:41.8 | +15:47:00 | SAc | 657 | 11.4 | 10.59.5 | 20.9 | 74. | 0.72 | 0.31 | 10.11 | 9.49 | 4.0 | 17 -4 | |
| NGC 0855 | 02:14:03.6 | +27:52:38 | E | 610 | 9.6 | 2.61.0 | 17.7 | 0.23 | 0.48 | ||||||
| NGC 0925 | 02:27:16.9 | +33:34:45 | SABd | H | 553 | 10.1 | 10.55.9 | 20.6 | 224. | 0.18 | 0.29 | 9.79 | 9.03 | 2.4 | 17 -1 |
| NGC 1097 | 02:46:19.0 | -30:16:30 | SBb | L | 1275 | 16.9 | 9.36.3 | 22.4 | 402. | 0.75 | 0.40 | 10.03 | 4-8: | 51 -3 +1 | |
| NGC 1266 | 03:16:00.7 | -02:25:38 | SB0 | L | 2194 | 31.3 | 1.51.0 | 21.1 | 5.49 | 0.76 | |||||
| NGC 1291 | 03:17:18.6 | -41:06:29 | SBa | 839 | 9.7 | 9.88.1 | 22.0 | 84. | 0.02 | 0.17 | 9.19 | 0.4 | 53 -9 +7 | ||
| NGC 1316 | 03:22:41.7 | -37:12:30 | SAB0 | L | 1760 | 26.3 | 12.08.5 | 23.5 | 0.04 | 0.41 | 8.87 | 51 -1 | |||
| NGC 1377 | 03:36:39.1 | -20:54:08 | S0 | H | 1792 | 24.4 | 1.80.9 | 19.6 | 2.04 | 1.23 | |||||
| NGC 1404 | 03:38:51.9 | -35:35:37 | E1 | 1947 | 25.1 | 3.33.0 | 22.9 | 51 -1 | |||||||
| NGC 1482 | 03:54:39.3 | -20:30:09 | SA0 | 1655 | 22.0 | 2.51.4 | 20.5 | 4.65 | 0.77 | 8.88 | 9.47 | 1.5 | 51 -4 | ||
| NGC 1512 | 04:03:54.3 | -43:20:56 | SBab | SB | 896 | 10.4 | 8.95.6 | 19.9 | 271. | 0.24 | 0.29 | 9.77 | 53 -7 | ||
| NGC 1566 | 04:20:00.4 | -54:56:16 | SABbc | Sy | 1496 | 18.0 | 8.36.6 | 21.9 | 233. | 0.49 | 0.32 | 10.03 | 53 -1 | ||
| NGC 1705 | 04:54:13.5 | -53:21:40 | Am | SB | 628 | 5.8 | 1.91.4 | 16.7 | 0.29 | 0.48 | 0.03 | 53 +1 | |||
| NGC 2403 | 07:36:51.4 | +65:36:09 | SABcd | H | 131 | 3.5 | 21.912.3 | 19.7 | 257. | 0.29 | 0.35 | 9.73 | 7.86 | 1.3 | 14 -10 |
| Ho II | 08:19:05.0 | +70:43:12 | Im | 157 | 3.5 | 7.96.3 | 17.1 | 73. | 0.06 | 0.44 | 0.12 | 14 -10 | |||
| M81 DwA | 08:23:56.0 | +71:01:45 | I? | 113 | 3.5 | 1.30.7 | 38. | 7.06 | 6.33 | 0.001 | 14 -10 | ||||
| DDO 053 | 08:34:07.2 | +66:10:54 | Im | 19 | 3.5 | 1.51.3 | 13.6 | 0.48 | 0.29 | 0.005 | 14 -10 | ||||
| NGC 2798 | 09:17:22.9 | +41:59:59 | SBa | SB | 1726 | 24.7 | 2.61.0 | 19.6 | 316. | 4.71 | 0.70 | 9.29 | 9.47 | 2.0 | 21 -16 |
| NGC 2841 | 09:22:02.6 | +50:58:35 | SAb | L/Sy | 638 | 9.8 | 8.13.5 | 20.7 | 611. | 0.11 | 0.18 | 9.53 | 9.30 | 0.2 | 15 +10 |
| NGC 2915 | 09:26:11.5 | -76:37:35 | I0 | SB | 468 | 2.7 | 1.91.0 | 15.1 | 157. | 0.31 | 1.17 | 8.25 | 0.04 | 14 +20 | |
| Ho I | 09:40:32.3 | +71:10:56 | IABm | 143 | 3.5 | 3.63.0 | 13.2 | 44. | 8.15 | 0.004 | 14 -10 | ||||
| NGC 2976 | 09:47:15.4 | +67:54:59 | SAc | H | 3 | 3.5 | 5.92.7 | 17.6 | 0.49 | 0.37 | 8.26 | 7.91 | 0.2 | 14 -10 | |
| NGC 3049 | 09:54:49.6 | +09:16:18 | SBab | SB | 1494 | 19.6 | 2.21.4 | 18.7 | 213. | 0.64 | 0.67 | 9.10 | |||
| NGC 3031 | 09:55:33.2 | +69:03:55 | SAab | L | 34 | 3.5 | 26.914.1 | 21.2 | 446. | 0.08 | 0.26 | 8.88 | 1.1 | 14 -10 | |
| NGC 3034 | 09:55:52.2 | +69:40:47 | IO | SB | 203 | 3.5 | 11.24.3 | 17.9 | 42.35 | 0.97 | 8.85 | 9.39 | 6.0: | 14 -10 | |
| Ho IX | 09:57:32.0 | +69:02:45 | Im | 46 | 3.5 | 2.52.0 | 13.6 | 7.55 | 0.001 | ||||||
| M81 DwB | 10:05:30.6 | +70:21:52 | Im | 350 | 3.5 | 0.90.6 | 12.5 | 69. | 7.08 | 0.004 | 14 -10 | ||||
| NGC 3190 | 10:18:05.6 | +21:49:55 | SAap | L | 1271 | 17.4 | 4.41.5 | 20.7 | 601. | 0.30 | 0.32 | 8.65 | 0.1 | 21 -6 | |
| NGC 3184 | 10:18:17.0 | +41:25:28 | SABcd | H | 592 | 8.6 | 7.46.9 | 19.0 | 142. | 0.99 | 0.31 | 9.32 | 8.96 | 1.2 | 15 +7 |
| NGC 3198 | 10:19:54.9 | +45:32:59 | SBc | 663 | 9.8 | 8.53.3 | 20.2 | 318. | 0.19 | 0.40 | 9.74 | 0.85 | 15 +7 | ||
| IC 2574 | 10:28:21.2 | +68:24:43 | SABm | 57 | 3.5 | 13.25.4 | 17.7 | 123. | 0.11 | 0.23 | 9.21 | 0.10 | 14 -10 | ||
| NGC 3265 | 10:31:06.8 | +28:47:47 | E | 1421 | 20.0 | 1.31.0 | 17.7 | 1.30 | 0.65 | 8.24 | |||||
| Mrk 33 | 10:32:31.9 | +54:24:03 | Im | SB | 1461 | 21.7 | 1.00.9 | 18.4 | 181. | 2.29 | 0.88 | 8.77 | 1.5 | 13 +1 | |
| NGC 3351 | 10:43:57.7 | +11:42:13 | SBb | SB | 778 | 9.3 | 7.45.0 | 20.4 | 288. | 0.54 | 0.51 | 9.10 | 8.82 | 1.2 | 15 -1 |
| NGC 3521 | 11:05:48.6 | -00:02:09 | SABbc | L | 805 | 9.0 | 11.05.1 | 21.0 | 466. | 0.81 | 0.38 | 9.67 | 9.64 | 1.7 | 15 -0 +1 |
| NGC 3621 | 11:18:16.3 | -32:48:45 | Sad | 727 | 6.2 | 12.37.1 | 19.4 | 290. | 1.10 | 0.33 | 9.88 | 5.1 | 15 -0 | ||
| NGC 3627 | 11:20:15.0 | +12:59:30 | SABb | Sy2 | 727 | 8.9 | 9.14.2 | 20.8 | 378. | 1.21 | 0.47 | 8.92 | 9.61 | 6.9 | 15 -2 +1 |
| NGC 3773 | 11:38:13.0 | +12:06:43 | SA0 | 987 | 12.9 | 1.21.0 | 17.5 | 191. | 0.40 | 0.82 | 7.99 | 21 -4 +1 | |||
| NGC 3938 | 11:52:49.4 | +44:07:15 | SAc | 809 | 12.2 | 5.44.9 | 20.1 | 112. | 0.46 | 0.33 | 9.57 | 9.46 | 1.2 | 12 -1 | |
| NGC 4125 | 12:08:06.0 | +65:10:27 | E6p | 1356 | 21.4 | 5.83.2 | 21.6 | 0.03 | 0.39 | 12 +5 -1 | |||||
| NGC 4236 | 12:16:42.1 | +69:27:45 | SBdm | 0 | 3.5 | 21.97.2 | 18.1 | 176. | 0.09 | 0.40 | 9.23 | 8.14 | 0.3 | 14 +10 | |
| NGC 4254 | 12:18:49.6 | +14:24:59 | SAc | 2407 | 20.0 | 5.44.7 | 21.6 | 272. | 1.02 | 0.37 | 9.86 | 10.12 | 11.0 | 11 -1 | |
| NGC 4321 | 12:22:54.9 | +15:49:21 | SABbc | L | 1571 | 20.0 | 7.46.3 | 22.1 | 283. | 0.73 | 0.37 | 9.67 | 10.17 | 5.5 | 11 -1 |
| Galaxy | RA | Dec | Type | Nuc | Vr | Dist | Mopt | W20 | SFR | Group | |||||
|---|---|---|---|---|---|---|---|---|---|---|---|---|---|---|---|
| J2000 | J2000 | km/s | Mpc | arcmin | mag | km/s | M⊙ | M⊙ | M⊙/yr | ||||||
| (1) | (2) | (3) | (4) | (5) | (6) | (7) | (8) | (9) | (10) | (11) | (12) | (13) | (14) | (15) | (16) |
| NGC 4450 | 12:28:29.6 | +17:05:06 | SAab | L | 1954 | 20.0 | 5.23.9 | 21.4 | 290. | 0.07 | 0.19 | 8.61 | 9.30 | 0.5 | 11 -1 |
| NGC 4536 | 12:34:27.1 | +02:11:16 | SABbc | H | 1808 | 25.0 | 7.63.2 | 20.8 | 337. | 2.33 | 0.64 | 9.71 | 9.71 | 3.7 | 11 -4 +1 |
| NGC 4552 | 12:35:39.9 | +12:33:22 | E0 | L | 340 | 20.0 | 5.14.7 | 20.8 | 11 -1 | ||||||
| NGC 4559 | 12:35:57.7 | +27:57:35 | SABcd | H | 816 | 11.6 | 10.74.4 | 21.0 | 251. | 0.17 | 0.41 | 10.05 | 14 -1 | ||
| NGC 4569 | 12:36:49.8 | +13:09:46 | SABab | L/Sy | 235 | 20.0 | 9.54.4 | 22.0 | 360. | 0.22 | 0.37 | 8.80 | 9.82 | 1.9 | 11 -1 |
| NGC 4579 | 12:37:43.6 | +11:49:05 | SABb | L/Sy | 1519 | 20.0 | 5.94.7 | 21.8 | 390. | 0.17 | 0.28 | 8.91 | 9.60 | 2.0 | 11 -1 |
| NGC 4594 | 12:39:59.4 | -11:37:23 | SAa | L/Sy2 | 1091 | 13.7 | 8.73.5 | 21.5 | 762. | 0.16 | 0.19 | 8.77 | 9.36 | 0.1 | 11 -14 +10 |
| NGC 4625 | 12:41:52.7 | +41:16:25 | SABmp | 609 | 9.5 | 2.21.9 | 17.5 | 86. | 0.37 | 0.34 | 9.02 | 14 -4 | |||
| NGC 4631 | 12:42:08.0 | +32:32:26 | SBd | 606 | 9.0 | 15.52.7 | 20.6 | 320. | 1.26 | 0.40 | 10.09 | 9.19 | 3.3 | 14 -6 | |
| NGC 4725 | 12:50:26.6 | +25:30:03 | SABab | Sy2 | 1206 | 17.1 | 10.77.6 | 22.0 | 410. | 0.09 | 0.20 | 9.87 | 9.80 | 14 -2 +1 | |
| NGC 4736 | 12:50:53.0 | +41:07:14 | SAab | L | 308 | 5.3 | 11.29.1 | 19.9 | 241. | 0.87 | 0.57 | 8.94 | 8.90 | 2.1 | 14 -7 |
| DDO 154 | 12:54:05.2 | +27:08:59 | IBm | 376 | 5.4 | 3.02.2 | 15.1 | 103. | 8.99 | 0.0015 | 14 +3 | ||||
| NGC 4826 | 12:56:43.7 | +21:40:52 | SAab | Sy2 | 408 | 5.6 | 10.05.4 | 20.3 | 311. | 0.27 | 0.48 | 8.49 | 8.87 | 0.3 | 14 +3 |
| DDO 165 | 13:06:24.8 | +67:42:25 | Im | 37 | 3.5 | 3.51.9 | 15.3 | 68. | 8.02 | 0.002 | 14 +10 | ||||
| NGC 5033 | 13:13:27.5 | +36:35:38 | SAc | Sy2 | 875 | 13.3 | 10.75.0 | 20.9 | 446. | 0.48 | 0.34 | 9.97 | 9.50 | 2.1 | 43 -1 |
| NGC 5055 | 13:15:49.3 | +42:01:45 | SAbc | H/L | 504 | 8.2 | 12.67.2 | 19.0 | 405. | 4.56 | 0.25 | 9.88 | 9.62 | 2.3 | 14 -5 |
| NGC 5194 | 13:29:52.7 | +47:11:43 | SABbc | H/Sy2 | 463 | 8.2 | 11.26.9 | 21.4 | 195. | 0.60 | 0.35 | 9.60 | 9.83 | 5.4 | 14 -5 |
| NGC 5195 | 13:29:58.7 | +47:16:05 | SB0p | L | 552 | 8.2 | 5.84.6 | 20.0 | 0.29 | 0.53 | 8.25 | 0.1 | 14 -5 | ||
| NGC 5398 | 14:01:21.3 | -33:03:47 | SBdm | H | 1216 | 15.0 | 2.81.7 | 18.9 | 137. | 0.44 | 0.58 | 9.11 | 16 -5 | ||
| NGC 5408 | 14:03:20.9 | -41:22:40 | IBm | 509 | 4.5 | 1.60.8 | 16.1 | 114. | 0.74 | 0.89 | 8.45 | 0.18 | 14 -15 | ||
| NGC 5474 | 14:05:01.6 | +53:39:44 | SAcd | H | 273 | 6.9 | 4.84.3 | 18.4 | 61. | 0.11 | 0.28 | 9.10 | 0.2 | 14 -9 | |
| NGC 5713 | 14:40:11.5 | -00:17:21 | SABbcp | 1883 | 26.6 | 2.82.5 | 20.9 | 209. | 1.71 | 0.57 | 9.93 | 9.72 | 41 -2 +1 | ||
| NGC 5866 | 15:06:29.5 | +55:45:48 | S0 | 692 | 12.5 | 4.71.9 | 19.9 | 0.51 | 0.29 | 8.28 | 8.63 | 0.1 | 44 -1 | ||
| IC 4710 | 18:28:38.0 | -66:58:56 | SBm | SB | 741 | 8.5 | 3.62.8 | 18.3 | 51. | 0.20 | 0.38 | 8.69 | 1.3 | 19 -1 | |
| NGC 6822 | 19:44:56.6 | -14:47:21 | IBm | 57 | 0.6 | 15.513.5 | 13.8 | 81. | 2.50 | 0.50 | 8.26 | 0.024 | 14 -12 | ||
| NGC 6946 | 20:34:52.3 | +60:09:14 | SABcd | H | 48 | 5.5 | 11.59.8 | 21.3 | 242. | 0.39 | 0.40 | 9.79 | 9.61 | 2.2 | 14 -0 |
| NGC 7331 | 22:37:04.1 | +34:24:56 | SAb | L | 816 | 15.7 | 10.53.7 | 21.8 | 530. | 1.02 | 0.30 | 10.01 | 10.05 | 4.2 | 65 -1 |
| NGC 7552 | 23:16:11.0 | -42:34:59 | SAc | SB/L | 1585 | 22.3 | 3.42.7 | 21.7 | 280. | 3.20 | 0.71 | 9.68 | 7.0 | 61 -16 | |
| NGC 7793 | 23:57:49.8 | -32:35:28 | SAd | H | 230 | 3.2 | 9.36.3 | 18.2 | 194. | 0.57 | 0.35 | 8.81 | 0.3 | 14 -13 |
Note. — Col (1): ID; Col (2): The right ascension in the J2000.0 epoch; Col (3): The declination in the J2000.0 epoch; Col (4): RC3 Type; Col (5): Nuclear Type: H=HII-region, SB=Starburst, L=LINER, Sy=Seyfert(1, 2); Col (6): Heliocentric velocity; Col (7): Flow-corrected distance in Mpc, for H0 = 70 km s-1 Mpc-1 Col (8): Major and minor axis diameters; Col (9): Absolute magnitude, when available; otherwise from the or bands; Col (10): 21 cm neutral hydrogen line width at 20% of maximum intensity, in km s-1, as given in Tully (1988) or RC3; Col (11): FIR/optical luminosity ratio. The FIR luminosity is derived from the IRAS-measured 60–100 m fluxes, from Fullmer & Lonsdale (1989), the optical luminosity is defined as: ; Col (12): The ratio of the IRAS 60 m to 100 um flux; Col (13): The logarithmic atomic gas mass, from H I integrated fluxes; Col (14): The logarithmic molecular gas mass, from CO integrated fluxes; Col (15): Star formation rates derived from H emission, with typical = 1 mag; Col (16): Group affiliation code from Tully (1988). Important codes include 11 -1 (the Virgo Cluster) and 14 -10 (the M 81 Group).
| Instrument | Wavelength | Bandwidth | Aereal Coverage | Resolution | Sensitivityaa3- surface brightness limit for average background target, based on pre-flight instrument performance estimates. Variations in local background can alter these values up to factor of 2. |
|---|---|---|---|---|---|
| m | m | arcmin | arcsec | MJy/sr | |
| IRAC | 3.6 | 0.75 | D25bbFull coverage of galaxy to at least RC3 D25 or 5′ 5′, whichever is greater | 1.7 | 0.02 |
| 4.5 | 1.02 | D25bbFull coverage of galaxy to at least RC3 D25 or 5′ 5′, whichever is greater | 1.7 | 0.03 | |
| 5.8 | 1.44 | D25bbFull coverage of galaxy to at least RC3 D25 or 5′ 5′, whichever is greater | 1.7 | 0.09 | |
| 8.0 | 2.91 | D25bbFull coverage of galaxy to at least RC3 D25 or 5′ 5′, whichever is greater | 2.0 | 0.12 | |
| MIPS | 24 | 4.7 | D25bbFull coverage of galaxy to at least RC3 D25 or 5′ 5′, whichever is greater | 5.7 | 0.2 |
| 70 | 19. | D25bbFull coverage of galaxy to at least RC3 D25 or 5′ 5′, whichever is greater | 17. | 0.5 | |
| 160 | 35. | D25bbFull coverage of galaxy to at least RC3 D25 or 5′ 5′, whichever is greater | 38. | 0.5 |
| Instrument/Mode | Wavelengths | Resolution | Aereal Coverage | Sensitivityaa3- sensitivities based on pre-flight estimates, see other footnotes for remarks on individual observing modes. |
|---|---|---|---|---|
| m | arcmin | 3- | ||
| MIPS SED | 55 96 | 15 | 1.0 0.55 D25bbApproximate radial coverage, see §4.3 for details. Minimum strip length is 4′. | 1.2 MJy/sreeContinuum surface brightness sensitivity |
| IRS SED | 14 40 | 62 124 | 0.9 0.55 D25bbApproximate radial coverage, see §4.3 for details. Minimum strip length is 4′. | 0.6 MJy/srffContinuum surface brightness sensitivity at 15 µm |
| IRS Nuclear | 5.3 14.2 | 62 124 | 0.3 0.9 | 3 mJyggPoint source continuum flux sensitivity |
| 10.0 37.0 | 600 | 0.3 0.4ddSpatial coverage given for 10.0 19.5 m channel. Maps at 19.3 37.0 m are 055 075, to account for degraded spatial resolution at the longer wavelengths. | 5 10-18 W/m2hhPoint source sensitivity limit for unresolved emission line | |
| IRS Extra-nuclear | 5.3 14.2 | 62 124 | 0.3 0.9 | 3 mJyggPoint source continuum flux sensitivity |
| 10.0 37.0 | 600 | 0.3 0.4ddSpatial coverage given for 10.0 19.5 m channel. Maps at 19.3 37.0 m are 055 075, to account for degraded spatial resolution at the longer wavelengths. | 5 10-18 W/m2hhPoint source sensitivity limit for unresolved emission line |
| Instrument | Rapid Release Products | Enhanced Release Products |
|---|---|---|
| IRAC | Mosaic Images | Full-Resolution Dithered Images |
| MIPS Image | Full-Map Images | MIPS Enhancer Images |
| MIPS SED | 1D Spectra | MIPS Enhancer Spectral Cubes |
| IRS | 1D Spectra, Line Maps | 3D Spectral Cubes |
| Type | Wavelength | Coverage | Resolution | GalaxiesaaApproximate number of galaxies for which data will be available when projects are completed. | TypebbType of dataset: Arch = archival data (in some cases reprocessed by the SINGS team; SINGS = ancillary data being obtained by members of the SINGS team; Comp = complementary data being obtained by independent groups, but with plans to archive when projects are completed. | FacilitiesccApproximate radial coverage, see § 4.4.1 for details. Minimum strip length is 25. |
|---|---|---|---|---|---|---|
| arcmin | arcsec | |||||
| (1) | (2) | (3) | (4) | (5) | (6) | (7) |
| High-Res HI Maps | 21 cm | 30 | 7 | 35 | Comp | VLA |
| Low-Res HI Maps | 21 cm | 30 | 30 45 | 70 | Arch, SINGS | VLA, WHISP, ATCA |
| HI Maps (WSRT) | 21 cm | 30 | 12 12/ | 30 | Comp | WSRT |
| Radio Continuum Maps (WSRT) | 18 cm, 22 cm | 30 | 12 / | 30 | Comp | WSRT |
| Radio Continuum Maps (VLA) | 20 cm | 30 | 30 45 | 60 | SINGS | VLA |
| Radio Continuum Maps (ATCA) | 20 cm | 10 10/ | 7 | SINGS | ATCA | |
| High-Res CO Maps | 1.3 mm | 1.7 3.2 | 7 | 20 | Arch | BIMA SONG |
| Low-Res CO Maps | 1.3 mm | 3 5 | 50 | 40 | Comp | FCRAO |
| Submillimeter Maps | 850, 450 µm | 2.3 10 | 7.5 14 | 20 | Arch, Comp | JCMT (SCUBA) |
| FIR Photometry | 170 240 µm | 90 | 30 | Arch | ISO (PHT) | |
| Imaging (2MASS) | 1.2, 1.6, 2.2 µm | 2 3 | 75 | Arch | 2MASS | |
| Imaging (Deep) | 1.2, 1.6, 2.2 µm | 2.5 8.5 | 1 2 | 75 | SINGS | Steward, CTIO, Palomar |
| Paschen , Imaging | 1.88, 1.6 µm | 0.8 | 0.2 | 50 | SINGS | HST (NICMOS) |
| H Imaging | 0.656 µm | 1 3 | 75 | SINGS | KPNO, CTIO, Steward | |
| H Imaging/Kinematics | 0.656 µm | 4 20 | 1 3 | 30 | Comp | CFHT, ESO, OHP, OMM |
| Imaging | 0.44, 0.55, 0.64, 0.81 µm | 1 2 | 75 | SINGS | KPNO, CTIO | |
| UV Imaging | 0.15, 0.25 µm | 3 | 27 | Arch | UIT | |
| UV Imaging | 0.16, 0.24 µm | 5 | 75 | Comp | GALEX | |
| X-Ray Imaging | 0.5 8 keV | 17 | 2 | 30 | Arch | CXO |
| Spectrophotometry (strips) | 0.36 - 0.69 µm | 0.9 0.5 | 75 | SINGS | Steward, CTIO | |
| Spectrophotometry (centers) | 0.36 - 0.69 µm | 0.33 0.33 | 75 | SINGS | Steward, CTIO | |
| Spectrophotometry (nuclei) | 0.36 - 0.69 µm | 0.04 0.04 | 75 | SINGS | Steward, CTIO | |
| UV Spectra (centers) | 0.12 0.32 µm | 0.17 0.33 | 25 | Arch | IUE |